Posts Tagged ‘OECD’
How GM ‘science’ misled India

For the last decade, the reckoning of what agriculture is to India has been based on three kinds of measures. The one that has always taken precedence is the physical output. Whether or not in a crop year the country has produced about 100 million tonnes (mt) of rice, 90 mt of wheat, 40 mt of other cereals (labelled since the colonial era as ‘coarse’ although they are anything but, and these include ragi, jowar, bajra and maize), 20 mt of pulses, 30 mt of oilseeds, and that mountain of biomass we call sugarcane, about 350 mt, therewith about 35 million bales of cotton, and about 12 million bales of jute and mesta.
The second measure is that of the macro-economic interpretation of these enormous aggregates. This is described in terms of gross value added in the agriculture (and allied) sector, the contribution of this sector to the country’s gross domestic product, gross capital formation in the sector, the budgetary outlays and expenditures both central and state for the sector, public and private investment in the sector. These drab equations are of no use whatsoever to the kisans of our country but are the only dialect that the financial, business, trading and commodity industries take primary note of, both in India and outside, and so these ratios are scrutinised at the start and end of every sowing season for every major crop.
The third measure has to do mostly with the materials, which when applied by cultivating households (156 million rural households, of which 90 million are considered to be agricultural only) to the 138 million farm holdings that they till and nurture, maintains the second measure and delivers the first. This third measure consists of labour and loans, the costs and prices of what are called ‘inputs’ by which is meant commercial seed, fertiliser, pesticide, fuel, the use of machinery, and labour. It also includes the credit advanced to the farming households, the alacrity and good use to which this credit is put, insurance, and the myriad fees and payments that accompany the transformation of a kisan’s crop to assessed and assayed produce in a mandi.
 It is the distilling of these three kinds of measures into what is now well known as ‘food security’ that has occupied central planners and with them the Ministries of Agriculture, Rural Development, Food and Consumer Affairs (which runs the public distribution system), and Food Processing Industries. More recently, two new concerns have emerged. One is called ‘nutritional security’ and while it evokes in the consumer the idea which three generations ago was known as ‘the balanced diet’, has grave implications on the manner in which food crops are treated. The other is climate change and how it threatens to affect the average yields of our major food crops, pushing them down and bearing the potential to turn the fertile river valley of today into a barren tract tomorrow.
These two new concerns, when added to the ever-present consideration about whether India has enough foodgrain to feed our 257 million (in 2017) households, are today exploited to give currency to the technological school of industrial agriculture and its most menacing method: genetically modified (GM) or engineered seed and crop. The proprietors of this method are foreign, overwhelmingly from USA and western Europe and the western bio-technology (or ‘synbio’, as it is now being called, a truncation of synthetic biology, which includes not only GM and GE but also the far more sinister gene editing and gene ‘drives’) network is held in place by the biggest seed- and biotech conglomerates, supported by research laboratories (both academic and private) that are amply funded through their governments, attended to by a constellation of high-technology equipment suppliers, endorsed by intergovernmental groupings such as the UN Food and Agriculture Organisation (FAO) and the Consultative Group on International Agricultural Research (CGIAR), taken in partnership by the world’s largest commodities trading firms and grain dealers (and their associates in the commodities trading exchanges), and amplified by quasi-professional voices booming from hundreds of trade and news media outlets.
This huge and deep network generates scientific and faux-scientific material in lorry-loads, all of it being designed to bolster the claims of the GM seed and crop corporations and flood the academic journals (far too many of which are directly supported by or entirely compromised to the biotech MNCs) with ‘peer-reviewed evidence’. When the ‘science’ cudgel is wielded by the MNCs through their negotiators in New Delhi and state capitals, a twin cudgel is raised by the MNC’s host country: that of trade, trade tariffs, trade sanctions and trade barriers. This we have witnessed every time that India and the group of ‘developing nations’ attends a council, working group, or dispute settlement meeting of the World Trade Organisation (WTO). The scientific veneer is sophisticated and well broadcast to the public (and to our industry), but the threats are medieval in manner and are scarcely reported.
[This is the first part of an article that was published by Swadeshi Patrika, the monthly journal of the Swadeshi Jagran Manch. Part two is here.]
Eating out, or India’s exorbitant world food bill

(This article was published by Vijayvaani in June 2017.)
In the Konkan, small electrically operated oil presses that ingest limited amounts of dried copra to expel oil for households to cook with are common. These can press enough in a day (electricity supply permitting) to fill several dozen glass bottles with coconut oil. As such a filled bottle of freshly pressed coconut oil usually sells for Rs 130 to Rs 160, the price per litre may be estimated at about Rs 180. This price compares quite well with the price range of Rs 190 to Rs 220 that is paid by the household buyer for a litre of branded coconut oil.
But it compares not at all with the trade price of an imported shipment of sunflower-seed or safflower oil which in 2016 was imported into India at an average price of just under Rs 60 per kilogram. India imported 1.53 million tons of sunflower-seed or safflower oil last year, and the Rs 9,080 crore spent on it pushed the total amount spent on imported ‘edible’ oils to beyond the Rs 70,000 crore mark. [The cultivation of oilseeds, like the cultivation of all ‘commercial’ crops that are not food staples, is a matter of crop choice, for which see ‘Why our kisans must make sustainable crop choices’.]
Palm oil
Both by weight and by the total amount paid for it, palm oil is the most visible imported food commodity in India today, and has been for the last five years. In 2016 India imported 8.25 million tons of palm oil (the supplying countries being Malaysia and Indonesia) for which the importing agencies paid Rs 38,900 crore. This immense annual flood of a sort of oil that ought never to have touched our shores let alone ooze into our home kitchens and canteens came at less than Rs 48 per kilogram last year. For this reason – the absurdly low price per landed ton of Malaysian and Indonesian palm oil, a low price that hides from the Indian consumer the deforestation devastation and species extinction in those countries, new cooking oil blends are being shoved into the foods market every other month by the edible oils industry.
Biomedical research which is independent and not either funded by or influenced by the oil palm industry and edible oil traders (which means the world’s largest commodity trading firms) indicates that palm oil, which is high in saturated fat and low in polyunsaturated fat, leads to heart disease. It is considered less harmful than partially hydrogenated vegetable oil, but that is no redemption, for palm oil can under no circumstance be compared to our traditional cooking oils, coconut included.
The colonisation of the Indian kitchen and of the processed foods industry by palm oil has taken place only on the basis of landed price per ton, and that is why this oleaginous menace is now found in many everyday products such as biscuits and crackers and cookies (which school children develop addictions for), snack chips, shampoos, skin care and beauty products, and even pet food. [For a longer discussion on this problem see ‘Let them eat biscuits’ and ‘Cornflakes and oats invasion, 10 rupees at a time’.]
Soya oil
The next largest oily invasion is that of soyabean oil, of which 3.89 million tons (mt) was imported by India in 2016 (3.5 mt in 2015, 2.1 mt in 2014). Most of this was of Argentinian origin, just over 3 mt, and because more than 98% of the soya that is grown in Argentina is genetically modified (GM) the millions of tons of soyabean oil India has imported from that country has been used, blended, fractionated, caked and consumed by humans and animals with no indication about its GM origin and with no tests whatsoever for its effects on human and animal health. In terms of rupees per landed kilogram of soyabean oil, at about Rs 53 it is between palm oil and sunflower-seed or safflower oil. These landed prices show dramatically the effect exporting countries’ subsidies for a commodity category have on the related industry (edible oils) in an importing country.
Just as the vast palm oil plantations in Malaysia and Indonesia have waxed luxuriant in place of the old growth tropical rainforests that were cut down, turning the wildlife of these forests into hapless refugees, swelling the lucrative and thoroughly illegal forest timber trade, so too have the vast soya plantations in Argentina immiserated that country’s rural population and caused hunger because of the soya monocrop that has replaced their food biodiversity and whose need for fertiliser grew (as it did with Bt cotton in India) instead of shrinking. Both these long-drawn out eco-social catastrophes have been prolonged because of the inability or unwillingness of Indian consumers and regulatory agencies to acknowledge the faraway effects of our considerable ‘demand’ for palm oil and soyabean oil.
Pulses
Second to palm oil by weight amongst food commodities imported by India is pulses, of which 6.18 mt were imported in 2016 for a price of Rs 27,700 crore. The annual import pattern of a decade of 4 mt to more than 6 mt of imported pulses last year are a large fraction again of the average 18.7 mt of pulses a year grown in India for the last five years (until 2016-17).
Between 2003-04 and 2009-10 the quantity of pulses (tur or arhar, gram, moong, urad, other kharif and rabi pulses) harvested scarcely changed, averaging 14.2 mt over this period. There was a jump in 2010-11 to 18.2 mt and then another plateau followed until 2015-16, with the average for those six years being 17.7 mt. With the 22.7 mt estimated total pulses harvest in 2016-17, we can hope that another plateau is being scaled, and indeed this pattern of a plateau of several years followed by a modest increase does tend to indicate the following of a more agro-ecological cultivation of pulses (these being in rainfed farms) than intensive cultivation dependent on fertiliser, pesticide and commercial seed. [This does have much to do with cultivation practices in different regions, for which read ‘Seeing the growers of our food and where they are’.]
Sugar
What is a new concern is an item that by weight is fourth on the list of food commodity items imported, and that is sucrose: India imported 2.11 mt in 2016, in 2015 it was 1.6 mt, in 2014 it was 1.37 mt. The country with the greatest consumption of sugar, estimated by the Ministry of Agriculture and the Department of Food and Public Distribution to be around 25 mt per year and growing disproportionately above the natural growth in the number of households, the processed and packaged food sector is the destination for the 2.11 mt of sucrose imported in 2016. A ready consumer for the sucrose is the commercial fruit juice sector, which bases its produce on a small amount of fruit pulp (vegetable extract is often added for bulk), water, chemical preservatives, food-like colours, artificial flavours and sweeteners.
The giant bulk of our sugarcane harvests distract from the ratios calculated – that a ton of raw sugar is obtained from 13 or 14 tons of cane. (This is usually net of jaggery / gur / khandsari and also net of molasses, which is used by distilleries and animal feed.) The mountains of bagasse – the crushed residue from which the sugar has been extracted – which remain are used in the paper and pulp industry, are an ingredient in cattle feed, and are used as biofuel. [Commercial crop or food crop is the question every cultivating household faces. See one district’s example in ‘Masses of cotton but mere scraps of vegetables’.]
Nuts
At 730,000 tons imported in 2016 and under the international trade category of ‘edible fruit and nuts’ is cashew nuts and Brazil nuts, on which Rs 8,345 crore was spent. A second important sub-category is ‘dates, figs, pineapples, avocados, guavas, mangoes and mangosteens, fresh or dried’ and 350,000 tons were imported in 2016 (for Rs 6,204 crore), while 280,000 tons of apples, pears and quinces, 182,000 tons of ‘other nuts, fresh or dried’ were also imported.
Under 23 main categories food commodities, which include 167 sub-categories and more than 400 subsidiary categories, the bill for imported foods (including dairy and beverages) and food products that we purchased from all over the world in 2016 was USD 22,041 million (USD 22.04 billion), or at the average rupee-dollar exchange rate for 2016, Rs 152,088 crore! In 2015 this bill was USD 20,877 million which at the average annual rupee-dollar exchange rate for 2015 was Rs 137,794 crore. In 2014 this bill was USD 19,372 million which at the average annual rupee-dollar exchange rate for 2014 was Rs 123,015 crore.
Globalisation
These amounts are astronomical and underline the strength of globalisation’s thrall by which we are gripped, exerted upon us not only by the World Trade Organisation but also by the agreements that India has signed (or intends to, and demonstrates intent by importing) with regional trade blocs of the European Union, the OECD and ASEAN. The financial allocations to some of the largest central government programmes, and the budgetary sums of some of the biggest successes in the last three years shrink in comparison to the size of these purchases: the spectrum auction in 2015 brought in Rs 110,000 crore, the 2016-17 central government pensions budget of Rs 128,166 crore, the Rs 47,410 crore transferred so far as subsidy directly into accounts under the Direct Benefit Transfer for LPG consumer scheme, the expenditure of Rs 51,902 crore in 2016-17 on MGNREGA (the highest since its inception).
Bringing about stability in farmers’ incomes (let alone an increase), encouraging rural and peri-urban entrepreneurship based on traditional foods cultivated by agro-ecological methods, ensuring that consumers can find [read about the link with inflation in ‘The relative speeds of urban inflation’] and are assured by the quality of food staples which are free of GM ingredients, chemicals and additives, and the saving of enormous sums of money can all be had if we but reduce and then cut out entirely the wanton import of food and beverages, and processed and packaged food products.
Why USAID should quit India and look after America

The ‘Feeding America’ county-level food insecurity map. the social situation confronting the great mass of the population, young and old, is characterised by economic insecurity, depressed wages and unprecedented levels of debt.
There is no practical, moral, democratic and defensible reason any longer for the United States Agency for International Development (USAID) and the United States Department of Agriculture (USDA) to continue to have anything to do in India (or anywhere else) relating to food or hunger or poverty.
This is because the growth of food insecurity in the USA has paralleled the rise in the numbers of those who are poor, by any measure whether in terms of income, lack of access to a balanced diet, lack of access to essential social sector services. According to studies that have been released from late 2013 onwards, the number of households in the USA that live on less than US$2 per day more than doubled between 1996 and 2011, from 636,000 to 1.46 million. Moreover, there are now nearly 3 million children who live in households that earn less than $2 per day.
It is absurd and deeply cynical for the government of Barack Obama, the White House, the US State Department, and a host of top-ranking thinktanks to continue to claim that Indo-American ties require USAID and USDA to continue propagating agricultural models and advocating technology-centric solutions in India to solve our problems of poverty and hunger. India must halt all activity with these two agencies and advise them bluntly to turn inwards – for by their own charters that is where they are needed.
The latest evidence comes from Feeding America, which is the national network of food banks in the USA. It has just released its annual report on local food insecurity which shows that one in six Americans – including one in five children – did not have enough to eat at some point in 2012. The report found that there are dozens of counties where more than a third of children do not get enough to eat. The incidence of hunger has grown dramatically. The percentage of households that are “food insecure” rose from 11.1% in 2007 to 16% in 2012.
According to separate data from the Organisation for Economic Cooperation and Development (OECD), food insecurity is more widespread in the USA than in any other major developed country, with the rate of food insecurity in the US nearly twice that of the European Union average, which is by itself worrying for what purport to be the so-called ‘advanced’ economies (whereas India is ’emerging’).
 That we have a situation wherein USAID and USDA (“from the American people”, is the sanctimonious tagline attached to USAID interference, when the American people do not know what injustice is being done to other people in their name, and when they are being robbed of food so that American foreign policy goals are fulfilled) continue to set aid agendas in South Asia while a fifth of American children are hungry is an international social disaster fostered by the current economic system and its political defenders.
In the USA both Democratic and Republican administrations (there is no real difference) have become adept at starving anti-poverty programmes, but have taken that expertise to new levels under Obama. The US Congress and the White House have overseen two successive food stamp cuts in just six months: first in November 2013, when benefits were slashed US$36 per month for a family of four, and again in January 2014, when benefits were cut by an average of US$90 per month for nearly a million households.
Even when the US Census had signalled the new levels of impoverishment reached by the average household, some US$4.1 billion was cut from the food stamps, or SNAP, programme citing “waste, fraud and abuse”. It is significant to note here that exactly the same kind of language has been used in India to call for the curtailing and eventual dismantling of our Public Distribution System (PDS). In cutting about US$90 a month in benefits for 500,000 households – more than a week’s worth of assistance for a typical American family in need – they now encroached on the US$1.50 per person per meal equation (around Rs 90, which may buy two meagre vegetarian thalis in an Indian city).
The government of the USA has done this at a time when, according to the Stockholm International Peace Research Institute (SIPRI), it spent in 2013 US$640 billion which amounted to 36% of the entire world’s total military expenditure. Still unsatisfied by such heinous perversion, the American White House and Congress discontinued unemployment benefits for some three million people (and their two million dependent children), but continued to stall the prosecution of the financial criminals responsible for the 2008 crash.
The concentration of wealth at one social pole is coupled with disastrous social conditions at the other. A generation of young people in the USA has been thrust into poverty and joblessness – almost 16% of young people aged 25 to 34 have incomes below the national poverty line. In comparison, 10% of people in the same age group were in poverty in 2000. The median income of young households is $8,000 less than it was in 2000, in real terms.
An inequality chasm is fracturing Europe, warns the OECD

April in Berlin, Germany. A homeless man sat begging for euros or food in the entrance of an S-Bahn station.
Deepening inequalities in income between the richer and poorer families, greater relative income poverty in recent years compared with earlier, a greater burden borne by children and young people than before because of their being relatively poor – these are some of the stark conclusions contained in the OECD briefing, ‘New Results from the OECD Income Distribution Database’.
This is the picture of Europe today (and of the non-European members of the OECD). “Looking at the 17 OECD countries for which data are available over a long time period, market income inequality increased by more over the last three years than what was observed in the previous 12 years,” observed the new briefing, which is sub-titled ‘Crisis squeezes income and puts pressure on inequality and poverty’.

Annual percentage changes in household market income between 2007 and 2010, by income component. Chart: OECD
The figures and data show that many of the countries recording the most dramatic increases in inequality are European countries which have been subjected to punitive austerity measures by the European Union and International Monetary Fund. The OECD report singles out Spain and Italy, where the income of “the poorest 10 percent was much lower in 2010 than in 2007”.
Five percent falls in income (per year) amongst the poorest 10 percent were also recorded in Greece, Ireland, Estonia, and Iceland. The only non-European nation with a comparable level of income decline was Mexico. The report also stated that over the same period, poor families in the United States, Italy, France, Austria and Sweden all recorded income losses in excess of the OECD average.
Indeed the ‘New Results’ briefing has showed that across OECD countries, real household disposable income stagnated. Likewise, the average income of the top 10% in 2010 was similar to that in 2007. Meanwhile, the income of the bottom 10% in 2010 was lower than that in 2007 by 2% per year. Out of the 33 countries where data are available, the top 10% has done better than the poorest 10% in 21 countries.
This is the OECD picture till 2010. Since then, recession has been the companion of inequality. With an average growth of -0.2 per cent in the first quarter (against -0.1 per cent in the EU as a whole) and hardly better prospects for the whole rest of the year (-0.7 per cent), according to Eurostat, the dreaded “double dip” has become a reality. The press attributes the result largely to the austerity policies.
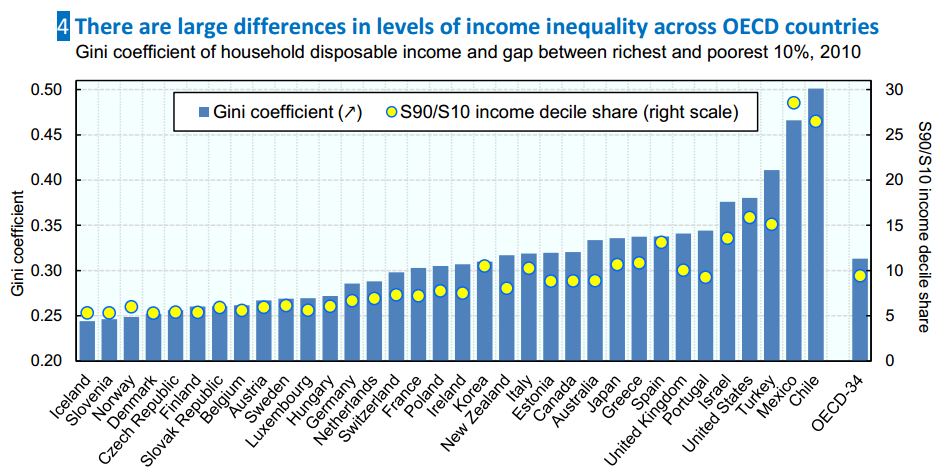
Gini coefficient of household disposable income and gap between richest and poorest 10%, 2010: Chart: OECD
“Eurozone sets bleak record of longest term in recession,” reported the Financial Times. The daily noted that “this latest dismal record came after unemployment hit 12.1 per cent in the bloc, its highest level,” and that this data “is likely to add to pressure on the European Central Bank to take further action after cutting interest rates this month, and to revise down its economic forecast predicting a recovery later in the year.”
Moreover, relative income poverty – the share of people having less income than half the national median income – affects around 11% of the population on average across OECD countries. Poverty rates range between 6% of the population in Denmark and the Czech Republic to between 18% and 21% in Chile, Turkey, Mexico and Israel. Over the two decades up to 2007, relative income poverty increased in most OECD countries, particularly in countries that had low levels of income poverty in the mid-1990s.
In Sweden, Finland, Luxembourg and the Czech Republic, the income poverty rate increased by 2 percentage points or more. In Sweden, the poverty rate in 2010 (9%) was more than twice what it was in 1995 (4%). Relative poverty also increased in some countries, such as Australia, Japan, Turkey and Israel, with middle and high levels of poverty.
The OECD briefing has stated bluntly: “Households with children were hit hard during the crisis. Since 2007, child poverty increased in 16 OECD countries, with increases exceeding 2 points in Turkey, Spain, Belgium, Slovenia and Hungary.” The ‘New Results’ briefing added: “Since 2007, youth poverty increased considerably in 19 OECD countries. In Estonia, Spain and Turkey, an additional 5% of young adults fell into poverty between 2007 and 2010. In the United Kingdom and Ireland, the increase was 4%, and in the Netherlands 3%.”

Annual percentage changes in household disposable income between 2007 and 2010, by income group. Chart: OECD
Between 2007 and 2010, average relative income poverty in the OECD countries rose from 12.8 to 13.4% among children and from 12.2 to 13.8% among youth. Meanwhile, relative income poverty fell from 15.1 to 12.5% among the elderly. This pattern confirms the trends described in previous OECD studies, with youth and children replacing the elderly as the group at greater risk of income poverty across the OECD countries.
These results only tell the beginning of the story about the consequences of austerity, growing unemployment, the burden on children and youth, and burden on immigrant wage labour. The OECD data describes the evolution of income inequality and relative poverty up to 2010. But “the economic recovery has been anaemic in a number of OECD countries and some have recently moved back into recession”, said the briefing.
Worse, since 2010, many people exhausted their rights to unemployment benefits. In such a situation, the briefing has warned, “the ability of the tax-benefit system to alleviate the high (and potentially increasing) levels of inequality and poverty of income from work and capital might be challenged”. These are unusually blunt words from the OECD and their use reflects the depth and persistence of the crisis of modern, reckless, destructive capitalism in Europe.
The year the GM machine can be derailed

In the Uttara Kannada district of Karnataka state in India, farmers heap harvest residue, accompanied by a cow, a cattle egret and a dog (yes he’s there, behind the stack!).
It is looking like a good start to a year in which GM foods and GM crops can be further purged from our fields, shops and pantries. Through 2012 November and December, there were reports from the continents of Africa and South America that such crops and seeds were either being banned or that decisions concerning their use were being discussed, and pending those decisions the use of these crops and seeds would not be permitted.
Writing in The Guardian, John Vidal has barracked the UK government’s enthusiasm for GM and has said this enthusiasm (in Britain’s official, corporatised, retailed decision-making circles) is not matched in developing nations. Vidal has written: “Across the world, countries are turning their backs on GM crops; perhaps the coalition in the UK could learn something from them”.

Early morning in the Uttara Kannada district of Karnataka state in India, and a farmer leads his cattle to fields.
What is remarkable, Vidal’s article has said, “is not that GM crops have, after 20 years and so much money spent, now reached 19 out of more than 150 developing countries, but that most nations have managed to keep out a rapacious industry, and that only a handful of GM food commodity crops like oilseed rape, soya and maize are still grown, mainly for animals and biofuels”. Well, yes and sadly a bit of ‘no’ too.
Although Vidal is right about the more rapacious elements of the GM/GE/DNA-manipulation industry (aren’t they all that way though?) may have been kept out of direct markets, the arguments about labelling and about monitoring (independently, which needs civic capacity, which is hardly there in the South, for instance in India) are taking place while food with GM material can be found on shop shelves. Cottonseed oil for example, which is pressed out of GM cotton, is said to be used as an alternative to other edible oils for cooking.
There’s no doubt left whatsoever that the role of genetically modified food in our food chain is a highly contested political issues. In a long, carefully argued and copiously referenced article, the Soil Association’s Peter Melchett dismantles the pro-GM lobby’s staking of the ‘scientific high-ground’. In the essay, intriguingly titled ‘The pro-GM lobby’s seven sins against science’, Melchett has said this lobby has been good at “simultaneously positioning itself as the voice of reason and progress, while painting its opponents as unsophisticated ‘anti-science’ luddites, whose arguments are full of dogma and emotion, but lack scientific rigour”.
Powerful forces in Western society have been promoting genetic engineering (now usually genetic modification – GM) in agricultural crops since the mid-1990s, Melchett has written. I would have added that these “powerful forces” are in no small measure aided and abetted by potentially more powerful forces in the countries of the South (like India) that are interested in the same – vast and detailed control over the cultivation of primary crop and the consumption of industrially processed and retailed food.

Spanking new agricultural machinery on the highway, southern India. A government-industry answer to the loss of cultivation labour that is chivvied into the cities by adverse economics.
These forces, Melchett has written, “have included many governments, in particular those of the USA and UK, powerful individual politicians like George Bush and Tony Blair, scientific bodies like the UK’s Royal Society, research councils, successive UK Government chief scientists, many individual scientists, and companies selling GM products”. They have ignored the views of citizens, he has added, and most sales of GM food have relied on secrecy – denying consumers information on what they are buying. Very true. If there is ignorance to be found in the ‘western’ consumer (let us say the consumer in the western European OECD countries) concerning GM foods and GM crops, then the ignorance quotient is far higher in the consumers of let’s say the BRICS and ASEAN countries – which of course works to the advantage of the alliance of powerful forces.
Despite the efforts of the ag-biotech, industrial agriculture and processed and retailed food sector worldwide (with its dense financial and political inter-linkages), there are 20 states in the USA which are currently embroiled in fierce battles over GM labelling, strenuously opposed by the GM combine. GM cotton is widely grown in India and China, but GM foods are largely limited to the USA and South America. Brazil grows 29 million hectares of GM soy and maize, and Argentina slightly less, but Mexico has delayed the introduction of GM maize until this year, Peru has approved a 10-year moratorium on the import and cultivation of GM seeds, and Bolivia has committed to giving up growing all GM crops by 2015. In Central America Costa Rica is expected to reject an application from a Monsanto subsidiary to grow GM corn.
The four degree doom
 Conducted by the Potsdam Institute for Climate Impact Research (PIK) and Climate Analytics in Berlin, the report, ‘Turn Down The Heat’, released this month just before the next round of climate change negotiations begin in Doha, Qatar, discusses bluntly the frightening risks of a future without climate policy.
There are several sharp and extremely urgent messages for politicians and policy-makers alike in the Potsdam report. Politicians, whether in the OECD countries or in the BRICS or in the G20, have proven themselves time and again, year after year, to favour the enrichment of themselves and their constituencies over any consideration of a shared planet and a cooperative future. What do we have left? Policy-makers, bureaucrats, NGO and community representatives and hundreds of thousands of concerned citizens in our countries, and so it becomes necessary that these are the people who read and digest what Potsdam has had to say.
What does the Potsdam Institute for Climate Impact Research and Climate Analytics have to say? “Humankind’s emissions of greenhouse gases are breaking new records every year. Hence we’re on a path towards 4-degree global warming probably as soon as by the end of this century. This would mean a world of risks beyond the experience of our civilisation – including heat waves, especially in the tropics, a sea-level rise affecting hundreds of millions of people, and regional yield failures impacting global food security.”
As usual, it is the poorest in the world are those that will be hit hardest, the researchers conclude, making development without climate policy almost impossible. But we have to ask – how possible is it with the current apology of climate policy? What is popularly called the “global community” by the world’s mainstream media (most of which is owned by corporations, politicians or both) is considered to have committed to holding warming below 2°C to prevent “dangerous” climate change. This is rubbish, and the Potsdam report all but says so: “The sum total of current policies – in place and pledged – will very likely lead to warming far in excess of this level. Indeed, present emission trends put the world plausibly on a path toward 4°C warming within this century.”

The increase in total ocean heat content from the surface to 2000 m, based on running five-year analyses. Reference period is 1955–2006. The black line shows the increasing heat content at depth (700 to 2000 m), illustrating a significant and rising trend, while most of the heat remains in the top 700 m of the ocean. Vertical bars and shaded area represent +/–2 standard deviations about the five-year estimate for respective depths. Chart: Potsdam Institute for Climate Impact Research (PIK)
As I am intimately concerned with agriculture and food and therefore the effects of a changing climate upon them, I turned to that section of the ‘Turn Down The Heat’ report (get the pdf here). The Potsdam researchers said that projections for food and agriculture over the 21st century indicate substantial challenges irrespective of climate change. They added: “As early as 2050, the world’s population is expected to reach about 9 billion people and demand for food is expected to increase accordingly.”
Here I found the first problem, and that indicated yet again that the climate scientists are good at modelling climate, but bad at understanding how the food system (not the natural one, the corporate one) actually works. What is more correct in my view is that primary agricultural produce at current levels is enough to feed a growing population for the next two generations provided (1) food crops such as maize are not grown to provide biofuel, (2) meat in all its hideous factory-farmed forms is drastically reduced in all agro-ecological regions, (3) the huge inventories held by the regional and global food processing and food retail industries are drastically cut down (that their businesses are shut down).
The Potsdam report continued that “based on the observed relationship between per capita GDP and per capita demand for crop calories (human consumption, feed crops, fish production and losses during food production)” it is reasonable (from the evidence it cites) to “project a global increase in the demand for crops by about 100 percent from 2005 to 2050”. It mentions “other estimates for the same period project a 70 percent increase of demand” and that “several projections suggest that global cereal and livestock production may need to increase by between 60 and 100 percent to 2050, depending on the warming scenario”.
Here I found the second problem. What is meant by these expert reports when they talk about the relationship between per capita GDP and per capita demand for crop calories? Beyond a localised recommended daily dietary allowance designed to provide proper nutrition, extra consumption of food calories (and protein and fats and sugar and micro-nutrients) can no longer be seen as expected to rise in parallel with rising income (where is income rising in real terms anyway, my thermometric friends, other than for the 1% who are causing most of this trouble in the first place?). The reform of diet and the return of local slow food is the answer to those complex, altogether unnecessary equations that posit 40%, 50%, 70% or 100% increases in food production over X, Y or Z years.
Then, the Potsdam report goes on to say that “the historical context can on the one hand provide reassurance that despite growing population, food production has been able to increase to keep pace with demand and that despite occasional fluctuations, food prices generally stabilise or decrease in real terms”.
Here I found the third problem and it is, as the more laid-back of Americans tend to say, it’s a doozy. What’s the historical context? Is it the Green Revolution by any chance? Is it the mutation of hybrid agri into bio-tech agri? Considering that the climate scientists are the ones who are very familiar with the gases now crowding our atmosphere, have they not made the connection between industrial, synthetic, high-external input agriculture and the nitrification of the atmosphere they’re so good at measuring? I’ll bet they are, so how can they point to the relentless growth of primary crop tonnage as a “reassurance” when it’s in fact the opposite?
That’s my quick reaction to the food growth part of what they have said. As for “food prices generally stabilise or decrease in real terms”, clearly they don’t consult even the mild-mannered FAO food price index, which has entered in 2012 November yet another month of its high plateau which makes it the longest sustained maintenance of elevated food price index since it began. The climate scientists are good at climate, but they surely need a crash course in understanding how the corporations and their patrons, those pesky politicians who are preparing for another jaw-jaw in Doha, exploit climate change for profit, and that includes making an extra penny out of a kilo of wheat flour, never mind the weather outside.
Energy, climate, growth, China, India – the World Energy Outlook 2012

Inputs to the power sector to generate electricity accounted for 38% of global primary energy use in 2010, the single largest element of primary demand. In the New Policies Scenario, this share rises to 42% in 2035. Demand for electricity is pushed higher by population and economic growth, and by households and industries switching from traditional biomass, coal, oil and natural gas to electricity. The fuel mix within the power sector changes considerably, with low- and zero-carbon technologies becoming increasingly important. Graphic: IEA, WEO-2012
 In four parts, 18 chapters, four annexes, illustrated by around 300 figures, the chapters supported by about 100 tables, a separate set of data upon which scenarios rest, the World Energy Outlook 2012 of the International Energy Agency (IEA) is a 690-page behemoth. I can only sketch its merest outline here, and in a fleeting way touch upon the knowledge and information it contains.
Drawing on the latest data and policy developments, the World Energy Outlook 2012 presents projections of energy trends through to 2035 and insights into what they mean for energy security, the environment and economic development. “Over the Outlook period, the interaction of many different factors will drive the evolution of energy markets,” said the WEO-2012. “As outcomes are hard to predict with accuracy, the report presents several different scenarios, which are differentiated primarily by their underlying assumptions about government policies.” We are told that the starting year of the scenarios is 2010, the latest year for which comprehensive historical energy data for all countries were available. What are these four scenarios?

Based on preliminary estimates, energy-related CO2 emissions reached a record 31.2 gigatonnes (Gt) in 2011, representing by far the largest source (around 60%) of global greenhouse-gas emissions (measured on a CO2-equivalent basis). Emissions continue to rise in the New Policies Scenario, putting the world on a path that is consistent with a long-term average global temperature increase of 3.6 °C above levels that prevailed at the start of the industrial era. Chart: IEA, WEO-2012
1. The New Policies Scenario – the report’s central scenario – takes into account broad policy commitments and plans that have already been implemented to address energy-related challenges as well as those that have been announced, even where the specific measures to implement these commitments have yet to be introduced.
2. To illustrate the outcome of our current course, if unchanged, the Current Policies Scenario embodies the effects of only those government policies and measures that had been enacted or adopted by mid-2012.
3. The basis of the 450 Scenario is different. Rather than being a projection based on past trends, modified by known policy actions, it deliberately selects a plausible energy pathway. The pathway chosen is consistent with actions having around a 50% chance of meeting the goal of limiting the global increase in average temperature to two degrees Celsius (2°C) in the long term, compared with pre-industrial levels.
4. The Efficient World Scenario has been developed especially for the World Energy Outlook 2012 (WEO-2012). It enables us to quantify the implications for the economy, the environment and energy security of a major step change in energy efficiency.

In the New Policies Scenario, global energy intensity (energy demand per unit of GDP) falls by 1.8% per year between 2010 and 2035. Between 2010 and 2035, energy intensity declines by an average of 37% and 49% in OECD and non-OECD countries respectively. Yet average energy intensity in non-OCED countries in 2035 of 0.16 tonnes of oil equivalent (toe) per thousand dollars of GDP is still more than twice the OECD level. Chart: IEA, WEO-2012
I have extracted five important messages from the summary which are connected to the subjects you find in this blog – food and agriculture, consumer behaviour and its impacts on our lives, the uses that scarce energy is put to, the uses that scarce water is put to, the ways in which governments and societies (very different, these two) view food, energy and water.
Five key messages:
“Energy efficiency can keep the door to 2°C open for just a bit longer.” Successive editions of the World Energy Outlook have shown that the climate goal of limiting warming to 2°C is becoming more difficult and more costly with each year that passes. The 450 Scenario examines the actions necessary to achieve this goal and finds that almost four-fifths of the CO2 emissions allowable by 2035 are already locked-in by existing power plants, factories, buildings, etc. No more than one-third of proven reserves of fossil fuels can be consumed prior to 2050 if the world is to achieve the 2°C goal.
“Will coal remain a fuel of choice?” Coal has met nearly half of the rise in global energy demand over the last decade, growing faster even than total renewables. Whether coal demand carries on rising strongly or changes course will depend on the strength of policy measures that favour lower-emissions energy sources, the deployment of more efficient coal-burning technologies and, especially important in the longer term, CCS. The policy decisions carrying the most weight for the global coal balance will be taken in Beijing and New Delhi – China and India account for almost three-quarters of projected non-OECD coal demand growth (OECD coal use declines).

China makes a major contribution to the increase in primary demand for all fuels: oil (54%), coal (49%), natural gas (27%), nuclear power (57%) and renewables (14%). Its reliance on coal declines from 66% of the country’s primary energy use in 2010 to 51% in 2035. Energy use in India, which recently overtook Russia to become the world’s third-largest energy consumer, more than doubles over the Outlook period. India makes the second-largest contribution to the increase in global demand after China. Chart: IEA, WEO-2012
“If nuclear falls back, what takes its place?” The anticipated role of nuclear power has been scaled back as countries have reviewed policies in the wake of the 2011 accident at the Fukushima Daiichi nuclear power station. Japan and France have recently joined the countries with intentions to reduce their use of nuclear power, while its competitiveness in the United States and Canada is being challenged by relatively cheap natural gas. The report’s projections for growth in installed nuclear capacity are lower than in last year’s Outlook and, while nuclear output still grows in absolute terms (driven by expanded generation in China, Korea, India and Russia), its share in the global electricity mix falls slightly over time.
“A continuing focus on the goal of universal energy access.” Despite progress in the past year, nearly 1.3 billion people remain without access to electricity and 2.6 billion do not have access to clean cooking facilities. Ten countries – four in developing Asia and six in sub-Saharan Africa – account for two-thirds of those people without electricity and just three countries – India, China and Bangladesh – account for more than half of those without clean cooking facilities. The report presents an Energy Development Index (EDI) for 80 countries, to aid policy makers in tracking progress towards providing modern energy access. The EDI is a composite index that measures a country’s energy development at the household and community level.
“Energy is becoming a thirstier resource.” Water needs for energy production are set to grow at twice the rate of energy demand. The report estimates that water withdrawals for energy production in 2010 were 583 billion cubic metres (bcm). Of that, water consumption – the volume withdrawn but not returned to its source – was 66 bcm. The projected rise in water consumption of 85% over the period to 2035 reflects a move towards more water-intensive power generation and expanding output of biofuels.
Such is the barest glimpse of the WEO-2012. There are a number of aspects of the Outlook which deserve more scrutiny with a view to learning energy use and misuse, and this will be expanded upon in the weeks ahead.
The ‘growth’ devotees who have no clothes on

Ah yes the pleasure that is to be had from the slicing up of pies. And when those pies belonged once to the poor, what then, dear OECD? Here, the OECD attempts to show what it means by ‘dramatic’ shifts expected in the balance of the global economy.
They are at it again, the devotees of ‘growth’ as the only, immutable, final, unassailable formula for humankind. This sect is the one that resides in the OECD, that odd grouping of 34 countries which the Organisation for Economic Co-operation and Development says includes “many of the world’s most advanced countries but also emerging countries like Mexico, Chile and Turkey” and which works “closely with emerging giants like China, India and Brazil”. It’s the aura of ‘inclusion’, that 21st century super-buzzword, that such a group works hard to project. The effects and impacts of the OECD’s growth first policies are barely recognised, as rarely within the organisation as within its member governments.
In this latest ‘what if’ exercise (which the OECD excels at – and for which game it employs an unknown number of economists, financial modellers, statisticians, policy ‘experts’, sector specialists and sundry unemployables – the OECD has said that (1) global growth is good and (2) that it will come from China and India in the next 50 years.
Global growth means nothing to local farmers, to local municipal workers, to primary school teachers, to nurses and resident doctors in community health centres, to family-run retail shops in slums and favelas and in the shanty-towns of the South. But this is not the OECD world and these are not the ears and senses to which the OECD (or for that matter the multilateral lending agencies and their client, pliant, governments) appeal. But global growth means much to the dense network of financiers and the adjutants of capital and the accumulators of wealth and resources on every continent and in every odorous capital city, hence it must be reinforced as the overweening dogma of our era and never mind the over-fishing, over-extraction, over-feeding, the transgressing of ecological boundaries near and far.
And so it is that the world’s comprador media parrots the lines, reapplies the make-up. “The US is likely to cede the top spot to China in the next three years while India will also surpass the US over the long term, an OECD report said,” according to Emerging Markets, one such media outlet. “Global growth, though at a declining rate, will be sustained by emerging markets between now and 2060 when the global economy will grow at around 3% per year on average.”
This new piece of quasi-intellectual chicanery from the OECD has called it a shift in the balance of economic power, a dramatic shift “over the next half century, with fast-growing emerging-market economies accounting for an ever-increasing share of global output” and major changes in country shares in world GDP. Hence, ‘Looking to 2060: Long-term global growth prospects’ has predicted: “On the basis of 2005 purchasing power parities, China is projected to surpass the Euro Area in a year or so and the United States in a few more years, to become the largest economy in the world, and India is projected to surpass Japan in the next year or two and the Euro area in about 20 years”.
The idiom is no different from what it was in 2002 and indeed what it was in 1992 – such is the inertia that macroeconomics blankets itself with, such is the comfort zone into which the middle classes of these “emerging economies” have been shepherded and who need, from time to time, reminders that their outsized appetites – for personal and family wealth, for processed food, for automobiles and air-conditioners and gadgets and equated monthly installments of every hue – are the only tolerable and acceptable normal. Growth after all is the best tonic for a suffering planet and for the legions of poor, whether in Caracas or Colombo.

Remember that these awesome columns pay no attention to “unsustainable use of natural resources and services from the environment”. How OECD plots many acts of drama in the global economy.
This foggy and destructive school of thought is what leads to sterile statements such as “divergent long-term growth patterns lead to radical shifts in the relative size of economies”. Who cares about these divergent long-term growth patterns when they’re far more occupied with whether the medicines needed to treat their childrens’ fever are going to be affordable tomorrow and whether they should buy a couple of kilos more of flour to guard against a further spike in the price of that essential food next week? But such street and household concerns to not, in the spreadsheets of the OECD technicians, compute.
So we are told that the “United States is expected to cede its place as the world’s largest economy to China, as early as 2016” and that “the two Asian giants [China and India] will soon surpass the collective economy of the G7 nations”. Brazen within the rosy clouds of their fantasies, the OECD technicians (lotus-eaters in spadefuls) have no qualms about admitting what they have left out of their dreams: that “in keeping with the long-term focus, possible repercussions on trend output of prolonged period of deficient demand are ignored”, that “the resulting long-term scenario provides a relatively benign long-term outlook for the global economy”, that “the possibility of disorderly debt defaults, trade disruptions and possible bottlenecks to growth due to an unsustainable use of natural resources and services from the environment” are all happily kept out of the dream. “Talk sense to a fool and he calls you foolish,” Euripedes had counselled, and so we stand advised when confronted with such folly.
What India is to the world, what Indians will struggle with

Children in a village in the district of Krishnagiri, Tamil Nadu
From within India (Bharat, we call it) there are ever more worrying signs that the club of rich and inter-connected global corporations, financial entities and their political patrons are working in concert to fulfil their programme of rapid and sweeping change in the country. Inside India, the government of the day, a technical coalition led by the Congress Party (the Indian National Congress it its full name) has for the past two years ignored widespread public movements against corruption, against the rise in food prices, against the blatant manner in which the country’s political and industrial elite has thrived in conditions that have led to the continuing impoverishment of the rural and urban poor.

In a joint call to G20 country governments, the WTO and the OECD said: “The difficulties generated by the global economic crisis, with its many facets, are fuelling the political and economic pressures put on governments to raise trade barriers. This is not the time to succumb to these pressures.” What will that call, if acted upon, do to the lives of these two Indians, one very young, the other unconcerned by the machinations of the capitalists but nonetheless affected by them?
This group includes politicians and their families and cronies (regardless, mostly, of party and political affiliation (the parties of the Left excepted)), what is commonly referred to as ‘India Inc.’ by which is meant the country’s large and medium businesses, led by all those who have found inclusion in the list of the top 100 most wealthy Indians (see the latest odious ranking by Forbes magazine’s India edition), and it also includes the senior corporate and industrial associations in India and abroad (several based in the USA, which bring together the most exploitative elements of the American capitalist class who find common cause with their Indian counterparts, and who can count on the strengthening of Indo-American ties whether economic, financial, defence, agricultural or scientific to pursue their agenda) which are regularly and well represented in the World Economic Forum for example. Also ranged against the Indian (the Bharatiya) proletariat are the OECD, the IMF, the World Bank, the ADB, the several dozen thinktanks funded through government back channels and innocuous-sounding foundations apparently dedicated to ‘low carbon’ growth or ‘sustainable development’ or even water and sanitation – their cover stories all sound alike.
And it is this group that sets the agenda for India between now and say 2020. The signs of how the concert is directed become plainer to see with each passing month. Let us look at a few of the many signals that have come to public attention recently. The most recent is the ‘Second Quarter Review of Monetary Policy 2012-13’, by the Reserve Bank of India (the country’s central bank), which was released at the end of October 2012. This report bemoaned the “global slowdown and uncertainty” amidst which “the Indian economy remains sluggish, held down by stalled investment, weakening consumption and declining exports”. In this report however the governor of the RBI said that “recent policy initiatives undertaken by the Government have begun to dispel pervasive negative sentiments… As the measures already announced are implemented and further reforms are initiated, they should help improve the investment climate further”.

The Reserve Bank of India’s projections about the turns India’s wholesale price index can take. Yes, and what about the real price of ‘dal’ and ‘roti’?
Now consider a report released by the OECD (the Organisation for Economic Co-operation and Development) entitled ‘India – Sustaining High And Inclusive Growth’ (pdf). This is part of the OCED’s ‘Better Policies’ Series, a sinister name for strong-arm pressure which the OECD describes as promoting “the OECD’s policy advice to the specific and timely priorities of member and partner countries, focusing on how governments can make reform happen“.
Reform according to the OECD and the agents of primitive accumulation means turning the rural and urban poor into households dependent upon hand-outs, destroying the public sector, turning over public goods to corporations, shutting down social sector services like healthcare and education and turning them into profit centres for corporations using methods like public-private partnership. ‘Reform’ also hastens the creation of that class so beloved of the global marketers and their comrades in our government whose effort it is to purloin resources, engender urbanisation, monetise an apology for tertiary education in the name of ‘faster and more inclusive growth’ – it has done so in China (under a quite different guise) and is doing so in India. Consult this product, ‘The $10 Trillion Prize: Captivating the Newly Affluent in China and India’ (Harvard Business Press Books) which breathlessly advises: “Meet your new global consumer. You’ve heard of the burgeoning consumer markets in China and India that are driving the world economy. But do you know enough about these new consumers to convert them into customers? Do you know that there will be nearly one billion middle-class consumers in China and India within the next ten years? More than 135 million Chinese and Indians will graduate from college in this timeframe, compared to just 30 million in the United States?”
This is what the OECD report has said about India: “The potential for sustained strong growth is high. The Indian population is young by international comparison and this together with declining fertility has led to a falling youth dependency rate. The national savings rate is also high and, given favourable demographics, could well rise further in the medium term, providing the capital needed to fund investment in infrastructure as well as strong expansion in private enterprise. Furthermore, despite employment rising in the industrial and service sectors, around half of all workers remain in low value-added agriculture. The scope is therefore enormous for economy-wide productivity gains from the further migration of workers into modern sectors.” Indeed, who will then produce the food India needs for her modest and still mostly vegetarian diet?

The image used by the OECD for its India report. Throw out the public sector and turn over health, transport, energy and education to the corporations, the OECD has told its India collaborators.
What stands out here is the sort of language used, so common now in these inter-governmental circles of avarice and resource-grab, so worryingly mirrored in the pronouncements by India’s ruling coalition politicians and its central planners and their hired guns in compromised ‘research’ thinktanks and ‘policy advice’ units. Thus they have talked about fully reaping the “benefits of the demographic dividend” and of supporting “a return to high and more inclusive growth” (India’s Eleventh and Twelfth Five Year Plan documents reek of this statement). Thus they have repeated as a chant that “India needs to renew its commitment to sound macroeconomic policy and implementation of reforms”. The imperative given is clear and will be enforced by all arms of the executive and those opposing are threatened by punitive action, for they insist that “public finances on a sound footing and improving the fiscal framework so that persistent large deficits do not undermine macroeconomic stability and investor confidence“.
You see the importance given to ‘investor confidence’ by the governor of the RBI, by the OECD overlords and recently, by the prime minister of India Manmohan Singh. First, on 15 September 2012 he told a meeting of India’s Planning Commission that “the most important area for immediate action is to speed up the pace of implementation of infrastructure projects. This is critical for removing supply bottlenecks which constrain growth in other sectors, and also for boosting investor sentiment to raise the overall rate of investment“. Singh added that where “macro-economic balance” is concerned, the [Twelfth Five-Year) Plan (2012-17) “envisages a substantial acceleration of growth. This is critically dependent on raising the rate of investment in the economy. The investment environment is therefore critical.” Second, on 20 September 2012 in a statement he made clarifying this government’s decision to permit foreign investment in the retail sector he said: “We are at a point where we can reverse the slowdown in our growth. We need a revival in investor confidence domestically and globally. The decisions we have taken recently are necessary for this purpose.”

Members of a self-help group in the district of Krishnagiri, Tamil Nadu, at their weekly meeting.
Where is the common Indian, the resident of Bharat, in all this? The government of India and the Reserve Bank of India say they are worried that what they call “headline WPI (wholesale price index) inflation” remained at above 7.5% (calculated only over a year) through the first half of 2012-13 (that means April to September 2012). The truth is far more severe. Retail prices per kilogram of cereals and pulses have in every single city and town in India have increased, from early 2006, by between 180% and 220%. This when the daily wages for those who spend 55% to 65% of their income on food have increased over the same period by no more than 50%. And instead, the prime minister and his advisers say foreign direct investment will provide more jobs and better wages. Did 25 years of structural adjustment as rammed down the throats of millions of citizens in the countries of the South, by the International Monetary Fund and the World Bank in collusion with an earlier generation of elite accumulators, sound any different?
Right-sizing the 2050 calculus on food and population

A man walks away with a bag of rice at a food distribution centre in Tarenguel, Gorgol region, in Mauritania in May 2012. A full third of the country’s population, amounting to around a million people, are at risk of severe malnutrition if rain doesn’t fall by July. Photo: AlertNet / Reuters / Susana Vera
Ever since October 2011 when the world’s seventh billion person was born, there has been a new flurry of articles and prognoses about the need to increase ‘global’ food production to feed a ‘global’ population. While this may be all very well for earth systems scientists and researchers who are accustomed to dealing with planetary scale, those in charge of planning for agriculture at national and sub-national levels find it difficult enough relating to their own numbers (in India, the population of the smallest states are between 1 and 2 million, while that of the largest, Uttar Pradesh, is close to 200 million (!) which if it were a country would be placed between the fourth and fifth most populous countries – Indonesia and Brazil).
Through this year, numerous inter-governmental agencies and large organisations – including the FAO, WFP and IFAD – have discussed the need to be able to feed a population of nine billion, which we are expected to be in 2050 or thereabouts. And so says, recently, the ‘Sustainable Agricultural Productivity Growth And Bridging The Gap For Small-Family Farms’, which is the ‘Interagency Report to the Mexican G20 Presidency’ (12 June 2012).
Explaining that “the growing global demand for food, feed and biofuel is well established”, this inter-agency report has said that income growth will increase the quantity and change the composition of agricultural commodity demand. I find this approach a troublesome one because on the one hand there is growing recognition (even if corrective action is small and mostly symbolic) that consumption is to sustainable the way energy efficiency is to total energy use. Why are large agency and inter-agency reports continuing to skirt a matter which should be dealt with head-on – that consumption of food by the populations of ‘developing’ countries, on the lines of that practiced by the populations of OECD countries – cannot be encouraged by the food MNCs and the global food retail consortia?

A man gestures at a compound belonging to the World Food Programme as it is being looted in Abyei, in this United Nations Mission in Sudan (UNMIS) handout photo taken in May 2011. Photo: AlertNet / Reuters / Stuart Price / UNMIS
It is because of this consistent refusal to see – and name – the elephant in the room that this report, to the Mexican G20 Presidency, has said: “Significant increases in production of all major crops, livestock and fisheries will thus be required”.
What are the estimates provided? “Estimates indicate that by 2050, agricultural production would need to grow globally by 70% over the same period, and more specifically by almost 100% in developing countries, to feed the growing population alone… ” I am puzzled by the easy acceptance of this simple equation by the following agencies and institutions, all of whom have contributed to this report: Bioversity, CGIAR Consortium, FAO, IFAD, IFPRI, IICA, OECD, UNCTAD, Coordination team of UN High Level Task Force on the Food Security Crisis, WFP, World Bank, and WTO.
There is a mathematics here that is eluding me. The estimate is that from now until 2050, world population will grow around 30% – from the current 7 billion to an estimated 9.1 billion. However, if population grows at 30%, why must the available food (excluding biofuels demand) grow at 70% over the same period? It is extremely difficult for most people (earth system scientists excluded) to make sense of such large numbers. In order to break up large numbers into more familiar terms, I have (from UN’s World Population Prospects 2010) extracted the following data. These are the populations of France, DR Congo, Thailand, Turkey and Iran, these are the world’s 21st to 17th most populous countries (in that order).

People buy food at a vegetable market in Tripoli in August 2011. Photo: AlertNet / Reuters / Youssef Boudlal
In 2012 their populations are: France 63.5 million, DR Congo 69.6 m, Thailand 69.9 m, Turkey 74.5 m, and Iran 75.6 m. Let’s not try to strain to look ahead as far as 2050 (by which time some of us will have returned to our ecosystems as dust or as ashes) but look to 2027, or 15 years ahead. Then, the populations will look like this: France 67.7 million, DR Congo 99.6 m, Thailand 73.1 m, Turkey 85.1 m and Iran 83.7 m.
Thus we see that, as the ‘Interagency Report to the Mexican G20 Presidency’ has explained, it is indeed some ‘developing’ countries which will need to provide for considerably more food being grown and made available – DR Congo will have, in this short span of years, 30 million more people! Turkey will have more than 10 million more! The growth – again for the 2012 to 2027 period alone – is France 7%, DR Congo 43%, Thailand 5%, Turkey 14% and Iran 11%.
Does it then still make sense to speak of 2050 horizons and 2.1 billion more people when we are at best talking to national planners, sectoral administrators and thematically-oriented agencies accustomed more to district boundaries than continental spreads? I say it doesn’t – and the less time and money and conferencing we expend on these beyond-humanscale numbers the more sense we will make to those in need of guidance. The question then resolves itself as being more prickly, and more in need of hard answers – if the 30 million additional people in DR Congo are to choose a diet that has 50% less meat and 50% more indigenous vegetables and tubers and roots in it, will DR Congo still – over this period alone – need to plan for growing 43% more food (grain) to keep pace with population growth? Will Turkey need to do the same (time to encourage more çorbasi and less schwarma perhaps!)?
