Posts Tagged ‘Indonesia’
Eating out, or India’s exorbitant world food bill

(This article was published by Vijayvaani in June 2017.)
In the Konkan, small electrically operated oil presses that ingest limited amounts of dried copra to expel oil for households to cook with are common. These can press enough in a day (electricity supply permitting) to fill several dozen glass bottles with coconut oil. As such a filled bottle of freshly pressed coconut oil usually sells for Rs 130 to Rs 160, the price per litre may be estimated at about Rs 180. This price compares quite well with the price range of Rs 190 to Rs 220 that is paid by the household buyer for a litre of branded coconut oil.
But it compares not at all with the trade price of an imported shipment of sunflower-seed or safflower oil which in 2016 was imported into India at an average price of just under Rs 60 per kilogram. India imported 1.53 million tons of sunflower-seed or safflower oil last year, and the Rs 9,080 crore spent on it pushed the total amount spent on imported ‘edible’ oils to beyond the Rs 70,000 crore mark. [The cultivation of oilseeds, like the cultivation of all ‘commercial’ crops that are not food staples, is a matter of crop choice, for which see ‘Why our kisans must make sustainable crop choices’.]
Palm oil
Both by weight and by the total amount paid for it, palm oil is the most visible imported food commodity in India today, and has been for the last five years. In 2016 India imported 8.25 million tons of palm oil (the supplying countries being Malaysia and Indonesia) for which the importing agencies paid Rs 38,900 crore. This immense annual flood of a sort of oil that ought never to have touched our shores let alone ooze into our home kitchens and canteens came at less than Rs 48 per kilogram last year. For this reason – the absurdly low price per landed ton of Malaysian and Indonesian palm oil, a low price that hides from the Indian consumer the deforestation devastation and species extinction in those countries, new cooking oil blends are being shoved into the foods market every other month by the edible oils industry.
Biomedical research which is independent and not either funded by or influenced by the oil palm industry and edible oil traders (which means the world’s largest commodity trading firms) indicates that palm oil, which is high in saturated fat and low in polyunsaturated fat, leads to heart disease. It is considered less harmful than partially hydrogenated vegetable oil, but that is no redemption, for palm oil can under no circumstance be compared to our traditional cooking oils, coconut included.
The colonisation of the Indian kitchen and of the processed foods industry by palm oil has taken place only on the basis of landed price per ton, and that is why this oleaginous menace is now found in many everyday products such as biscuits and crackers and cookies (which school children develop addictions for), snack chips, shampoos, skin care and beauty products, and even pet food. [For a longer discussion on this problem see ‘Let them eat biscuits’ and ‘Cornflakes and oats invasion, 10 rupees at a time’.]
Soya oil
The next largest oily invasion is that of soyabean oil, of which 3.89 million tons (mt) was imported by India in 2016 (3.5 mt in 2015, 2.1 mt in 2014). Most of this was of Argentinian origin, just over 3 mt, and because more than 98% of the soya that is grown in Argentina is genetically modified (GM) the millions of tons of soyabean oil India has imported from that country has been used, blended, fractionated, caked and consumed by humans and animals with no indication about its GM origin and with no tests whatsoever for its effects on human and animal health. In terms of rupees per landed kilogram of soyabean oil, at about Rs 53 it is between palm oil and sunflower-seed or safflower oil. These landed prices show dramatically the effect exporting countries’ subsidies for a commodity category have on the related industry (edible oils) in an importing country.
Just as the vast palm oil plantations in Malaysia and Indonesia have waxed luxuriant in place of the old growth tropical rainforests that were cut down, turning the wildlife of these forests into hapless refugees, swelling the lucrative and thoroughly illegal forest timber trade, so too have the vast soya plantations in Argentina immiserated that country’s rural population and caused hunger because of the soya monocrop that has replaced their food biodiversity and whose need for fertiliser grew (as it did with Bt cotton in India) instead of shrinking. Both these long-drawn out eco-social catastrophes have been prolonged because of the inability or unwillingness of Indian consumers and regulatory agencies to acknowledge the faraway effects of our considerable ‘demand’ for palm oil and soyabean oil.
Pulses
Second to palm oil by weight amongst food commodities imported by India is pulses, of which 6.18 mt were imported in 2016 for a price of Rs 27,700 crore. The annual import pattern of a decade of 4 mt to more than 6 mt of imported pulses last year are a large fraction again of the average 18.7 mt of pulses a year grown in India for the last five years (until 2016-17).
Between 2003-04 and 2009-10 the quantity of pulses (tur or arhar, gram, moong, urad, other kharif and rabi pulses) harvested scarcely changed, averaging 14.2 mt over this period. There was a jump in 2010-11 to 18.2 mt and then another plateau followed until 2015-16, with the average for those six years being 17.7 mt. With the 22.7 mt estimated total pulses harvest in 2016-17, we can hope that another plateau is being scaled, and indeed this pattern of a plateau of several years followed by a modest increase does tend to indicate the following of a more agro-ecological cultivation of pulses (these being in rainfed farms) than intensive cultivation dependent on fertiliser, pesticide and commercial seed. [This does have much to do with cultivation practices in different regions, for which read ‘Seeing the growers of our food and where they are’.]
Sugar
What is a new concern is an item that by weight is fourth on the list of food commodity items imported, and that is sucrose: India imported 2.11 mt in 2016, in 2015 it was 1.6 mt, in 2014 it was 1.37 mt. The country with the greatest consumption of sugar, estimated by the Ministry of Agriculture and the Department of Food and Public Distribution to be around 25 mt per year and growing disproportionately above the natural growth in the number of households, the processed and packaged food sector is the destination for the 2.11 mt of sucrose imported in 2016. A ready consumer for the sucrose is the commercial fruit juice sector, which bases its produce on a small amount of fruit pulp (vegetable extract is often added for bulk), water, chemical preservatives, food-like colours, artificial flavours and sweeteners.
The giant bulk of our sugarcane harvests distract from the ratios calculated – that a ton of raw sugar is obtained from 13 or 14 tons of cane. (This is usually net of jaggery / gur / khandsari and also net of molasses, which is used by distilleries and animal feed.) The mountains of bagasse – the crushed residue from which the sugar has been extracted – which remain are used in the paper and pulp industry, are an ingredient in cattle feed, and are used as biofuel. [Commercial crop or food crop is the question every cultivating household faces. See one district’s example in ‘Masses of cotton but mere scraps of vegetables’.]
Nuts
At 730,000 tons imported in 2016 and under the international trade category of ‘edible fruit and nuts’ is cashew nuts and Brazil nuts, on which Rs 8,345 crore was spent. A second important sub-category is ‘dates, figs, pineapples, avocados, guavas, mangoes and mangosteens, fresh or dried’ and 350,000 tons were imported in 2016 (for Rs 6,204 crore), while 280,000 tons of apples, pears and quinces, 182,000 tons of ‘other nuts, fresh or dried’ were also imported.
Under 23 main categories food commodities, which include 167 sub-categories and more than 400 subsidiary categories, the bill for imported foods (including dairy and beverages) and food products that we purchased from all over the world in 2016 was USD 22,041 million (USD 22.04 billion), or at the average rupee-dollar exchange rate for 2016, Rs 152,088 crore! In 2015 this bill was USD 20,877 million which at the average annual rupee-dollar exchange rate for 2015 was Rs 137,794 crore. In 2014 this bill was USD 19,372 million which at the average annual rupee-dollar exchange rate for 2014 was Rs 123,015 crore.
Globalisation
These amounts are astronomical and underline the strength of globalisation’s thrall by which we are gripped, exerted upon us not only by the World Trade Organisation but also by the agreements that India has signed (or intends to, and demonstrates intent by importing) with regional trade blocs of the European Union, the OECD and ASEAN. The financial allocations to some of the largest central government programmes, and the budgetary sums of some of the biggest successes in the last three years shrink in comparison to the size of these purchases: the spectrum auction in 2015 brought in Rs 110,000 crore, the 2016-17 central government pensions budget of Rs 128,166 crore, the Rs 47,410 crore transferred so far as subsidy directly into accounts under the Direct Benefit Transfer for LPG consumer scheme, the expenditure of Rs 51,902 crore in 2016-17 on MGNREGA (the highest since its inception).
Bringing about stability in farmers’ incomes (let alone an increase), encouraging rural and peri-urban entrepreneurship based on traditional foods cultivated by agro-ecological methods, ensuring that consumers can find [read about the link with inflation in ‘The relative speeds of urban inflation’] and are assured by the quality of food staples which are free of GM ingredients, chemicals and additives, and the saving of enormous sums of money can all be had if we but reduce and then cut out entirely the wanton import of food and beverages, and processed and packaged food products.
So very many of us

The current world population of 7.3 billion is expected to reach 8.5 billion by 2030, 9.7 billion in 2050 and 11.2 billion in 2100, according to ‘World Population Prospects: The 2015 Revision”, which is compiled and issued by the Department of Economic and Social Affairs of the United Nations.
Of particular interest to us is the prediction (based on very sound estimates and the careful curation of data) that some time in 2022 the population of India will exceed the population of China. Currently, the population of China is approximately 1.38 billion compared with 1.31 billion (the UN-DESA estimate as of now) in India.
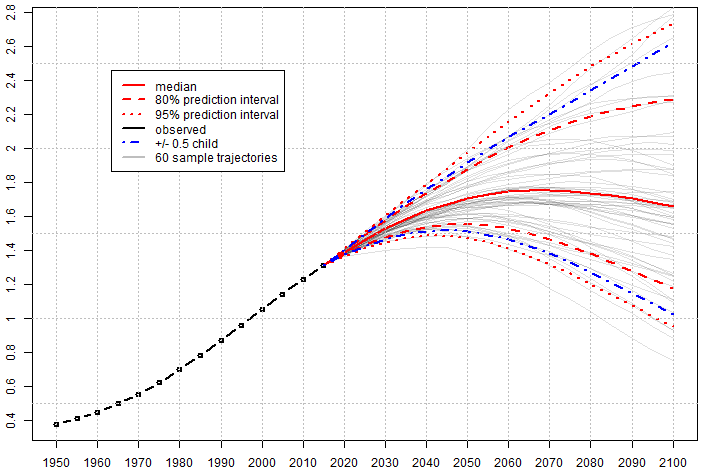
Population growth till here and the fan-tail of predictive projections for the next 85 years. Differing trajectories start becoming visible only from the mid-2020s. Image: UN-DESA
By 2022, both countries are expected to have approximately 1.4 billion people. Thereafter, India’s population is projected to continue growing for several decades to 1.5 billion in 2030 and 1.7 billion in 2050, while the population of China is expected to remain fairly constant until the 2030s, after which it is expected to slightly decrease.
China is now a ‘low fertility country’, that is, one in which women have fewer than 2.1 children, on average, over their life-times. Low-fertility countries now include all of Europe and Northern America, plus 20 countries of Asia. India is an ‘intermediate fertility’ country, that is, where women have on average between 2.1 and 5 children. Intermediate-fertility countries are found in many regions, with the largest being India, Indonesia, Pakistan, Bangladesh, Mexico, and the Philippines.

More urbanisation is expected which will concentrate larger numbers of people into town and city wards. Few will be as ideal as this graphic suggests.
Most of the projected increase in the world’s population can be attributed to a short list of high-fertility countries, mainly in Africa, or countries with already large populations. During 2015-2050, half of the world’s population growth is expected to be concentrated in nine countries: India, Nigeria, Pakistan, D R Congo, Ethiopia, Tanzania, USA, Indonesia and Uganda (listed according to the size of their contribution to the total growth).
Currently, among the ten largest countries in the world, one is in Africa (Nigeria), five are in Asia (Bangladesh, China, India, Indonesia, and Pakistan), two are in Latin America (Brazil and Mexico), one is in Northern America (USA), and one is in Europe (Russia). Of these, Nigeria’s population, currently the seventh largest in the world, is growing the most rapidly. Consequently, the population of Nigeria is projected to surpass that of the USA by about 2050, at which point it would become the third largest country by population in the world.
Ten reliable rice years

The AMIS prices panel as we find it in 2014 January. Weekly international rice prices (top) are for Thai rice, which have been on a plateau from 2012 Jan to around 2013 April, after which they declined. Rice futures prices (60-day average) have also been on a very gentle upward slope (middle) since 2012 Jan after pronounced swings to that point from 2010 Jan. Rice price volatility was dampened during the last quarter of 2011 until third quarter 2013 (compared to the previous two years) and has moved slowly lower over three years (bottom). Charts: FAO-AMIS
International grains traders rarely consider the historicity of what they deal with day in and day out. Wheat up today, maize down tomorrow, soy futures worth considering for next month, milk powder positions to be liquidated, and so on. Hold what you can profit from only so long as there is profit to be made, and futures are nothing but bets you’ve studied carefully.
But even for the hard-boiled traders, the last decade of rice has made them turn to look back and consider the curiosities of the market. Inventories of rice, all over the world, have been growing slowly and steadily for close to a decade. Now that trend, which since 2003 has been one of the longest unbroken trends in world agriculture, is ending. The change is being attributed, in the commodity exchanges and grain trading floors, to what is called a ‘downgrade’ of supplies of rice in India by the International Grains Council.
The first such forecast decline in world rice stocks, of about one million tons, means that the IGC is estimating world rice inventories at the close of 2013-14 to be 108 million tons. The curious aspect is that India is expecting a bumper rice harvest for 2013-14, and although IGC says world inventories will drop slightly (the end of the trend), there is also a reduced estimate for world consumption of rice, which is another curiosity.
According to the traders Thailand, the top rice exporter for years, has been stockpiling rice “at prices some 40%-50% above the market” and thereby prompting credit rating agencies like Moody’s to claim that the cost of the Thai programme was “threatening the country’s sovereign debt rating”.
This is plain rubbish. Traders and commodity exchanges do not grow rice to feed their families and sell if there is a small surplus to sell. The finance bots in predatory agencies like Standard and Poor’s, Moody’s and Fitch – considered the three largest by the scale of their work – don’t know the difference between a cauliflower and millet and can grow neither. Thai, Indian and African small farmers could not care less whether credit rating agencies exist and our governments should learn what true sovereignty means from our small farmers.

The FAO and IGC food price indexes and their sub-indices. For FAO the chart shows the FAO Food price Index and the cereals, oils and fats and dairy sub-indices over the last five years. For IGC the lower chart shows the IGC Grains and Oilseeds Index, also over the last five years, with the wheat, maize and rice sub-indices. The IGC rice sub-index has also recorded a plateau from 2012 January onwards with a more pronounced decline setting in from 2013 August. Charts: FAO-AMIS
The odd tale of rice was given a late twist by two cyclones. One is Cyclone Phailin which struck the eastern Indian coast in the first week of October 2013. And he other is Typhoon Haiyan, which struck the Philippines in early November 2013. Vietnam is to supply 500,000 tons of rice to the Philippines, which has sought the supplies to boost state reserves depleted by the relief operations after Typhoon Haiyan.
The FAO’s Rice Market Monitor for 2013 November said: “Although accounting for much of the worsening in the global outlook, Asia is still expected to sustain growth in world rice production in 2013. According to the latest forecasts, the region is to harvest 672.7 million tonnes (448.6 million tonnes, milled), 1.2% more than in 2012. Foremost among countries responsible for the increase are India, Indonesia, Thailand, Myanmar and Bangladesh. By contrast, drought in China’s central and eastern provinces exacted a heavy toll on the intermediate and late rice crops, which may bring about the first production decline in the country since 2003.”
I find the FAO Rice Market Monitor more detailed than what the IGC puts out (although IGC’s public offerings are but a distillation of what subscribers to the information service obtain). The FAO Monitor has also added that given a poor delivery record so far, Thailand appears unlikely to boost its exports beyond the relatively low level of last year. And that expectations have improved for India, which may replicate the 2012 record performance, with Australia, Cambodia, China (Mainland), Egypt, Pakistan, Paraguay and the USA also forecast to export more.
Why Bharat must tell the WTO to go to hell
Update: So far, India’s Minister for Commerce and Industry has said what our farmers’ need him to say at the WTO ministerial meeting.

Activists protest against the World Trade Organisation (WTO) conference in Bali, Indonesia, on 2013 December 04. Image: AFP
This is good news for our millions of cultivator households, and is also good news for cultivating families and communities in the countries of the South. This bloc must oppose without reservation and compromise of any kind the USA- and EU-led puppeteering of the WTO rules of agriculture to help their food-seed corporations.
The reaction in the corporatised media has been typical, with headlines like ‘Bleak outlook for WTO deal as rifts widen over food subsidies’. Reuters has reported that there are “deep divisions with only one day left to the end of talks” but that “India gains supporters for its stance on food subsidies” and also that “a Bali deal could benefit world economy by as much as $1 trillion”. We have no idea where these absurd numbers have appeared from concerning the alleged ‘benefits’ of the WTO, but foreign and Indian media have also reported the spiky warnings from the Trade Representative of the United States of America, Michael Froman.
He is reported to have said: “Let us not sugar-coat reality: leaving Bali this week without an agreement would deal a debilitating blow to the WTO as a forum for multilateral negotiations.” Froman and his government don’t (or won’t) understand that such an outcome is exactly what we want – no more WTO, for good and forever. He is also reported to have that if the WTO is finished “the unfortunate truth is that the loss will be felt most heavily by those members who can least afford it”. Froman is lying, for it is with WTO that farmers and cultivators in their millions have suffered grievously for a generation.
The Hindu reported that developing nations including India want a ‘peace clause’ (see a few paragraphs below for why we should have no such ‘peace clause’) “till a permanent solution is found on the matter for smooth implementation of the food security programme”. The Hindu report has quoted Sharma as having said that India was not isolated on the food security matter in WTO and majority of countries where over 75% people live are supporting New Delhi’s stand. “I would like to make this absolutely clear that we have not come here as petitioners to beg for a peace clause,” he was quoted as having said.
The section of foreign media that has long spoken for the USA-EU axis of agreement on WTO and its perverse agriculture rules has complained about what it calls India’s opposition. One such newspaper is the Wall Street Journal, which has reported that India “is angry over WTO rules that don’t allow it to move ahead with a massive food subsidy programme”, that negotiators have been trying to win over India by “allowing it to break those rules for four years before reducing the scope of its subsidies”. It needs to be said here (see more below) that an outside agency’s ‘rules’ are immaterial to what Bharat’s people need, and that there is no question of any agency, country, group of countries or foreign entity of any sort ‘allowing’ India to decide the manner of its service to its people.
 Earlier: Our kisans and our farmers have no use for a WTO ‘peace clause’. Our households and families that squeeze their weekly budgets to buy their food staples have no place in their lives for definitions of ‘market distorting subsidies’. Our retailers and wholesalers and fair price shops which supply these households and pay our kisans for the food they grow are much too busy to bother with what ‘amber box’ and ‘green box’ mean, or with the Ninth Ministerial Conference of the WTO.
The question is one not of food sovereignty or the right to food alone, it is also one of our country’s sovereignty and of democratic principles to be respected. For the so-called ‘developed’ countries who are also WTO members, the government of India paying farmers a minimum support price to buy crops that can be stocked (as needed) or released into the Public Distribution System is a ‘market distortion’ and they have invoked all sorts of WTO regulations to show why it is. This is dangerous and must be firmly and finally treated as a threat to the integrity of the Republic of India and its citizens. Whether those who have been sent to the WTO Ministerial Conference (in Indonesia, 2013 December 03-06) to argue India’s case will do so in a manner that protects our kisans and our households is yet to be seen.
Food security, prices that balance the income of farmers and the needs of food-purchasing households, and the quantities involved are matters that lie between the people of Bharat and the government (central and state) that exists to serve us. It is not the business in any way, in any year and under any pretext, of any of the other 192 member countries of the United Nations or of any grouping from amongst them. It is not the business of any UN agency nor any multilateral and/or inter-governmental body or agency regardless of whether India is a member or signatory to any such group or entity. That is the meaning of the sovereignty that exists as the contract between citizens and the state, and that means between us and the government of the Republic of India.
What business does the WTO imagine it has in this matter? Consider its chief operating statement: “The World Trade Organization deals with the global rules of trade between nations. Its main function is to ensure that trade flows as smoothly, predictably and freely as possible.” Arrogant and entirely mercantile, the WTO is incompetent in the matter just described – food security in Bharat. Via Campesina, the worldwide small farmers’ and peasants’ movement, has said: “”After several collapses and stalemates in the negotiations, the WTO has found a way to revive not only itself but also to deepen the free trade liberalisation agenda and expand into areas not previously covered by trade.”
An agricultural road ahead minus a WTO is what India must strive for now.
Are India’s named representatives at the Ninth Ministerial of the WTO saying so clearly and loudly so that the entire UN system and the WTO can hear? Here is an extract from the statement made by the Union Minister of Commerce and Industry, Anand Sharma, on 2013 December 02: “We cannot continue to have rhetoric of development agenda without even a reasonable attempt to address the issues which are of primary concern to developing economies. For decades, handful of farm lobbies of some countries have shaped the discourse and determined the destiny of millions of subsistence farmers of the developing countries. The massive subsidisation of the farm sector in the developed countries is not even a subject matter of discussion, leave aside serious negotiations.” This position may be useful, but we have to wait and see how it is developed between now and the end of this Ninth Ministerial.
That it may not be developed is already hinted at, for the same minister has also said: “It is therefore difficult for us to accept an interim solution as it has been currently designed. As a responsible nation, we are committed to a constructive engagement for finding a lasting solution. But till such time that we reach there, an interim solution which protects us from all forms of challenge must remain intact.” The ‘interim solution’ is what has popularly been called a ‘peace clause’, by which is mean that the use of measures to procure foodgrains by developing countries to promote food security would continue to be deemed illegal but WTO members would not go into the process of dispute settlement for a certain period.
Moreover, this ‘interim solution’ will be effective for only four years (that is, less than a single of our Plan periods) and Sharma’s saying that “we are committed to a constructive engagement for finding a lasting solution” is no indicator that our representatives to the WTO will tell the WTO that our farmers, our crops and food and our prices is none of its business. As the Institute for Agriculture and Trade Policy has mentioned, a country might seek to use both purchases and sales of stocks to support a level of equilibrium in market prices that supports long-term development objectives.
The bloc of so-called ‘developed’ countries – the USA and some of its habitual crony countries, and the European Union, all of them having subsidised their agriculture heavily and steadily for 50 years – are holding up WTO ‘rules’ to say that if the price paid by our government is higher than the ‘external reference price’, the difference is considered a ‘trade-distorting subsidy’. And what is this reference price? The average international price of 1986-88! As anyone who has even a passing interest in food knows, true food inflation (which households experience) in most of the world has for the last six years been 10% and above. Fuel price inflation has been as much if not more. Fertiliser price inflation: ditto. It is the USA and (some) countries of the EU that have annually supported the cost of cultivation and held retail food prices low to the extent of half their agricultural GDP – which they today say is permitted under WTO rules, but that India’s crop procurement prices is a ‘market distorting subsidy’ that gets in the way of a ‘free market price’!
The concept of a ‘free market price’ is a mythical entity, Prabhat Patnaik has pointed out. “There are so many things that go into the price formation of any commodity, that to single out only a few of them as constituting ‘distortions’ and the rest as ‘non-distorting’ is totally arbitrary,” he has said. “This distinction which has been foisted upon the WTO by the advanced capitalist countries to serve their own interests, and imposed through it upon the entire world, is invidious for several reasons.”
 But the WTO Director-General, Roberto Azevêdo, is considered to have as his priority the success of this Ninth Ministerial Conference in Indonesia (he warned WTO members in his inaugural speech this year that the “world will not wait for the WTO indefinitely” – what he thinks such a waiting world is was not clear, but our kisans want no WTO in their lives). [The International Centre for Trade and Sustainable Development has more.]
Several farmers’ organisations, trade unions and peoples’ campaigns in India have resolved to support the Indian government’s position to not trade away national food security. The group welcomed the decision of the Indian Cabinet on 2013 November 28 November to reject any “peace clause” that does not guarantee a permanent solution. The peace clause has been widely opposed by the Chairs of the Parliamentary Standing Committee on Commerce and Agriculture, the Left parties, and mass organisations, which include Bhartiya Kisan Union, Bharatiya Krishak Samaj, Bharatiya Majdoor Sangh, Focus on the Global South India, Right to Food Campaign, Shram Seva Nyas, South Indian Coordination Committee of Farmers’ Movements, Swadeshi Jagran Manch and Third World Network India.
Nonetheless, the danger we in Bharat have to guard against is both outside and inside. This year, India is an active and vocal member of the group of 33 countries (G-33) whose position is that the present WTO rules which constrain the ability of developing countries’ governments to purchase food from small farmers and stock them must be clarified or changed. But India is also a BRIC country whose ministers are doing all they can to allow foreign ownership of everything from banking to airports to defence to food. Hence this stance is hypocritical (as is India’s stance at the useless and totally compromised climate change COP meetings). Thus, the danger outside is how the USA (plus crony countries) and the EU employ Indian ministers to push through the WTO rules. The danger inside is that Parliament and state legislatures – which technically represent directly affected parties – are being by-passed while the interests of the corporate-financial elite (global, regional, national) are being protected.
It is this danger that has been referenced in the representation by 15 of the major farmer unions of India, including the Bhartiya Kisan Union (BKU) and the Karnataka Rajya Ryota Sangha (KRRS). The representation to Indian Prime Minister Manmohan Singh said: “Forth-seven years after the green revolution was launched, India is being directed at the World Trade Organisation (WTO) to dismantle its food procurement system built so assiduously over the past four decades. This ill-advised move is aimed not only at destroying the country’s hard-earned food security but also the livelihood security of over 600 million farmers, 80% of them being small and marginal.”
And that is why it is time for us to give our government the ultimatum – the world is not about trade but about people and the planet. Ours is not an agriculture in the service of the WTO’s murderous rules and our kisans will not abide being beggared. The crops grown to feed our households rural and urban and the prices set in the mandis and found in the kirana shops are a matter for Bharat. That is why it is time for us to face down the sly brokers in the WTO – and their masters – once and for all.
Tiffin: dry regions, China’s guidelines, permaculture, GM crops, valuing drylands, FAO saves money
(1) The International Instititute for Environment and Development (IIED) says that current policy narratives limit climate resilience in world’s dry regions: “Partial narratives that underpin policymaking prevent people in arid regions from fulfilling their potential to provide food and sustain resilient livelihoods in a changing climate.” IIED has country-specific papers on the following topics: rainfed agriculture for an inclusive, sustainable and food secure India; pastoralism as the custodian of China’s grasslands; moving beyond the rhetoric and the challenge of reform in Kenya’s drylands. (Thanks to the Agricultural Biodiversity Weblog for this.)
(2) International Rivers says that on 28 February 2013 the Chinese government released its ‘Guidelines for Environmental Protection in Foreign Investment and Cooperation’ which was based on recommendations by the Chinese NGO Global Environmental Institute. These Guidelines provide civil society groups with a new source of leverage when it comes to holding Chinese companies responsible for their environmental and social impacts overseas. These (non-binding) guidelines cover key issues, including legal compliance, environmental policies, environmental management plans, mitigation measures, disaster management plans, community relations, waste management, and international standards.
(3) Permaculture programmes are more multifunctional than typical agricultural development programmes, according to this comment in the Guardian, which is important given the growing call for ‘triple-win solutions’ (more management gobbledygook) for agriculture, health, and environmental sustainability. Some examples are given. Partners in Health ran a model permaculture farmer programme in Malawi which helped HIV/Aids patients get the additional caloric and micronutrient intake that they need. In Malawi and South Africa, permaculture is used “as a sustainable, non-donor dependent tool for improving the health, food and nutrition security, and livelihoods,” of orphans and vulnerable children, according to a recent USAid report. In Indonesia, Oxfam funded a permaculture school that taught ex-combatants and tsunami survivors how to improve their food security and livelihoods, while protecting the environment.
(4) A review article in the Agronomy for Sustainable Development journal concludes that GM crops will not only not feed the world, they are hampering efforts to sustainably feed the world by jeopardising existing biological and genetic diversity. The authors argue that agrobiodiversity should be a central element in sustainable agriculture development, and increased access to genetic resources is necessary to increase food production for an expanding world population under the threat of climate change. GM crops on the other hand concentrate ownership of agricultural resources in the hands of corporate interests in developed countries through intellectual property rights instruments. (Thanks to Third World Network for this.)
(5) Drylands in European and North American countries on average generate US$4,290 and US$277 per hectare respectively every year, but this figure jumps to US$6,462 in Asia, US$9,184 in Africa and US$9,764 in Latin America. Around 40 per cent of the world’s total land area consists of dryland ecosystems, the majority of which are in developing nations. The economic value of dryland ecosystems — determined by factors including food and raw material production, ecosystem services and tourism — is far greater in (what are still commonly called) ‘developing countries’, according to a study. This value in Africa and Latin America is more than double that in Europe and more than 30 times that in North America, which should influence how policymakers prioritise dryland conservation, according to the study that was presented at the United Nations Convention to Combat Desertification’s (UNCCD) 2nd Scientific Conference this month.
(6) During the FAO Council’s Hundred and Forty-sixth Session (in Rome, 22-26 April 2013) delegates learned that in addition to the US$6.5 million in savings that member countries mandated FAO to identify, the Organization was able to cut costs by an additional $19.3 million. The total savings of $25.8 million, nearly four times what was required, consisted mostly of savings in administrative areas especially at FAO headquarters. Director-General Graziano da Silva said that this process made it possible to advance with the Organization’s decentralisation, which includes the creation of 55 professional posts worldwide while maintaining technical capacity at Headquarters. “As I have argued before, I believe that a strong presence in the field is the way to truly make FAO a knowledge organization with its feet on the ground,” Graziano da Silva said.
Global trends to 2030 and the confusion of alternative worlds
 The National Intelligence Council of the USA, earlier in 2012 December, released the latest Global Trends report, which is titled ‘Global Trends 2030: Alternative Worlds’. The Global Trends project is described as bringing expertise from outside (the American) government on factors of such as globalisation, demography and the environment. In the USA, the Director of National Intelligence serves as the head of what in America is called the ‘intelligence community’, overseeing and directing the implementation of the American National Intelligence Program and acting as the principal adviser to the President, the National Security Council, and the Homeland Security Council for intelligence matters related to national security. Specifically, the goal of the Director of National Intelligence is described as “to effectively integrate foreign, military and domestic intelligence in defense of the homeland and of United States interests abroad”.
 With that background, ‘Global Trends 2030: Alternative Worlds’ is the fifth installment in the National Intelligence Council’s series aimed at providing to the ruling regime of the USA “a framework for thinking about the future” by “identifying critical trends and potential discontinuities”. This 2012 report distinguishes between ‘megatrends’ (factors that will likely occur under any scenario) and ‘game-changers’ (critical variables whose trajectories are far less certain). Finally, to better explain the diversity and complexity of various factors, the 2012 report sketches out scenarios or alternative worlds.
 From our Asian point of view, ‘Global Trends 2030: Alternative Worlds’ has a most interesting section describing the middle classes, which the report says almost everywhere in the developing world are poised to expand substantially in terms of both absolute numbers and the percentage of the population that can claim middle-class status during the next 15-20 years. “Even the more conservative models see a rise in the global total of those living in the middle class from the current 1 billion or so to over 2 billion people,” said the report.
All the analyses reviewed by the authors of the ‘Global Trends 2030: Alternative Worlds’ suggest that the most rapid growth of the middle class will occur in Asia, with India somewhat ahead of China over the long term. According to the Asian Development Bank, if China “achieves the new plan target of increasing household expenditures at least as rapidly as GDP, the size of its middle class will explode” with “75 percent of China’s population enjoying middle-class standards and $2/day poverty will be substantially wiped out”.
The report does not make an attempt to link the impact of the rise of this middle-class with either one of the ‘mega trends’ described or two of the ‘game-changers’ described, which speak in a halting manner about the effects of over-consumption and galloping resource grabbing.
 ‘Global Trends 2030: Alternative Worlds’ has conceded that “establishing the threshold for determining when someone is middle class versus climbing out of poverty is difficult, particularly because the calculations rely on the use of purchasing power parity”. In India the debate about who is poor is 40 years old and remains intractable – thanks mostly to the intransigence of central planners who still refuse to link the current cost of basics with current low levels of real income.
Instead, ‘Global Trends 2030: Alternative Worlds’ has forecast that most new members of the middle class in 2030 will be at the lower end of the spectrum. “Their per capita incomes will be still rated as ‘poor’ by Western standards even though they will have begun to acquire the trappings of middle-class status. Growth in the number of those living in the top half of the range of this new middle class — which is likely to be more in line with Western middle-class standards — will be substantial, rising from 330 million in 2010 to 679 million in 2030.
 Much of the future global leadership is likely to come from this segment,” said the report, raising a number of worries. Firstly, I would be loath to see any kind of leadership – political, economic or social – come from this segment as such leadership will strengthen, not diminish, the consumption patterns destroying our environment. Second, it is less the chasing of ‘Western’ per capita incomes we need and more the re-education of the middle-class to emphasise the virtues of ‘less’ and ‘small’ that is urgently needed.
More to the point, ‘Global Trends 2030: Alternative Worlds’ has forecast that with the expansion of the middle class, income inequalities — and the report says these “have been a striking characteristic of the rising developing states” — may begin to lessen in the developing world. This is astonishingly misread. Approximately a generation of economic liberalisation (which has gone under various names in different large countries) in India, China, Russia, South Africa, Brazil and Indonesia have proven the opposite.
 The report goes on in this befuddled vein: “Even if the Gini coefficients, which are used to measure inequalities, decline in many developing countries, they are still unlikely to approach the level of many current European countries like Germany and Finland where inequality is relatively low”. Again, a decade of ‘austerity’ under various guises (longer in Britain in fact, under Thatcherism) in Europe has created inequalities approaching the true levels seen in the BRICS and similar countries, and these have been camouflaged by welfare measures that are fast-disappearing and by community action. So this ‘Global Trends 2030: Alternative Worlds’ is flat wrong on these matters.
However, the report has made an attempt to infuse some social science into what is otherwise good news for the global consumer goods multinationals (and of course for the fossil fuel barons). “That said, a perception of great inequality will remain, particularly between urban- and rural-dwellers, motivating a growing number of rural-dwellers to migrate to the cities to seek economic opportunities. Their chances of becoming richer will be substantially greater in cities, but the increasing migration to urban areas will mean at least an initial expansion in the slums and the specter of poverty,” said the ‘Global Trends 2030: Alternative Worlds’ report. More interesting is the warning the report has issued, which is that if new middle-class entrants find it difficult to cling to their new status and are pulled back toward impoverishment, they will pressure governments for change. “Rising expectations that are frustrated have historically been a powerful driver of political turmoil.” Hear, hear. Remember the 99 per cent.
Black Sea questions, South Asian rice, the ethanol effect – IGC on grains in 2012 February

IGC's supply and demand graphs for; top row - total grains, wheat, maize; bottom row - rice, soyabean, and IGC freight index
The International Grains Council (IGC) has released its grains market report for February 2012. In its market commentary, which is a cogent 250-word summation of 1,840 million tons of produce and where it will go, the IGC has said:
 Grain and oilseed markets mostly strengthened in the past month, the IGC daily index (GOI) up 6% to near four-month highs. The upturn reflected concerns in early February about maize and soyabean crops in South America, as well as the impact of the recent severe cold spell in parts of Europe and the CIS. Moreover, after a very high rate of shipments from the Black Sea region in the first half of the season, sales activity declined, with US grain, in particular, attracting much more buying interest.
Wheat export prices in Europe climbed by some 8%, in somewhat tighter markets, with reports of logistical problems and possible future export restrictions in the Black Sea region (though denied), seen as potentially bullish. However, global supplies appear ample, with the likelihood that a portion of upcoming large South Asian wheat harvests will be offered for export. US maize (corn) values remained firm, supported by reports of crop losses in South America and active export interest for remaining old crop supplies, although forecasts of a further rise in US plantings this spring added a bearish element.
Oilseed prices rallied strongly in the past month, reflecting worries about the final outcome of soyabean crops in Argentina and Brazil, good demand for US supplies, including a new trade deal with China, and rising crude oil values. International rice market trends were more mixed, with Thai prices supported by domestic support measures but those in Vietnam, especially broken grades, easing to compete with South Asian offers.
[The IGC 2012 February grains market report is here. The data files as excel spreadsheets are available in this zip archive.]
The IGC’s sectoral advice is:
Grains: The world production estimate is lifted by 11m. tons, to 1,841m., largely because of upward revisions in Australia, Kazakhstan, Ukraine, India and Brazil, the latter because losses of its main maize crop will likely be more than compensated by a larger second crop. These upward revisions outweigh a reduced maize figure for Argentina. To an extent, the forecast of world consumption is adjusted higher to reflect the bigger crop estimates, with total use of grains placed 5m. tons above the January forecast, at 1,836m. The change is mainly for feed use, now put at 775m. tons, 4m. more than before and 4% higher than in 2010-11.
Of particular interest is the marked slowdown in the annual increase in industrial use, expected to rise by only 2% this year, with ethanol use of maize in the US set to recede slightly from its peak in 2011. While the latest statistical forecasts of supply and demand suggest that, nominally, global carryover stocks will rise slightly in 2011-12 from last year’s low figure, to 378m. tons (373m.), the total carryover in the eight major grain* exporters is still expected to dip by 6m. tons, to 131m., the smallest figure since 2007-08.

As this pair of charts shows, the Baltic Dry Freight Index has dropped not only to a one-year low, but is at a three-year low. Charts: Bloomberg
Wheat: A further increase in the global wheat production estimate for 2011-12, to 695m. tons (653m.), boosts total availabilities to 892m., their highest ever. Projected food and industrial consumption are both revised lower this month, but attractive prices, particularly compared with maize, lift the forecast of feed use by 2m. tons, to 131m. (115m.), the most since the early 1990s. Strong feed wheat demand is reflected in the global trade figure, helping to lift total wheat trade to match the 2008-09 peak, at 136.8m. tons (125.7m.). Even though total consumption is growing at a faster than average pace, world stocks are projected to rise to 211m. tons (196m.), eclipsing the previous record in 1999-00.
Maize (Corn): Maize production in 2011-12 is expected to increase by 4%, to a record 864m. tons. The US crop, while disappointing, was slightly above average, and bumper harvests were collected in China, Ukraine and the EU. A severe drought has reduced yield prospects in South America, especially in Argentina, but Brazil remains on track to produce a record crop. Improved supplies in some countries are boosting consumption, with overall use forecast at a record high. Feed use of maize is expected to increase at a faster than average pace but, with US ethanol production likely to decline slightly, the rise in industrial demand will be below trend. With demand outpacing the increase in supplies, ending stocks are forecast to tighten further, including in the US. Amid solid buying by a number of importers, world trade is forecast to rise to a four-year high.
Barley: Better than expected 2011-12 harvest results, including in Argentina and Australia, lift the estimate of world barley production by 1.1m. tons compared with last month, to 134.7m. World consumption is expected to remain steady, contained by uncompetitive prices in the feed sector, especially in the EU, and by sluggish growth in brewing demand. While higher than previously forecast, carryover stocks are set to remain tight, particularly in the EU and North America. The projection of world trade is raised by 1.2m. tons, to a three-year high of 17.8m., with a steep upturn in buying by Saudi Arabia.
Rice: Due to increases in Asia’s biggest producers, China and India, global rice output is projected to rise by 3% in 2011-12, to 463m. tons. The record outturn will be accompanied by a further expansion in demand, to 460m. tons (449m.), but the 2011-12 carryover is still expected to increase by 4%, to 99m. Much of the forecast rise in global stocks will be due to increases in the major exporters, notably in India and Thailand, seen 14% higher, at a record 32.7m. tons. World trade in 2012 is forecast to contract by 7%, to 32.2m. tons, owing to significantly reduced purchases by key Asian buyers, including Bangladesh and Indonesia.

Ocean freight rates between major export-import regions.
Asia takes the research and development lead
 Ten Asian countries, including some developing countries in South-East Asia, have, as a bloc, caught up with the global leader in research and development (R&D) investment, the United States, a report by Scidev.net has said.
The report quoted is the National Science Board’s ‘Science and Engineering Indicators 2012’ which is a broad base of quantitative information on the U.S. and International science and engineering enterprise. The National Science Board (NSB) is the policymaking body for the USA’s National Science Foundation (NSF).
The NSB report has said that total science spend of China, India, Indonesia, Japan, Malaysia, Singapore, South Korea, Taiwan, Thailand, and Vietnam rose steadily between 1999 and 2009 to reach 32 per cent of the global share of spending on science, compared with 31 per cent in the US.
 “This information clearly shows we must re-examine long-held assumptions about the global dominance of the American science and technology enterprise,” said NSF Director Subra Suresh of the findings in the ‘Science and Engineering Indicators 2012’. “And we must take seriously new strategies for education, workforce development and innovation in order for the United States to retain its international leadership position,” he said.
Well over a year ago (2010 November), the UNESCO Science Report 2010 had as its primary message stated that Europe, Japan and the USA (the Triad) may still dominate research and development (R&D) but they are increasingly being challenged by the emerging economies and above all by China.
The report depicted an increasingly competitive environment, one in which the flow of information, knowledge, personnel and investment has become a two-way traffic. Both China and India, for instance, are using their newfound economic might to invest in high-tech companies in Europe and elsewhere to acquire technological expertise overnight.

The USA's National Science Foundation (NSF) launched a number of new initiatives designed to better position the United States in global Science and engineering. Photo: National Science Board / Richard Lerner
Other large emerging economies are also spending more on research and development than before, among them Brazil, Mexico, South Africa and Turkey. If more countries are participating in science, the UNESCO Science Report 2010 saw a shift in global influence, with China a hair’s breadth away from counting more researchers than either the USA or the European Union, for instance, and now publishes more scientific articles than Japan.
 A “major trend has been the rapid expansion of R&D performance in the regions of East/Southeast Asia and South Asia,” according to the biennial report ‘Science and Engineering Indicators 2012’ produced by the National Science Board, the policy-making body of the US National Science Foundation, which drew upon a variety of national and international statistics. The report also mentions that the share of R&D expenditure spent by US multinationals in Asia-Pacific has increased.
According to the new Indicators 2012, the largest global S&T gains occurred in the so-called ‘Asia-10’ – China, India, Indonesia, Japan, Malaysia, Philippines, Singapore, South Korea, Taiwan and Thailand – as those countries integrate S&T into economic growth. Between 1999 and 2009, for example, the U.S. share of global research and development (R&D) dropped from 38 percent to 31 percent, whereas it grew from 24 percent to 35 percent in the Asia region during the same time. In China alone, R&D growth increased a stunning 28 percent in a single year (2008-2009), propelling it past Japan and into second place behind the United States.
 “Asia’s rapid ascent as a major world science and technology (S&T) centre is chiefly driven by developments in China,” says the report. “But several other Asian economies (the Asia-8 [India, Indonesia, Malaysia, the Philippines, Singapore, South Korea, Taiwan and Thailand]) have also played a role. All are intent on boosting quality of, and access to, higher education and developing world-class research and S&T infrastructures. The Asia-8 functions like a loosely structured supplier zone for China’s high-technology manufacturing export industries. This supplier zone increasingly appears to include Japan. Japan, a preeminent S&T nation, is continuing to lose ground relative to China and the Asia-8 in high-technology manufacturing and trade,” the report says.
 International R&D highlights
(1) The top three R&D-performing countries: United States, China – now the second largest R&D performer – and Japan represented just over half of the estimated $1.28 trillion in global R&D in 2009. The United States, the largest single R&D-performing country, accounted for about 31% of the 2009 global total, down from 38% in 1999.
(2) Asian countries – including China, India, Japan, Malaysia, Singapore, South Korea, Taiwan, and Thailand – represented 24% of the global R&D total in 1999 but accounted for 32% in 2009, including China (12%) and Japan (11%). The pace of real growth over the past 10 years in China’s overall R&D remains exceptionally high at about 20% annually.
(3) The European Union accounted for 23% total global R&D in 2009, down from 27% in 1999. Wealthy economies generally devote larger shares of their GDP to R&D than do less developed economies. The U.S. R&D/GDP ratio (or R&D intensity) was about 2.9% in 2009 and has fluctuated between 2.6% and 2.8% during the past 10 years, largely reflecting changes in business R&D spending. In 2009, the United States ranked eighth in R&D intensity – surpassed by Israel, Sweden, Finland, Japan, South Korea, Switzerland, and Taiwan – all of which perform far less R&D annually than the United States.
 (4) Among the top European R&D-performing countries, Germany reported a 2.8% R&D/GDP ratio in 2008; France, 2.2%; and the United Kingdom, 1.9%. The Japanese and South Korean R&D/GDP ratios were among the highest in the world in 2008, each at about 3.3%. China’s ratio remains relatively low, at 1.7%, but has more than doubled from 0.8% in 1999.
“India’s high gross domestic product (GDP) growth continues to contrast with a fledgling overall S&T performance.” The figures show that China, while still a long way behind the United States, is now the second largest R&D performer globally, contributing 12 per cent of the global research spend. It has overtaken Japan, which contributed 11 per cent in 2009. The proportion of GDP that China devotes to science funding has doubled since 1999 to 1.7 per cent and China’s pace of real growth in R&D expenditure “remains exceptionally high at about 20 per cent annually,” the report says. Overall, world expenditures on R&D are estimated to have exceeded US$1.25 trillion in 2009, up from US$641 billion a decade earlier.
 “Governments in many parts of the developing world, viewing science and technology as integral to economic growth and development, have set out to build more knowledge-intensive economies,” it says. “They have taken steps to open their markets to trade and foreign investment, develop their S&T infrastructures, stimulate industrial R&D, expand their higher education systems, and build indigenous R&D capabilities. Over time, global S&T capabilities have grown, nowhere more so than in Asia.”
The scientific landscape is not conveniently demarcated by blocs, whether formed by states or by private sector interests. As UNESCO has said, even countries with a lesser scientific capacity are finding that they can acquire, adopt and sometimes even transform existing technology and thereby leapfrog over certain costly investments, such as infrastructure like land lines for telephones. Technological progress is allowing these countries to produce more knowledge and participate more actively than before in international networks and research partnerships with countries in both North and South. This trend is fostering a democratization of science worldwide. In turn, science diplomacy is becoming a key instrument of peace-building and sustainable development in international relations.
The carefully constructed mirage of the ‘green economy’
Not a week goes by nowadays without one high-profile institution or high-powered interest group directing us all to be part of the ‘new, green economy’. That’s where the next jobs are, where innovation is, where the next wave of financing is headed, where the best social entrepreneurship lies. There are the big inter-governmental organisations telling us this: United Nations Environment Program, UNCTAD, OECD, International Energy Agency, the big international lending agencies like the World Bank and Asian Development Bank. There are big think-tanks telling us the same thing – backed up by hefty new reports that are boring to read but whose plethora of whiz-bang charts are colourful. There are big companies, multinationals and those amongst the Fortune 500, also evangelising the new green economy and patting themselves on the back for being clean and green and so very responsible.

Artisanal blacksmith and his family, Maharashtra, India
What on earth are they all talking about? Does it have to do with us average, salaried, harassed, commuting, tax-paying types who are struggling with food inflation and fuel cost hikes and mortgages and loans that break our backs? Are they talking to our governments and our municipalities, who are worried about their budgets and their projects and their jobs too?
Here are a few answers from working class Asia. Let’s start with restating a couple of trendlines. One, the era of growth in the West is over. Growth is Asia is what is keeping the MNCs and their investors and bankers and consultants interested, and this means China and India (also Brazil, Russia, South Africa, Indonesia). Two, the environmental consciousness which began in the 1970s to spread quickly in the West led to many good laws being framed and passed. These were responses to the industrial and services growth in the Western economies. As globalisation took hold, people in less industrialised countries – ordinary citizens – saw what had happened in the West and learnt from their experiences with industrialisation. Green movements took root all over Asia and South America, protests were common, confrontations just as much, and global capital found itself being questioned again, even more fiercely.
These are the two major trends. The forces of production want to move much further into what used to be the ‘developing’ world, but want to meet much less resistance. That’s why they appeal to the consumer minds of China, India and the other target countries – you need jobs, homes, nice cars, big TVs, cool vacations, credit, aspirations, and lifestyle is what the messages say, whether they’re from telecom companies or condominium salesmen. But it’s hard to market all this stuff – real stuff, virtual stuff – to people who are still struggling to make ends meet.

This was after all the old 'green economy'. A late 19th century painting in a maritime museum near Mumbai, India
That’s where the ‘new, green economy’ tagline and its earnest-sounding philosophy comes in. “The main challenges to jump-starting the shift to a green economy lie in how to further improve these techniques, adapt them to specific local and sectoral needs, scale up the applications so as to bring down significantly their costs, and provide incentives and mechanisms that will facilitate their diffusion and knowledge-sharing,” said one of these recent reports. Look at the text which contains all the right buzzwords – ‘scale up’, ‘jump-start’, ‘applications’ (that’s a favourite), ‘knowledge-sharing’, ‘local’.
This makes the ‘old economy’ sound good but changes nothing substantial on the ground, or on the factory shopfloor or for the tens of thousands of little manufacturing units that do small piecework jobs for the bigger corporations up the chain. The world’s business philosophy has changed drastically even without the impact of environment and energy. To drive home this point, it has been a long time since we heard anything like ‘industrial relations’, and that alone should tell us how far the dominance of capital has reached, when labour, whose organisation gave the West its stellar growth rates in the 1960s and 1970s, has now become all but ignored. This is because the dominant interests associated with capital have insisted, successfully for investors and for pliant governments, that the manufacturing firms break loose from the industrial relations moorings they had established. The restructuring of firms to emphasise leaner and meaner forms of competition – as the ruthless management gurus and greedy consulting agencies instructed – was in line with market pressures that are viewed by the powers-that-be as crucial to the revitalisation of the economy.
 Read their greenwash carefully and the control levers are revealed. “Further innovation and scaling up are also needed to drive down unit costs. Technologies will need to be ‘transferred’ and made accessible, since most innovation takes place in the developed countries and private corporations in those countries are the main owners of the intellectual property rights covering most green technologies.” So says ‘World Economic and Social Survey 2011: The Great Green Technological Transformation’ (UNESCO, Department of Economic and Social Affairs). Rights and access are built in from the start, as you can see.
And yet it is this very system of production, of the arrangement of capital and of the effort to weaken working regulations that is now talking about the ‘green economy’. Why do they even imagine we should believe them? They are the ones who have remained locked into the fossil fuel economy and who have partnered the enormous influence of the finance markets, who have followed every micro-second of the way the dictates of capital flows and what the market investors want in their endless quest for greater profits in ever-shorter cycles of production. For the major business of the world, ‘green economy’ is yet another route to super-profits and the consolidation of both forces of production and masses of consumers. The difference between now and the 1970s is that today they are able to successfully enlist the apparently authoritative inter-governmental organisations with their armies of economists and social scientists and engineers, to support this new profiteering. Only now, the cost is planetary.
FAO March bulletin, Crop Prospects and Food Situation for 2011
The FAO has released its Crop Prospects and Food Situation, the first for 2011, in March. The overview is:
-

Wheat production: leading producers, (million tonnes)
FAO’s first forecast for world wheat production in 2011 stands at 676 million tonnes, 3.4% up from 2010. This level of production would still be below the bumper harvests of 2008 and 2009.
- International grain prices remained volatile in the first three weeks of March.
- The cereal import volume in low-income food deficit countries (LIFDCs) as a group is anticipated to decline in 2010-11 due to increased production. However, their import bill is forecast to rise by 20% following higher international prices.
- In Asia, prospects for the 2011 wheat crop are mostly favourable. In China, the outlook remains uncertain but the easing of the drought situation in the North China Plain is a positive development. In Japan, a powerful earthquake and subsequent tsunami have caused devastation with a potentially significant impact on agriculture and food trade.
- In North Africa, the current situation in Libyan Arab Jamahiriya has resulted in the displacement of large numbers of people and disruption to the flow of goods and services in this heavily cereal import dependent region. WFP has initiated a regional emergency operation to provide food assistance to the affected people.
- In Southern Africa, prospects for the main 2011 maize crop are generally favourable and relatively low prices have helped stabilize food security.
- In Eastern Africa, food insecurity has increased in drought-affected pastoral areas of Somalia, Kenya and Ethiopia despite bumper harvests in 2010 and generally low and stable food prices.
- In Western Africa, post-election violence continues to cause a large population disruption and disturb trade and livelihoods in Côte d’Ivoire and the neighbouring countries.


Countries requiring external assistance for food, 29 of which 21 in Africa
Overall favourable outlook for global 2011 wheat production: At this stage of the season, with the bulk of the coarse grains and paddy crops yet to be planted in the coming months, it is still too early for even a preliminary forecast of global cereal output in 2011. For wheat, however, in the northern hemisphere, which accounts for the bulk of the global production, winter crops are already developing or soon to come out of dormancy, while spring planting is underway in some countries and a preliminary picture of global prospects is already available.
FAO’s first forecast for world wheat production in 2011 stands at 676 million tonnes, representing a growth of 3.4% from 2010. Plantings have increased, or are expected to increase, in many countries in response to strong prices, and yield recoveries are expected in areas that were affected by drought in 2010, the Russian Federation in particular. The global output forecast for 2011 would be still below the bumper harvests in 2008 and 2009.
In Asia, prospects for the 2011 wheat crop, to be harvested from April, are mostly favourable in India and Pakistan, where good harvests are forecast. However, the outlook in China is uncertain because of winter drought in the North China Plain despite recent beneficial precipitation.

Cereal export prices
In the Asia CIS subregion, Kazakhstan is the major producer and the bulk of the crop is yet to be sown this spring. Weather permitting, farmers are expected to maintain the relatively high planting level of the past two years, especially in view of strong prices. Assuming also a recovery in yields after last year’s drought-reduced level, a significant increase in production could be achieved. In North Africa, early prospects for the 2011 wheat crops are generally favourable, except in Tunisia where dry conditions point to a repeat of last year’s drought-reduced crop.
In the southern hemisphere, where the major wheat crops are still to be sown, producers are also expected to increase plantings in response to this year’s favourable price prospects. However, this may not translate to larger crops in Australia or Argentina, where yields are assumed to return to average after bumper levels in 2010.

World cereal production and utilisation
Estimate of world cereal production in 2010 slightly up on December forecast: The estimate for world cereal production in 2010 has been revised upward slightly since previously reported (Crop Prospects and Food Situation, December 2010) to 2,237 million tonnes (including rice in milled terms), just 1.1% below the bumper output in 2009. The decline in cereal production in 2010 was entirely due to lower output in developed countries while in developing countries production rose significantly by almost 5%. The estimate for world wheat production in 2010 now stands at almost 654 million tonnes, 1 million tonnes above FAO’s December forecast but still some 4% less than in 2009.
The latest revision mostly reflects a better than expected outcome of the harvest in Argentina, which more than offset some downward adjustments to estimates in Asia (most notably Kazakhstan) and Europe (mostly the Russian Federation). For coarse grains, the estimate of output in 2010 is now put at 1 117 million tonnes, 7 million tonnes up from the previous forecast and just marginally less than the 2009 level. The upward revision was largely driven by increased estimates for China, India, Ethiopia and Sudan.
The estimate for global rice production in 2010 remains unchanged since December at 466 million tonnes (in milled terms). Improved prospects for Brazil, China mainland and Thailand largely offset a sizeable downward revision for India. At this level, the aggregate output of the 2010 rice seasons, which will close when the northern hemisphere countries complete the harvest of their secondary crops by May-June, would be 2% up from 2009, mostly on account of large gains in Asia, where Bangladesh, China, India and Indonesia, the leading world producers, are all expected to tally larger crops.
