Posts Tagged ‘population’
Seeing the growers of our food and where they are
Where the food that we eat is grown, who the growers of our food are, these are the sort of questions that independent Bharat ought very early to have made central to our understanding of the growing of food crops and the uses to which harvested food crops are put. Instead, we have an administrative understanding, weighed down completely by the bits and pieces of method left by an imperial British administration – whose interests were exploitative and fully colonial.
And assisting this anachronistic administrative view of food and agriculture is a more recent ‘market’ view. This is even more distanced from the farming household and the consuming household than the colonial view was, because its engine is constructed according to the blueprints drawn by a western macro-economics which has served neither the populations of the western countries nor the post-colonial populations of former colonies. The ‘market’ view survives till today only because of the continuous creation of new consumers for food ‘products’ – which is quite different from the seasonal consumption of raw food staples provided by local cultivators.

For these and allied reasons the ability of the central government administration of Bharat – from the time of the First Five Year Plan of 1951-56 – to consider agriculture and food as something other than a ‘sector’, a contributor to gross domestic product (GDP), as an activity through which employment could be supported and poverty kept at bay, has been crippled. There is no reason for it to continue being crippled today. It has continued only because of the legions of planners, advisers, economists and econometricians, academics and researchers, bankers and financiers, and to which assembly must now be added the social entrepreneurs, fin-tech (finance technology) start-ups, and ‘innovators’ who derive dubious means and transient currency out of it.
For this reason I have in a number of articles, papers and writings such as this one sought to describe ways in which the circumstances of the food grower should be, and must be, seen – very often by using the public data and statistics freely available. Some of the indicators we need to have in the foreground – and these are very much more important than the area-produce-yield obsession of our agricultural science establishment and economics planners – are: how many rural households does it take to feed an urban household? Where are farmers, food growers and cultivators a large part of those who work? What role do the smallest urban settlements (census towns) have in the growing and consuming of food?

This is the result of a very small attempt, using Census 2011, to answer such questions.
1. There are 152 districts in which the ratio of the number of rural households to urban households is 8 and above. This means that in 152 districts, rural households outnumber urban households by a factor of at least 8. In 102 of these districts, the ratio is 10 and above, in 45 of these districts the ratio is 15 and above, and in 24 districts the ratio is at least 20.
Among districts which have a high ratio are Ramban in Jammu and Kashmir has a ratio of 24.7 to 1, Sheohar in Bihar has a ratio of 24.6 to 1, West District of Sikkim has a ratio of 23.7 to 1, Anjaw in Arunachal Pradesh has a ratio of 23.7 to 1, Bhabua in Bihar has a ratio of 23.6 to 1 and Baudh in Odisha has a ratio of 22.5 to 1. Whereas Bhabua has some 2.4 lakh rural households, West District has only about 27,000 rural households.
2. There are 174 districts in which the rural farming population, that is, the number of working adults who are engaged in cultivation of their plots or as agricultural labour, is 80% and more of the total rural working population of that district. In 90 of these districts the percentage is 85% and above, in 25 districts it is 90% and above.
Among districts which have a high percentage of cultivators and agricultural labour in their rural working population are Washim and Nandurbar in Maharashtra (90.7% and 90.5%), Dhar, Khandwa and Khargone in Madhya Pradesh (90.6%, 90.5% and 90.5%), and Jashpur and Surguja in Chhattisgarh (both 90.4%).
3. There are 211 districts in which the number of rural households is 3 lakh and above. Of these in 161 districts the number of rural households is 3.5 lakh and above, and in 129 districts the number of rural households is 4 lakh and above. From among these 129, there are 29 in Uttar Pradesh, 19 in Bihar, 15 in West Bengal, 15 in Maharashtra and 13 in Andhra Pradesh.
Among districts with large numbers of rural households are Krishna in Andhra Pradesh with about 7.53 lakh households, Mahbubnagar in Telengana with 7.43 lakh households, Ahmednagar in Maharashtra with 7.39 lakh households, Malda in West Bengal with 7.34 lakh households, Darbhanga in Bihar with 7.29 lakh households, Allahabad in Uttar Pradesh with 7.21 lakh households and Belgaum in Karnataka with 7.19 lakh households.

4. There are 202 districts in which the farming population both rural and urban, that is, the number of working adults who are engaged in cultivation of their plots or as agricultural labour, is 70% or more of the total working population of that district. In 116 of these districts the percentage is 75% and above, in 58 of these districts it is 80% and above.
Among districts with a high combined percentage of rural and urban households engaged in agriculture are Pratapgarh in Rajasthan (83.8%), Mahasamund in Chhattisgarh (83.6%), Mandla in Madhya Pradesh (83.6%), Katihar in Bihar (83%), Khunti in Jharkhand (83%), Uttar Bastar Kanker in Chhattisgarh (83%), Malkangiri in Odisha (82.9%) and Dohad in Gujarat (82.8%).
Bharat at 1.3 billion
 In July 2016, the population of Bharat will cross one billion three hundred million. In 1937, the population of what was then British India was 300 million. Seventy-nine years later, there are a billion more.
This numerical landmark is based on the 2011 Census of India total population (which was 1.21 billion) and the growth rate of the population, or what demographers refer to as the rate of natural increase.
For a country of the size of Bharat – and for that matter, even for the states with large populations – any ‘total’ or ‘final’ is no more than an estimate that is subject to variability. The population count of any administrative unit (such as a state or district) can be estimated with census data modified by health data (birth rate, death rate) and by seasonal changes (migration).
There are several extenuating reasons why this exercise needs to be done automatically at least every month by the states and the central government ministries and departments. Perhaps the 1.3 billion landmark can goad them into doing so. The carrying capacities of our river basins, the watersheds, the valleys and floodplains, the ghats both Western and Eastern, the plateaus and grasslands, the deltas and the hill tracts cannot be ignored.
 Equations that govern these are simpler than they are typically made out to be by science. There is only so much water, land, forest, and vegetation (or biomass) available to support us. The 2001 Census found that the population of Bharat had crossed a thousand million. At that point at least the consequences of a steadily growing population (182 million had been added since 1991, and 345 million – which was the population at the time of Independence – since 1981) needed to have become the subject of monthly reflection and policy.
With Bharat at 1.3 billion being barely three months away, the new state population counts (in the chart) show why such monthly reflection and policy is vital, indeed a matter of urgency. We now have ten states whose population is more than 50 million – the comparisons of the sizes of our state populations with those of various countries around the world are now well-known.
West Bengal in May 2016 has a population of 97.7 million and will cross 100 million by the same time in 2017. In May 2016 the population of Bihar is 111.4 million, Maharashtra is 120.3 million and Uttar Pradesh is 214 million. These are gigantic numbers and it is because they are gigantic that they seem to escape planning notice – but the population of these four states is very much more than the population of the European Union of 28 countries.
The table shows the current estimated population (2016 May) for the age bands (from Census 2011 and adjusted for simple growth), which helps us understand the populations of infants, children, adolescents, youth, early adults, mature adults, the middle-aged and the elderly. About 257 million are under nine years old (19%), about 271 million are between 10 and 19 years old (20%) and about 111 million (8%) are 60 years old and older.
These are aspects that require as much study, comprehension and policy measures as we demand on subjects such as governance, corruption, the price of food, the extent of our forests, the supply of water, and the adequacy of monthly incomes. At the 1.3 billion mark, Bharat’s population is starkly in the foreground.
Big cities, large appetites, fewer farmers

By March or April 2016 the populations of several of our smaller Class I cities (those whose populations are 100,000 and more) will pass certain marks. These marks mean little by themselves, but ought to be used by city administrations (municipal council and civic services departments) to judge for themselves how essentials are being provided for and used: food, water, sanitation, electricity, waste.
There are now 152 towns in the National Urban Information System, which is – if I have understood this national urban administration maze – under the Urban Infrastructure Development Scheme for Small and Medium Towns (which goes by the utterly unfriendly acronym of UIDSSMT). This is described as: “a component of JNNURM. The Mission aims to encourage reforms and fast track urban infrastructure and services delivery, community participation, accountability of ULBs/parastatal agency towards citizens.”
As you can see, the Ministry of Urban Development likes dreadful acronyms, and likes keywords such as ‘component’, ‘reform’, ‘fast track’, ‘services’, ‘infrastructure’, ‘PPP’ and anything else that sounds large, technical and expensive.
The JNNURM which got all this going in the first place (the Jawaharlal Nehru National Urban Renewal Mission) turned ten years old in December 2015. Its ideas, assumptions and performance ought to have come under careful scrutiny at least on this occasion. It didn’t because there’s so much else to be distracted by when it comes to smartening up cities and towns in India these days.
The JNNURM favoured 65 cities for what it called a “higher level of resources and management attention” and with typical confusion also said these 65 ‘mission cities’ are under the Urban Infrastructure and Governance (UIG) programme. But, as I have written about here earlier, there are many towns in India whose populations are growing quickly, because of which ‘services’, ‘infrastructure’ and more modest levels of ‘resources and management attention’ all become programmes (with complicated balance sheets, naturally).
And so we have the Smart Cities Mission and the Atal Mission for Rejuvenation and Urban Transformation (AMRUT) – I’m still working out how it fits together with everything else going on in the Ministry of Urban Development.
Here’s what the officialese says: “Smart Cities Mission is based on the idea of developing the entire urban eco-system on the principles of complete and integrated planning.” Leaving aside the question of whether non-Smart cities (and towns) are destined to remain unsmart and unacronymed, 100 cities have been selected to become smart.
Nor is that all. There is an Urban Rejuvenation Mission (which goes by the, erm, unprepossessing acronym of URM) which the ministry says it is finalising which seems to have very much to do with infrastructure development, but on a much larger canvas of 500 cities, “to be implemented over a period of 10 years from 2014-15 to 2023-24”.
Nowhere in this plethora of programmes and schemes and grand visions have I seen anything that remotely refers to foodstuffs that city populations need, every day, week, month and year.
And so to return to March or April 2016 when the populations of several of our smaller Class I cities (those whose populations are 100,000 and more) will pass certain marks. Using the 2001-2011 decadal growth rates for the urban centres, and adjusting for lower growth rates for the most recent three years (to account for factors such as fewer work opportunities in these centres, rising urban costs of survival compared with the slower increase in wages for informal work, and the benefits of the MGNREGA, here is a summary that shows the sort of change we continue to see in towns and cities.
Chhindwara and Guna in Madhya Pradesh, Nabadwip in West Bengal, Bhusawal in Maharashtra, and Modinagar and Sitapur in Uttar Pradesh will all have reached or crossed the mark of 200,000 residents. Likewise, Vadakara in Kerala, Ganganagar in Rajasthan, Haldwani in Uttarakhand, and Karur, Udhagamandalam and (all three in Tamil Nadu) will all have reached or crossed the mark of 250,000 residents. And moreover Farrukhabad-Fatehgarh in Uttar Pradesh, Satna in Madhya Pradesh, Jalna in Maharashtra and Navsari in Gujarat will all have reached or crossed the mark of 300,000 residents.
What is the impact of these increases in the populations of these cities? Using the recommended dietary allowance (prescribed by the National Institute of Nutrition) this is what the population increases mean for the provision of food essentials. Every day in 2016, Sitapur in Uttar Pradesh will need 92 tons of cereals, 8 tons of pulses and 20 tons of vegetables. Compared with the city’s needs in 2001 (when the previous census was done) Sitapur will consume 23 tons more of cereals, 2 tons more of pulses and 5 tons more of vegetables – every day.
In the same way, every day in 2016 Navsari in Gujarat will need 137 tons of cereals, 12 tons of pulses and 29 tons of vegetables. Compared with the city’s needs in 2001 Navsari will consume 31 tons more of cereals, 3 tons more of pulses and 7 tons more of vegetables – every day. Then there is Hosur in Tamil Nadu which every day in 2016 will need 115 tons of cereals, 10 tons of pulses and 25 tons of vegetables. Compared with the city’s needs in 2001 Hosur will consume 77 tons more of cereals, 7 tons more of pulses and 17 tons more of vegetables – every day.
This is an indication of the food dimension of the population change that we are seeing – of ever greater quantities of the bare essentials being needed, but fewer agriculturists and cultivators – that is, fewer farming households growing these and other food essentials in their fields – remaining to support nearby (and distant) urban populations.
These equations are simple enough to understand for the Smart city lot, the JNNURM technocrats and the engineers and financiers running the PPP treadmills. Why then hasn’t daily food budgets of our towns and cities made it to the top of the urban renewal charts of India?
Cities by numbers, a count of our cities
 The 27 cities shown on this map are no different from many others like them in India today, and the selection of these 27 is based solely on a single numerical milestone which I am fairly sure few of each city’s citizens (or administrations for that matter) will have marked.
On some day during the months since March 2011, the population of each of these 27 cities has crossed 150,000 – this is the criterion. March 2011 is the month to which the Census 2011 has fixed its population count, for the country, for a state, a district, a town.
And so these 27 cities share one criterion – which they be quite unaware of – which is that when their inhabitants were enumerated for the 2011 census, their populations were under 150,000 whereas in the four years since that mark has been crossed.
Any population mark is as arbitrary as any other. What such an exercise does help with is that the spotlight of awareness about our living spaces can once more shine on that factor which stands above all others: our numbers. It is these numbers that dictate our impacts, as individuals and as householders, on the environment and its gifts.
 That’s why it is of scant interest to us that the city of Palanpur in the district of Banas Kantha (Gujarat) would have crossed the 150,000 mark only very recently, perhaps one or two months ago, just like the city of Beed in the district of the same name (Maharashtra).
It is also of scant interest that whereas the city of Barabanki (district Barabanki in Uttar Pradesh), crossed the mark within a year after March 2011, it was in 2013 that Kaithal (district Kaithal, Haryana) crossed the same mark (as did Sasaram, in the district of Rohtas, Bihar).
On this map, some of the increments seem small – look at Damoh in Madhya Pradesh and Tiruvannamalai in Tamil Nadu. What is of interest to us the cumulative impact of these small increments over time.
When the great enumeration of 2011 fixed their populations, these 27 cities taken together were home to 3.88 million people. In 2015 September about 4.3 million people live in the same 27. The difference between the two totals – about 405,000 people – is more than the population of any two on this short list together!
This is but the briefest outline for 27 cities only. Using a conservative estimate for the annual population growth rate there are in 2015 September 238 cities (including these) whose populations are between 100,000 and 200,000 – Nabadwip in Nadia district (West Bengal), Neyveli in Cuddalore district (Tamil Nadu) and Rae Bareli (Rae Bareli district, Uttar Pradesh) have all just crossed the 200,000 population mark.
So many households, some in slums (pucca and ‘regularised’, or with blue plastic sheets for a roof and water mafias in control) and some in tenements, some owning a car and two-wheeler both and others reliant on public transport and the kindness of neighbours, very very few with electricity around the clock and every one of those that can afford it with an inverter or UPS. All, humble or well-to-do, with a monthly food budget and all, humble or well-to-do, with dreams and hopes.
Water and a district in Maharashtra

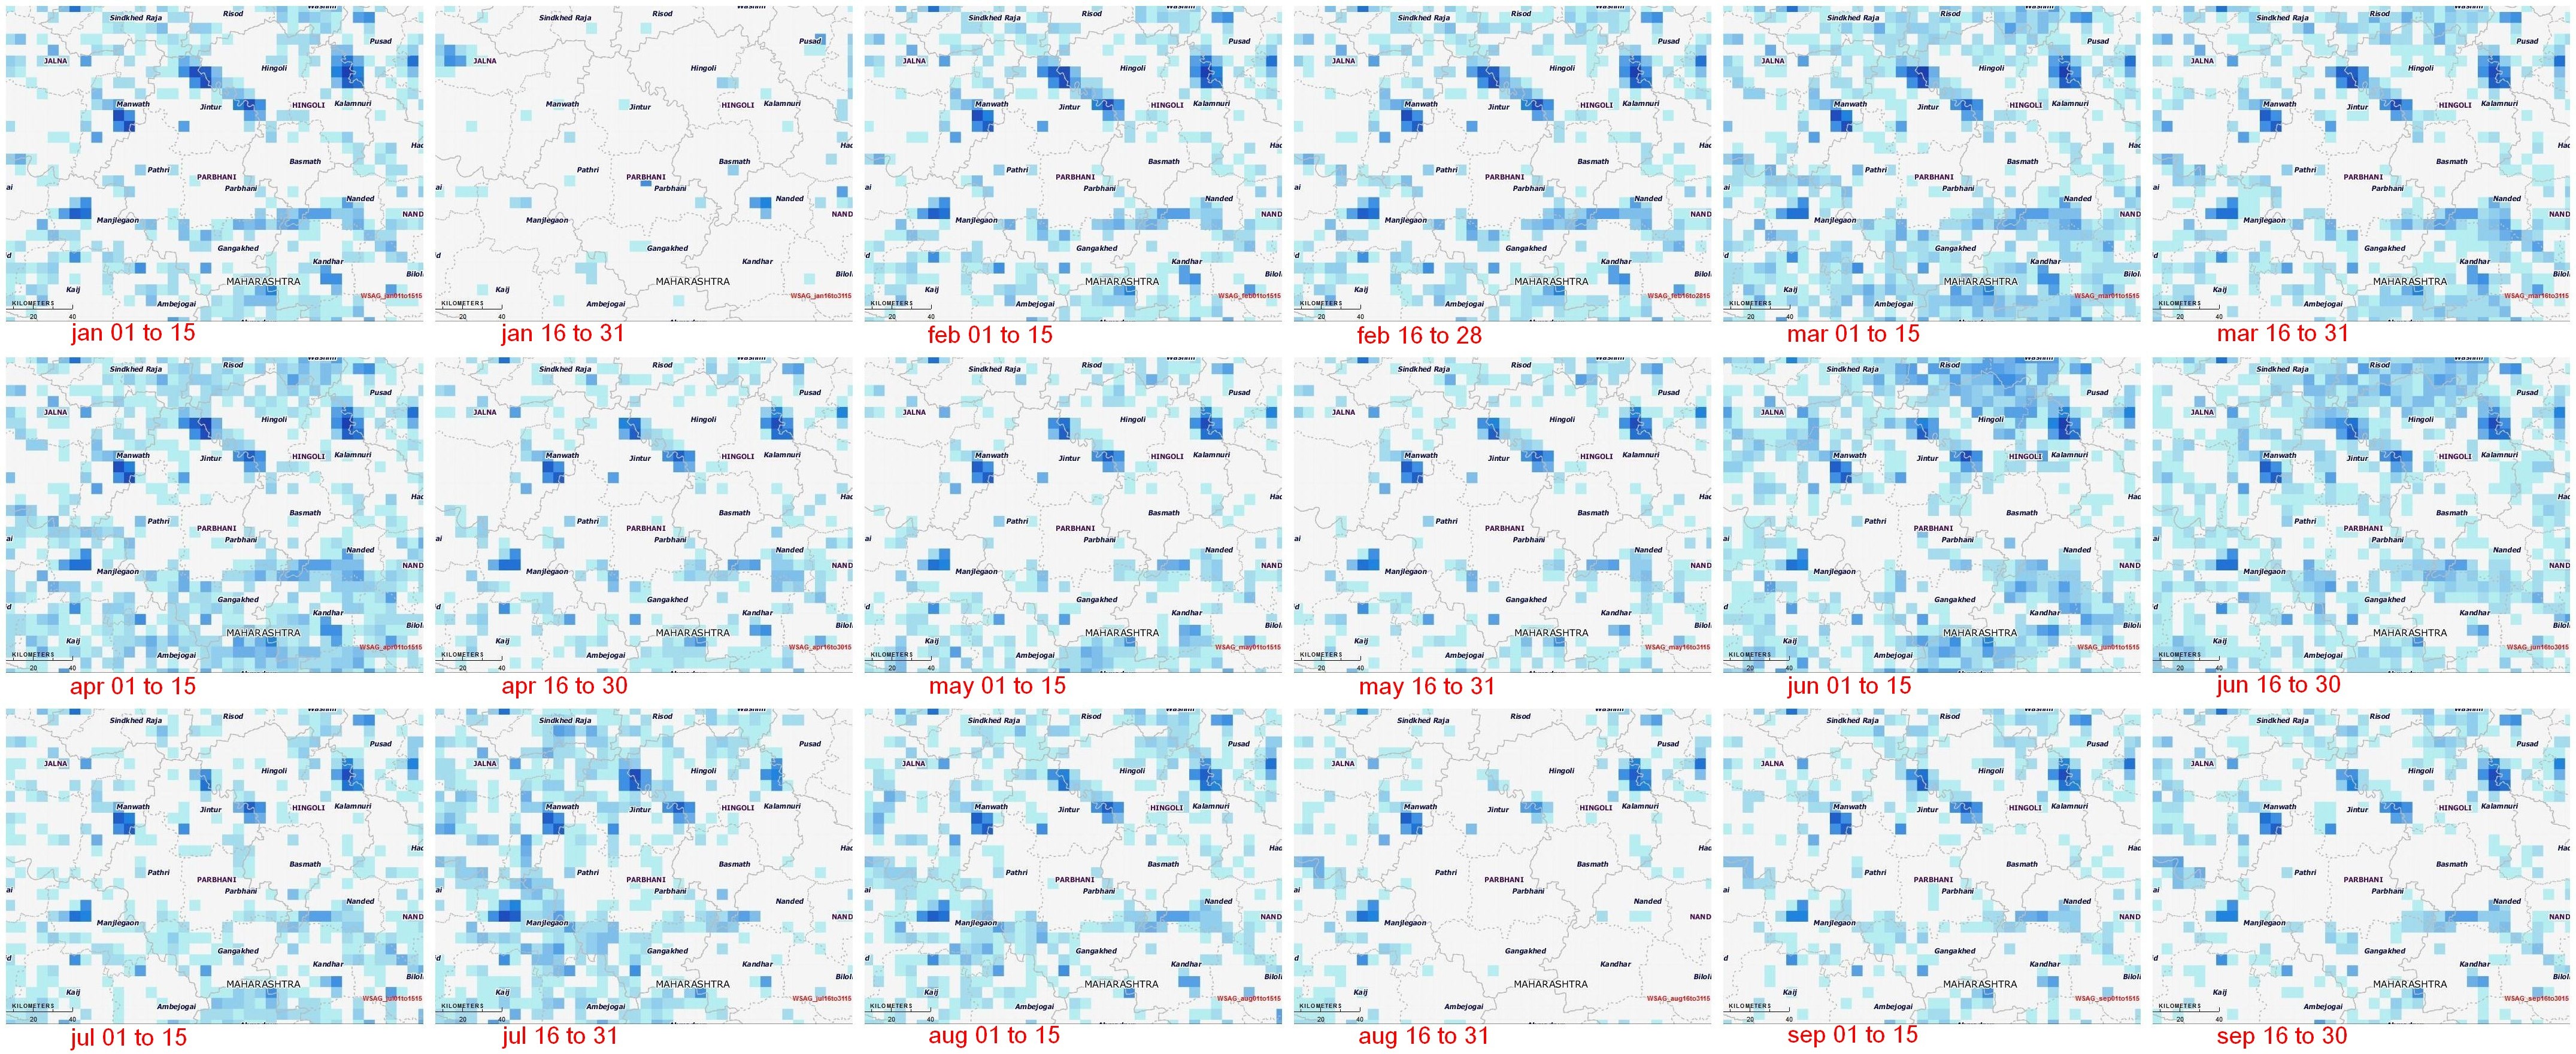
In this panel of maps the relationship between the district of Parbhani (in the Marathwada region of Maharashtra) and water is graphically depicted over time. The blue squares are water bodies, as seen by a satellite equipped to do so. The intensity of the blue colour denotes how much water is standing in that coloured square by volume – the deeper the blue, the more the water.
Water bodies consist of all surface water bodies and these are: reservoirs, irrigation tanks, lakes, ponds, and rivers or streams. There will be variation in the spatial dimensions of these water bodies depending on how much rainfall the district has recorded, and how the collected water has been used during the season and year. In addition to these surface water bodies, there are other areas representing water surface that may appear, such as due to flood inundations, depressions in flood plains, standing water in rice crop areas during transplantation stages. Other than medium and large reservoirs, these water features are treated as seasonal and some may exist for only a few weeks.
Click on this detail for a full size image (1.7MB) of the panel of fortnightly maps.
The importance of monitoring water collection and use at this scale can be illustrated through a very brief outline of Parbhani. The district has 830 inhabited villages distributed through nine tehsils that together occupy 6,214 square kilometres, eight towns, 359,784 households in which a population of 1.83 million live (1.26 rural and 0.56 million urban). This population includes 317,000 agricultural labourers and 295,000 cultivators – thus water use and rainfall is of very great importance for this district, and indeed for the many like it all over India.
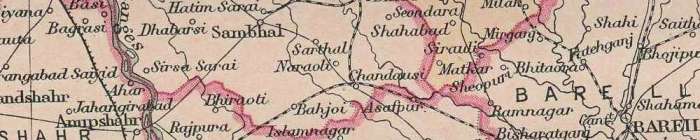
The map of Parbhani district and its talukas, from the Census 2011 District Census Handbook.
This water bodies map for Parbhani district is composed of 18 panels that are identical spatially – that is, centred on the district – and display the chronological progression of water accumulation or withdrawal. Each panel is a 15-day period, and the series of mapped fortnights begins on 1 January 2015.
The panels tell us that there are periods before the typical monsoon season (1 June to 30 September) when the accumulation of water in surface water bodies has been more than those 15-day periods found during the monsoon season. See in particular the first and second fortnights of March, and the first fortnight of April. [Here is a good quality image of the census map, 968KB.]
During the monsoon months, it is only the two fortnights of June in which the accumulation of water in the surface water bodies of Parbhani district can be seen. The first half of July and the second half of August in particular have been recorded as relatively dry.
This small demonstration of the value of such information, provided at no cost and placed in the public domain, is based on the programme ‘Satellite derived Information on Water Bodies Area (WBA) and Water Bodies Fraction (WBF)’ which is provided by the National Remote Sensing Centre (NRSC), Indian Space Research Organisation (ISRO), Department of Space, Government of India.
For any of our districts, such continuous monitoring is an invaluable aid to: facilitate the study of water surface dynamics in river basins and watersheds; analyse the relationships between regional rainfall scenarios and the collection and utilisation of water in major, medium reservoirs and irrigation tanks and ponds; inventory, map and administer the use of surface water area at frequent intervals, especially during the crop calendar applicable to district and agro-ecological zones. [Also posted on India Climate Portal.]
Lessons of monsoon 2015 for district India
 With two weeks of the June to September monsoon remaining in 2015, one of the end-of-season conclusions that the India Meteorological Department (IMD) has spoken of is that four out of ten districts in the country has had less rainfall than normal.
This overview is by itself alarming, but does not aid state governments and especially line ministries plan for coming months, particularly for agriculture and cultivation needs, water use, the mobilisation of resources for contingency measures, and to review the short- and medium-term objectives of development programmes. [See ‘A method for a post-carbon monsoon’ for a recent discussion.]
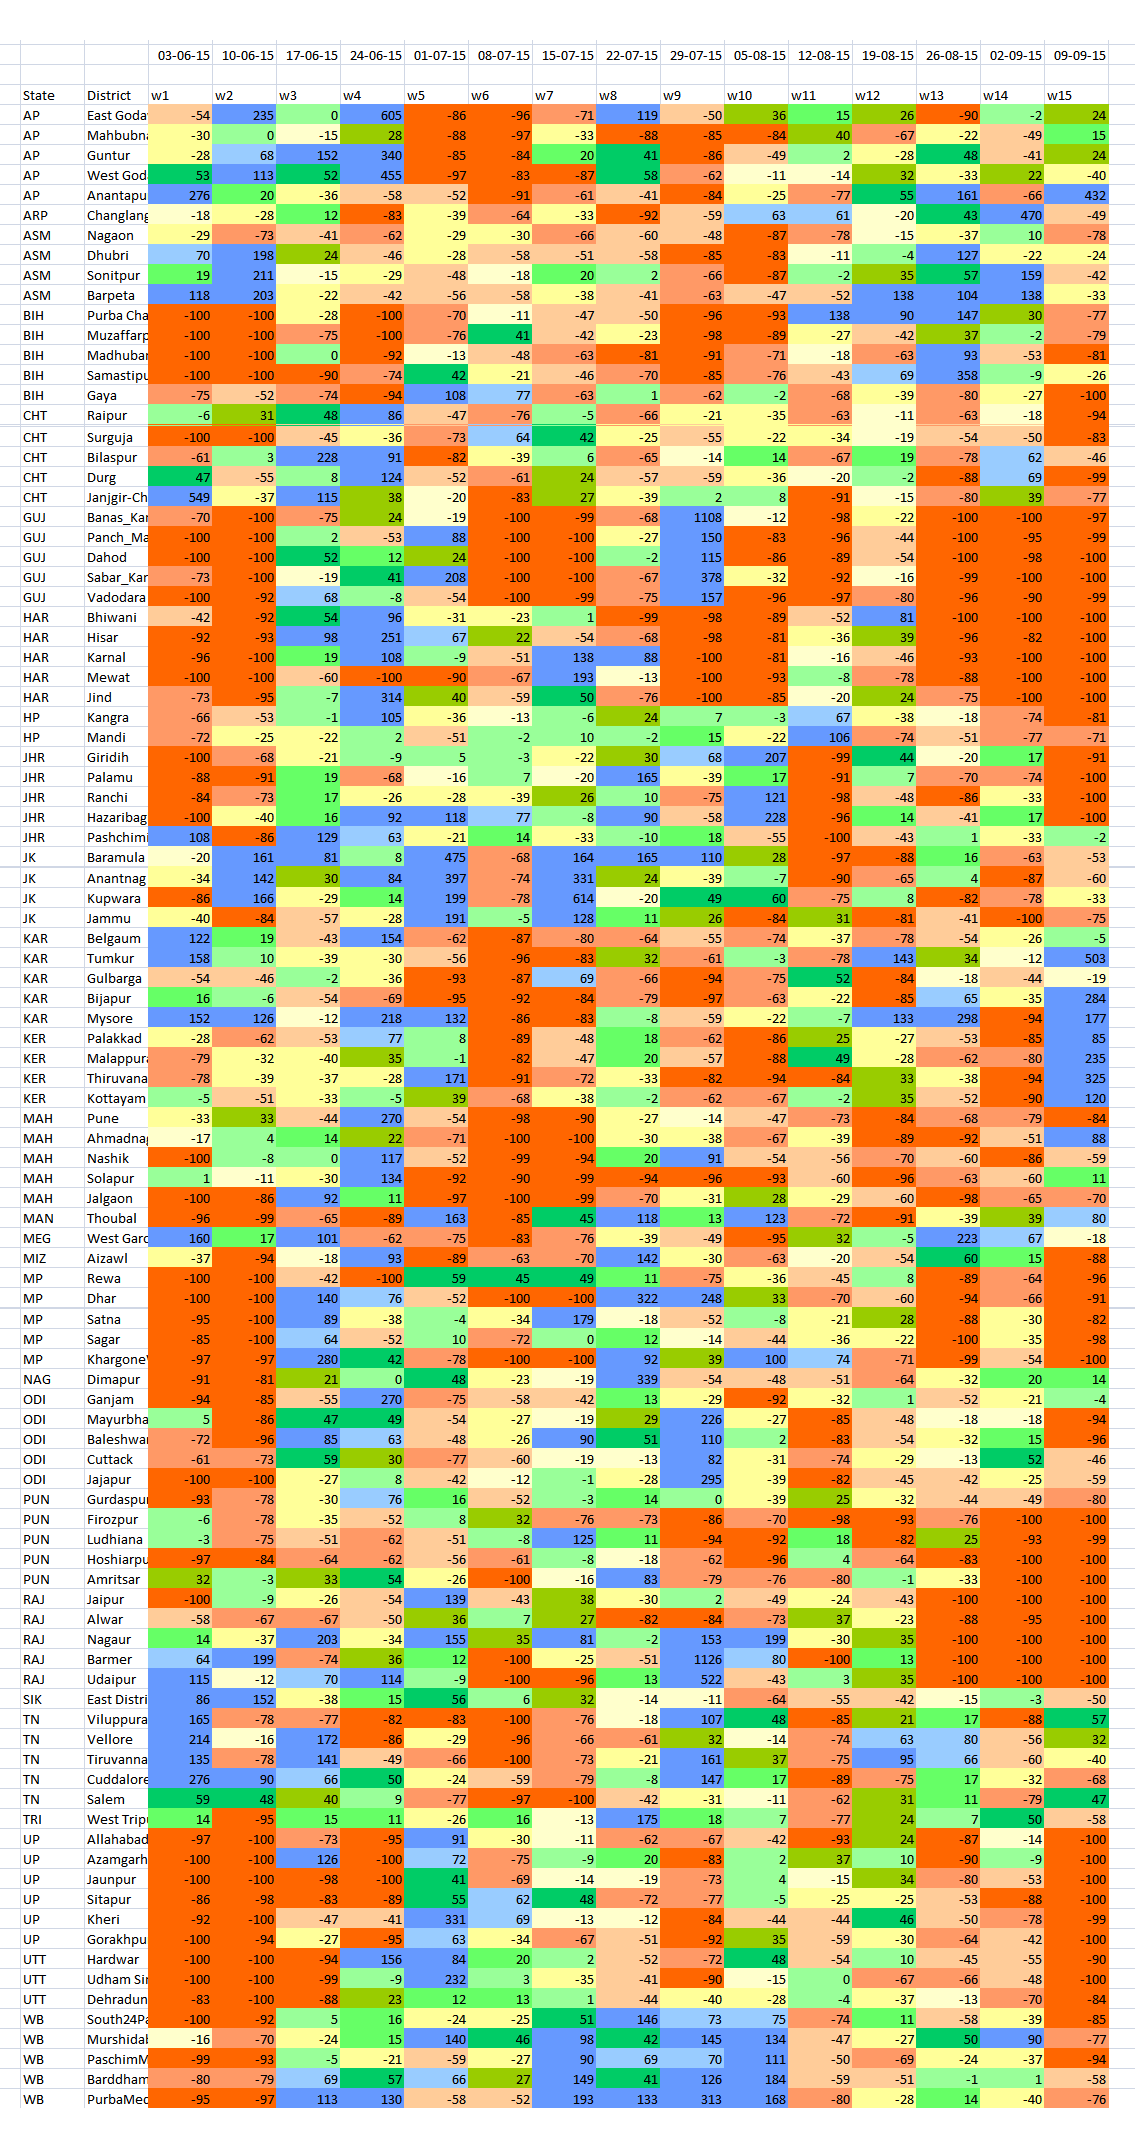 The detailed tabulation (done for 15 weeks) is meant to provide guidance of where this may be done immediately – in the next two to four weeks – and how this can be done in future. The districts are chosen on the basis of the size of their rural populations (calculated for 2015). Thus Purba Champaran in Bihar, Bhiwani in Haryana, Rewa in Madhya Pradesh and Viluppuram in Tamil Nadu are the districts in those states with the largest rural populations.
In this way, the effect of rainfall variability, from Week 1 (which ended on 3 June) to Week 15 (which ended on 9 September), in the districts with the largest rural populations can be analysed. Because a large rural population is also a large agricultural population, the overall seasonal impact on that district’s agricultural output can also be inferred.
The distribution of the districts is: six from Uttar Pradesh; five each from Andhra Pradesh, Bihar, Chhattisgarh, Gujarat, Haryana, Jharkhand, Karnataka, Maharashtra, Madhya Pradesh, Odisha, Punjab, Rajasthan, Tamil Nadu and West Bengal; four each from Assam, Jammu and Kashmir, and Kerala; three from Uttarakhand; two from Himachal Pradesh; one each from Arunachal Pradesh, Manipur, Meghalaya, Mizoram, Nagaland, Sikkim and Tripura.
Using the new 11-grade rainfall categorisation, a normal rainweek is one in which the rainfall is between +10% more and -10% less for that week. The overview for this group of 100 districts, only 11 have had five or more normal weeks of rain out of 15 weeks. In alarming contrast, there are 77 districts which have had three or fewer normal weeks of rain – that is, more than three-fourths of these most populous districts. Half the number (51 districts) have had two, one or no normal weeks of rain. And 22 of these districts have had only one or no normal weeks of rain.
From this group of 100 most populous (rural population) districts Gorakhpur in Uttar Pradesh and Nagaon in Assam have had the most deficit rainweeks, tallying 13, out of the 15 tabulated so far. There are ten districts which have had 12 deficit rainweeks out of 15 and they are (in decreasing order of rural population): Muzaffarpur (Bihar), Pune and Jalgaon (Maharashtra), Surguja (Chhattisgarh), Panch Mahals and Vadodara (Gujarat), Firozpur (Punjab), Thiruvananthapuram (Kerala), Hoshiarpur (Punjab) and Mewat (Haryana).
[Also posted by India Climate Portal as ‘Where they waited for rain in 2015’.]
So very many of us

The current world population of 7.3 billion is expected to reach 8.5 billion by 2030, 9.7 billion in 2050 and 11.2 billion in 2100, according to ‘World Population Prospects: The 2015 Revision”, which is compiled and issued by the Department of Economic and Social Affairs of the United Nations.
Of particular interest to us is the prediction (based on very sound estimates and the careful curation of data) that some time in 2022 the population of India will exceed the population of China. Currently, the population of China is approximately 1.38 billion compared with 1.31 billion (the UN-DESA estimate as of now) in India.
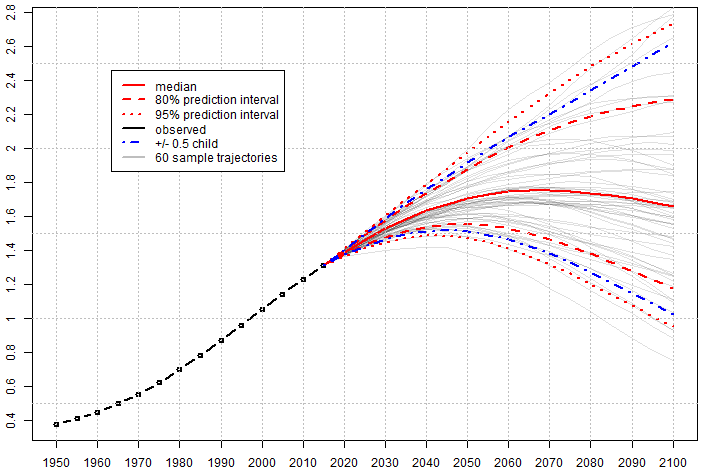
Population growth till here and the fan-tail of predictive projections for the next 85 years. Differing trajectories start becoming visible only from the mid-2020s. Image: UN-DESA
By 2022, both countries are expected to have approximately 1.4 billion people. Thereafter, India’s population is projected to continue growing for several decades to 1.5 billion in 2030 and 1.7 billion in 2050, while the population of China is expected to remain fairly constant until the 2030s, after which it is expected to slightly decrease.
China is now a ‘low fertility country’, that is, one in which women have fewer than 2.1 children, on average, over their life-times. Low-fertility countries now include all of Europe and Northern America, plus 20 countries of Asia. India is an ‘intermediate fertility’ country, that is, where women have on average between 2.1 and 5 children. Intermediate-fertility countries are found in many regions, with the largest being India, Indonesia, Pakistan, Bangladesh, Mexico, and the Philippines.
More urbanisation is expected which will concentrate larger numbers of people into town and city wards. Few will be as ideal as this graphic suggests.
Most of the projected increase in the world’s population can be attributed to a short list of high-fertility countries, mainly in Africa, or countries with already large populations. During 2015-2050, half of the world’s population growth is expected to be concentrated in nine countries: India, Nigeria, Pakistan, D R Congo, Ethiopia, Tanzania, USA, Indonesia and Uganda (listed according to the size of their contribution to the total growth).
Currently, among the ten largest countries in the world, one is in Africa (Nigeria), five are in Asia (Bangladesh, China, India, Indonesia, and Pakistan), two are in Latin America (Brazil and Mexico), one is in Northern America (USA), and one is in Europe (Russia). Of these, Nigeria’s population, currently the seventh largest in the world, is growing the most rapidly. Consequently, the population of Nigeria is projected to surpass that of the USA by about 2050, at which point it would become the third largest country by population in the world.
The year of 1.275 billion Indians
 Four years ago the Census of India 2011 completed its count – the world’s largest human counting exercise, which required an army of enumerators to carry out. The final tally – which was fixed in late 2012 although the provisional estimates for India and the states came within a few months of the census having counted the residents of the last remote hamlet – was 1,210,569,573 of us (833,463,448 rural and 377,106,125 urban).
That tally was valid for a particular day only, which was the last day of March 2011. Although the 1.2 billion statistic was used (and continues to be, popularly) to describe India, Bharat, our people and their lives and work, it is of course an incorrect number. The population has been rising from the first day of April 2011 as the daily count of births minus deaths (to give the net addition) adds to that 1.2 billion. Now, the net daily addition is about 40,000 a day!
But remember that those who were counted as net daily additions in 2001 – when the previous Census was done – are today only 14 years old, so the total population tally is not adults, it is infants, toddlers, children, early teenagers, late teenagers, youth, adults, mature adults, senior adults, elderly folk and really old folk.
It would have happened in February 2013, the crossing of the billion and a quarter mark (1.25 billion). What will our tally be in March 2015, two months from now? It depends how complex you want your calculations to be. The simplest method would be to use 1.210 billion as the 2011 tally and multiply that by the yearly population growth rate based on the increase in our population between 2001 and 2011. The result would be an estimate which does not recognise different population growth rates for rural and urban regions, and indeed these differ in every state. Naturally, for states with large populations (such as West Bengal, Bihar, Madhya Pradesh or Karnataka) the growth rate you apply can change your estimate by a significant number.

The population estimates for India by the Population Division of the UN’s Department of Economic and Social Affairs. The four estimates use low, medium, constant and high fertility rates as their basis. Source: World Population Prospects: The 2012 Revision (http://esa.un.org/unpd/wpp/index.htm)
It was, I had estimated last year, that the 400 million mark was crossed for urban India: “By the end of 2014 June, a group of cities will cross important population thresholds. This upward procession of population numbers – for districts, cities and states – is scarcely observed by administration or by citizens, but continues apace.”
To find the startling numbers in this graphic, I have used the individual growth rates for rural and urban populations in all states and union territories, based on the 2001-2011 period. This helps, but for the demographic purist it isn’t enough (and I haven’t attempted it here) because it does not factor in the changes in fertility rates – and since 2012 there have been reports that the fertility rates have dropped faster than expected for the period after 2011 – and, more minutely, changes in the age at which women marry, the spacing of children and so on; these are the formulae of the careful demographer.
To do so is necessary. It is even vital because so much of public and social provisioning depends on understanding population trends well and preparing for what the next five, ten and twenty years will bring. There is the matter of food and the public distribution system (see ‘India’s 681 million hungry rural citizens’ and the question: “What do and what can rural residents spend on food and the essentials of living in India?”).
There is the question of how much towns and cities can expand, and two years ago, according o the Census 2011 data, India in 2015 would have 63 cities with populations of over a million (ten more than we had in 2011), which led to the question of whether India is ruled for its cities.
But the big picture remains. In 2015 there are a number of population markers that will be reached. The population of rural Bihar will cross 99 million, the population of Rajasthan will approach 73 million, the population of urban Punjab will approach 11.2 million, the combined population of the seven North-Eastern states (excluding Assam) will reach 14.8 million, and the population of rural Gujarat will approach 35.2 million.
Urban populations have grown more rapidly and the consequences of such growth includes cities that are more difficult to live in (see “When the 65 million who live in India’s slums are counted”). But the trend tells us that in 2015 the population of urban West Bengal will cross 30 million, the population of urban Maharashtra will approach 55 million, the population of urban Karnataka will cross 26 million, and the population of urban Tamil Nadu will be more than its rural population. And finally, at some time during 2015, the number of Indians will touch 1,275 million (or 127 crore).
Fat-finding with a new meter for Bharat
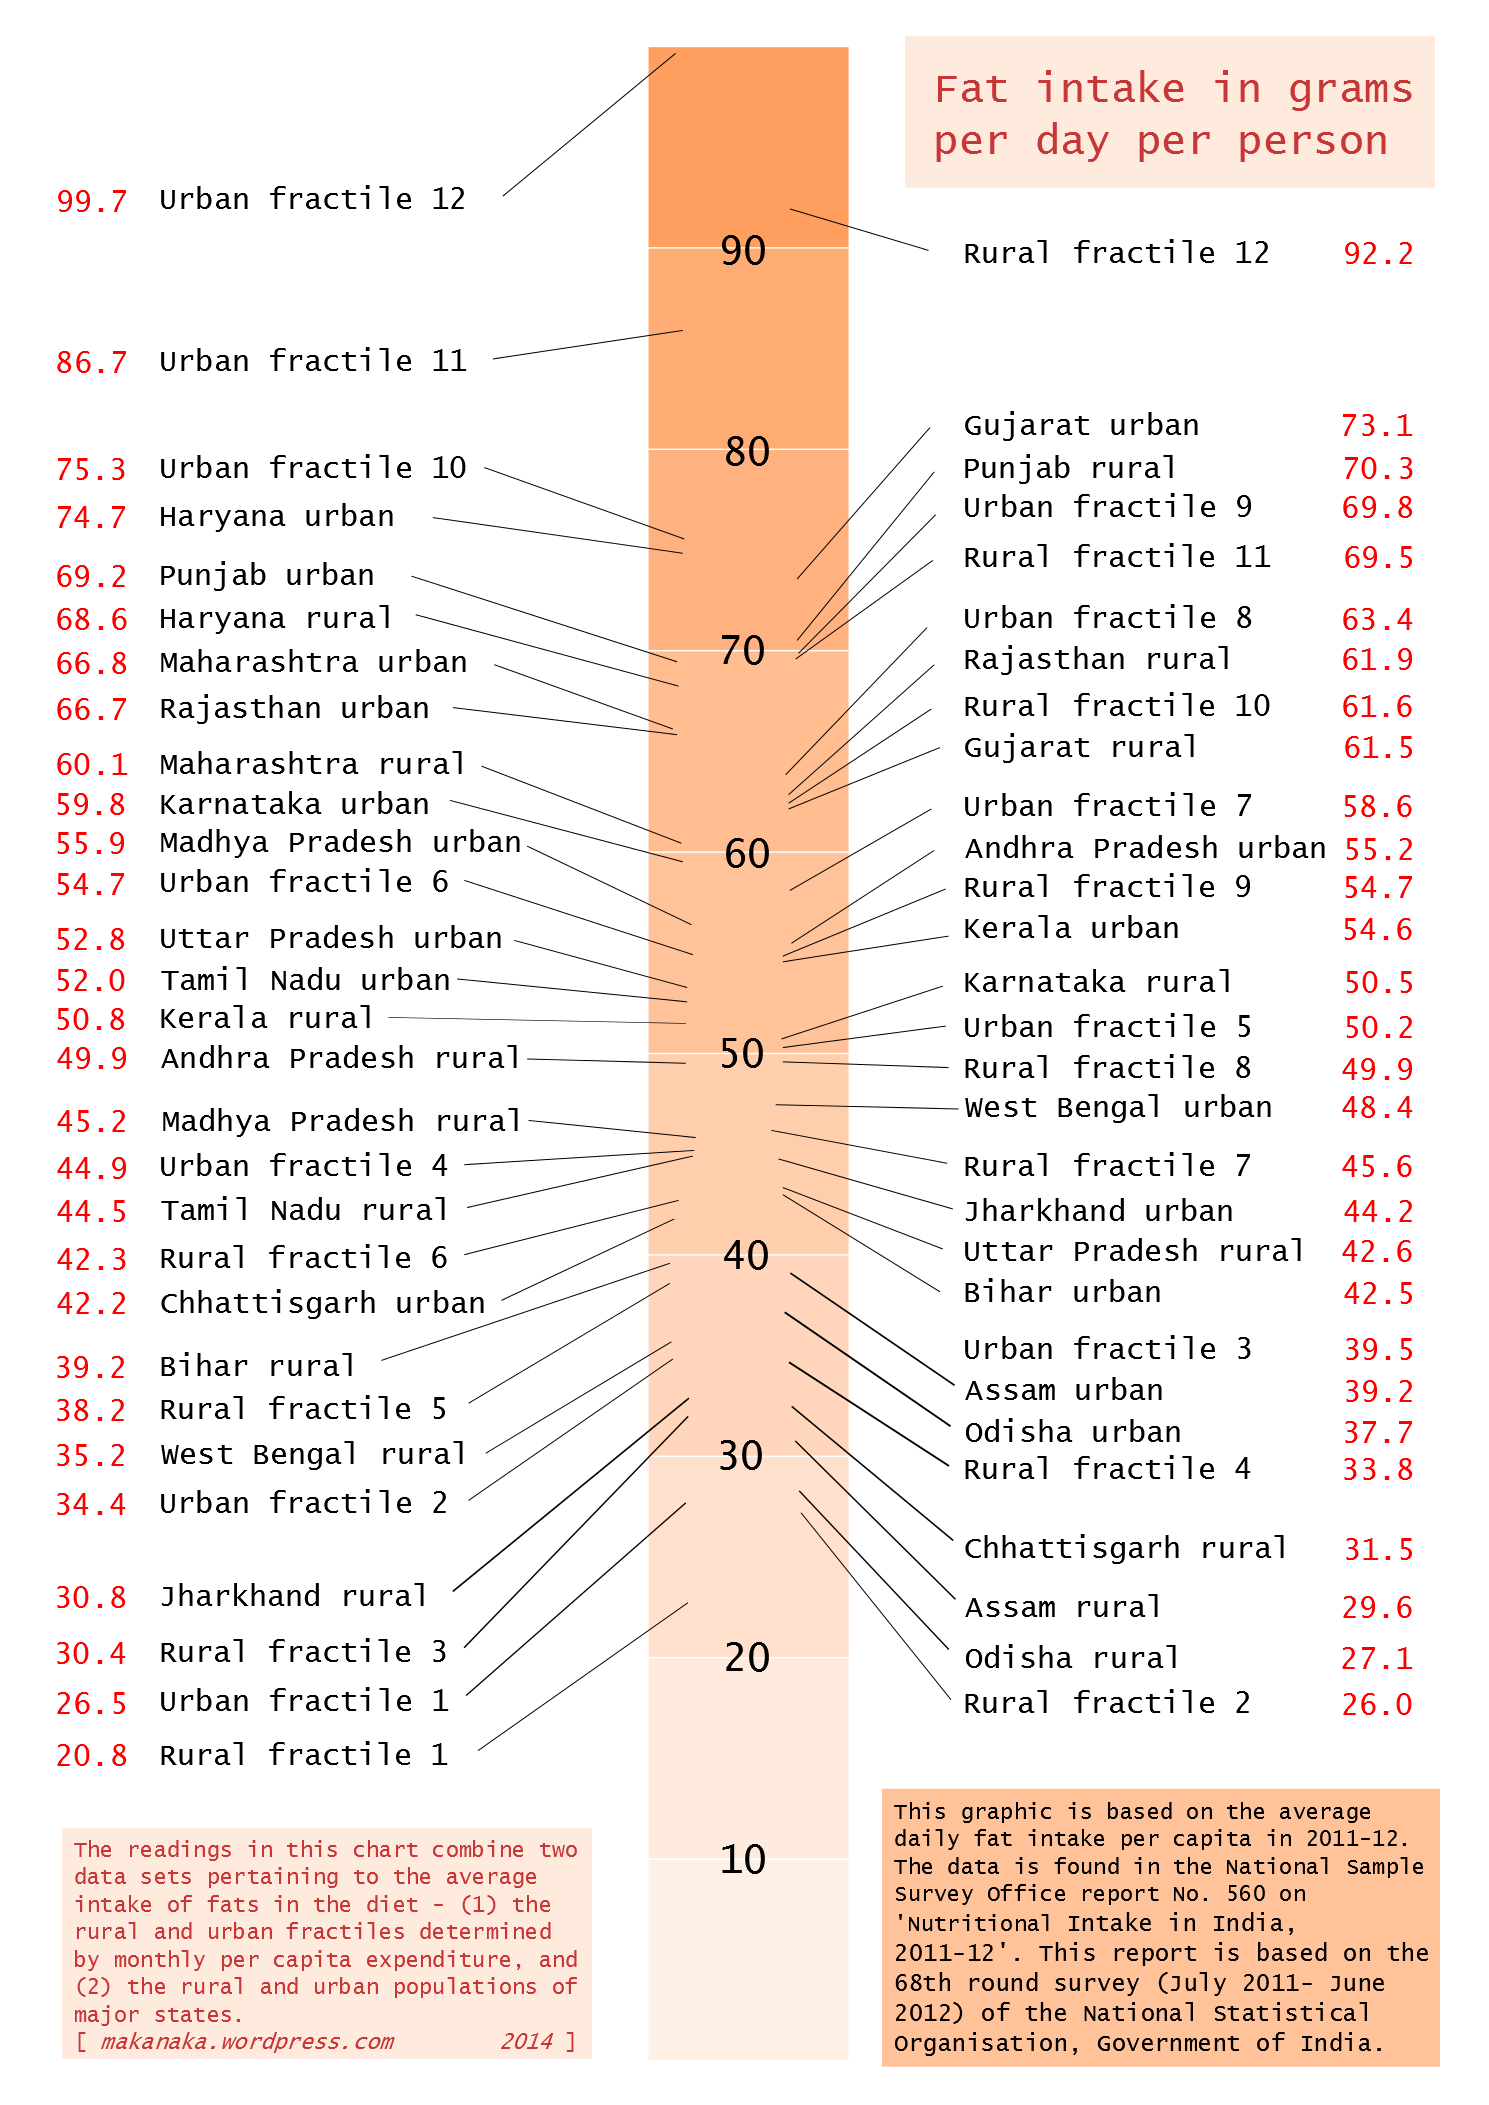 This rather nice infographic (all our own work) shows the variation in average fat intake per capita across fractile classes of monthly per capita expenditure (MPCE) at the all-India level for the rural and urban populations. It also shows the variation in fat intake between rural and urban populations of 17 major states.
We find that the average fat intake for India was about 46gm per rural person per day and 58gm per urban person per day (in 2011-12). But averages hide a great deal, and our intriguing fat-finding meter brings out, with alarming clarity, the (somewhat greasy) details.
This graphic is based on the average daily fat intake per capita in 2011-12. The data is found in the National Sample Survey Office report No. 560 on ‘Nutritional Intake in India, 2011-12’. This report is based on the 68th round survey (July 2011 to June 2012) of the National Statistical Organisation, Government of India.
The NSS report found that the 10th and 11th rural population fractiles consume twice as much fat per day as those in the 3rd rural fractile class (members of a fractile numbered lower spend less per month than members of those numbered higher). Likewise, the 8th and 9th urban population fractiles consume 1.5 times as much fat per day as those in the 3rd and 4th urban fractile classes.
There is much variation between the fat intake by rural populations of states. In both rural and urban, per capita intake was lowest in Odisha (rural: 27.1gm; urban: 37.7gm) and Assam (rural: 29.6gm; urban: 39.2gm). The states with highest fat intake were Haryana (rural: 68.6gm; urban: 74.7gm), Gujarat (rural: 61.5gm; urban: 73.1gm) and Punjab (rural: 70.3gm; urban: 69.2gm).
But the NSS report found that the increase in fat intake per capita with the rise in MPCE level is steeper than the corresponding increase for protein intake (we will link this finding with a forthcoming infographic). Per capita fat intake in the top fractile class of the urban sector was about 100gm, more than three times that in the lowest fractile class (about 27gm), while in the rural sector the intake of the top fractile class, at 92gm, was more than four times higher than that of the bottom class (21gm).
In contrast to the remarkable closeness of average protein intake across the rural-urban
divide, average urban fat intake is noticeably higher than rural intake in all the fractile
classes. Except for the lowest fractile class (bottom 5% of population ranked by MPCE), the
difference in per capita fat intake between a rural fractile class and the corresponding urban
fractile class is never less than 7.5gm.
Sizing up city life

Close ranks of tall residential towers signal a new township on the outskirts of Beijing, P R China.
Some two years ago, it was calculated, the world firmly entered the urban age, for the available evidence pointed to a startling truth: more people now live in cities than outside them. The balance between urban and rural populations differs between countries, at times considerably. Chad and Congo have about the same number of people living in cities, 2.95 million and 2.96, but these urban populations are 22% of the total population for Chad and 65% of the total population for Congo.
Overall, the balance between urban and rural populations is thought, conventionally, to directly describe whether a country is likely to be in the high income or low income groups of countries. The Department of Economic and Social Affairs – a specialist agency of the United Nations – entrusts such calculations to its Population Division whose ‘World Urbanization Prospects’ found, in its 2014 revision, that the proportion of urban populations for high income countries was 80% while that for low income countries was 30%. This seems to lend weight to the conventional wisdom that it is cities that galvanise the creation of the sort of wealth which gross domestic product (GDP) growth depends on.
Cities are seen to harbour dynamism and vitality. For those who live in such cities, this is largely true. Residents of cities like Seoul (Korea), Lima (Peru), Bangalore, Chennai and Hyderabad (all India), Bogotá (Colombia), Nagoya (Japan), Johannesburg (South Africa), Bangkok (Thailand) and Chicago (USA) are very likely to agree that living and working in their respective cities has brought tham prosperity, and are less likely to ponder about this group of cities being the top ten in the world with populations under 10 million in 2014 (there are 28 cities worldwide with populations of at least 10 million).
 There is however another aspect to the formation of cities. In 1927, the film Metropolis, conceived by Fritz Lang and delivered as an artfully stylised cinematic message, described the strains and dangers of the power that cities had already come to have over their residents. For Metropolis was a futuristic city where a cultured utopia existed above a bleak underworld populated by mistreated workers. Just over 50 years later, another film, Blade Runner (1982), blended science fiction with a disturbing portrait of a dystopian and dangerous cityscape that was both gigantic and technology-centric, through which the human element struggled to find meaning.
If Metropolis represented the post-industrial revolution European cityscape, then Blade Runner depicted the flagship of what has been called the Asian century, for its mesmerising and frightening urban backdrop was Tokyo then, and could well be China now. The Japanese capital remains in 2014 the world’s largest city with an agglomeration of 38 million inhabitants, followed by New Delhi with 25 million, Shanghai with 23 million, and Mexico City, Mumbai and São Paulo, each with around 21 million inhabitants. By 2030, so the projections say, the world will have 41 mega-cities of more than 10 million inhabitants.
For all their celebrated roles as centres of wealth, innovation and culture, these mega-cities and their smaller counterparts exert dreadful pressures on natural resources and the environment. These are already either unmanageable or uneconomical to deal with, more so in the rapidly growing urban centres of Asia and Africa. Despite the lengthening list of urban problems – most caused by rural folk flocking to cities faster than urban governance structures can cope with existing needs – demographers foresee that today’s trend will add 2.5 billion people to the world’s urban population by 2050. India, China and Nigeria are together expected to account for 37% of the projected growth of the world’s urban population between this year and 2050. It is there that the idea of the city, which so fascinated Fritz Lang, will be sorely tested.
