Posts Tagged ‘food inflation’
Visiting our total household food budget

Twice as much over the 11 years until 2009-10, and three times as much over the 10 years until 2012-13. That has been the increase in rupee expenditure for this basket of foods.
The data is from the private final consumption series, calculated by the Central Statistics Office (CSO) of the Ministry of Statistics and Programme Implementation (MoSPI). The totals (left scale of the chart) is in thousand crore rupees.
In this chart I have shown the expenditure (in current rupees) for: Cereals and Bread, Pulses, Sugar and Gur, Oils and Oilseeds, Fruits and Vegetables, Milk and Milk Products, and Meat Egg and Fish. These totals also indicate the size in rupees of the food industry – but do not include the processed and packaged food industry.
The rise in consumption expenditure expressed in rupees is a money measure alone, and not a quantity or volume measure. We can see that the portion of milk and milk products in this group has gone up from just over 18% to 25% over 14 years, and the portion of meat, eggs and fish has gone up from just under 9% to 12.5% over the same period.
From 2006 the rising trend of expenditure on fruits and vegetables became steeper than the rising trend of cereals and bread. In 2005-06 the portion spent on fruit and vegetables in this group was just over 26% and that has risen slightly to 28% in 2012-13. In contrast for cereals and bread, the portion of 27.5% in 2005-06 has dropped to just over 21% in 2012-13.
Why the FAO food index is also an oil gauge

The revealing relationship between the FAO cereals price sub-index, the OPEC Reference Basket price of a barrel of crude oil, and the Baltic Dry Index (right scale).
The Food and Agriculture Organisation (FAO) of the UN has released its food price index data and commentary for 2014 October. This would be of considerable interest if only the index described the tendencies of food prices as experienced by consumers. Alas FAO’s food price index, as we have remarked upon several times in the past, pays no attention to the true cost of food staples.
Of what use is the FAO index, which is used as a reference by any government (and UN member state) to judge the value of its food exports (or to judge whether when importing grain it is paying what seems to be a fair price)? In the first place, the index (which itself is composed of separately calculated cereal, vegetable oil, dairy, meat and sugar indices) is not a consumer food price index.

The FAO food price index and its component sub-indices for the period 2012 January to 2014 October. A general downward trend, says the FAO, but this is the picture for international food trade and not consumer food retail price.
The FAO has not claimed it is, but neither has the agency clearly and plainly said it is not. It should, because financial and general interest media all over the world report the ups and downs of this index as if it portrays how local food prices move, and of course it does not.
The FAO index is used by international traders whose business it is to buy and sell food staples (including cereal, vegetable oil, pulses, dairy, meat and sugar). Perhaps some of them use it as a benchmark while others forecast trends from its sub-indices. It may be used to validate the accuracy of a particular kind of agricultural commodity futures index, and help judge whether an investment in the production of food, its movement, its stocking or its trade is going to be a good investment or not. As you can gather, it is not an index that consumers can use, because consumers are local and this is assuredly not.
What pulls the FAO food price index up, down or sideways? There are two important factors at work on the main index. One is the price of petroleum products, the other is the cost of moving grain (or any other food staple). You may assess the short or long-term trend of the food index against the current or projected price of Brent crude (preferred in Europe), West Texas Intermediate (preferred in the USA) or the OPEC reference price (preferred almost everywhere else).

The FAO food price index and its component sub-indices for 2014 till October. The downward trend of the last six months, which the FAO commentary is faintly praising, mirrors the trend of crude oil prices over the same period.
And then you will assess what the food price index describes against the cost of moving a large quantity of the agricultural commodity to be traded across an ocean, for which the Baltic Dry Index will be consulted.
[If you are a trader and want the FAO food price data and movements, go here. The usual commentary can be found: “The FAO Food Price Index averaged 192.3 points in October 2014, marginally (0.2 percent) below the revised September figure but 14.3 points (6.9 percent) short of its corresponding level one year ago” and so on.]
To help determine what the FAO food price index is depicting, I have made charts for the index (and sub-indices) for the period 2012 January to 2014 October; for the index (and sub-indices) for 2014 till October; a chart that shows the FAO cereals sub-index together with the OPEC Reference Basket Price for a barrel of crude oil and the Baltic Dry Index (this is the shipping index most commonly referred to for the movement of dry goods by sea) for the period 2012 January to 2014 October; and a chart that plots the changes (from month to month) in the three indexes taken together (FAO Cereals, OPEC Reference and Baltic Dry).

The FAO food price index and the OPEC Reference Basket price of oil have much more in common than the Baltic Dry Index, which has swung with volatility since 2012 January.
What they describe can be found in the captions, but it becomes clear from a glance at the FAO-OPEC-Baltic charts that the food price as calculated by FAO has very much more to do with how energy is used to produce food staples (that is, the use of petroleum products directly, and the use of fossil fuels-derived energy) and how energy is used to transport, store, process, transport it again and retail it.
I see it as an index that describes the energy quotient of industrially produced food staples, and so it has little if anything to do with any other form of agriculture, in particular the smallholder, family-oriented and organic agriculture that the FAO advertises its concern about.
What we know and don’t about the true price of dal
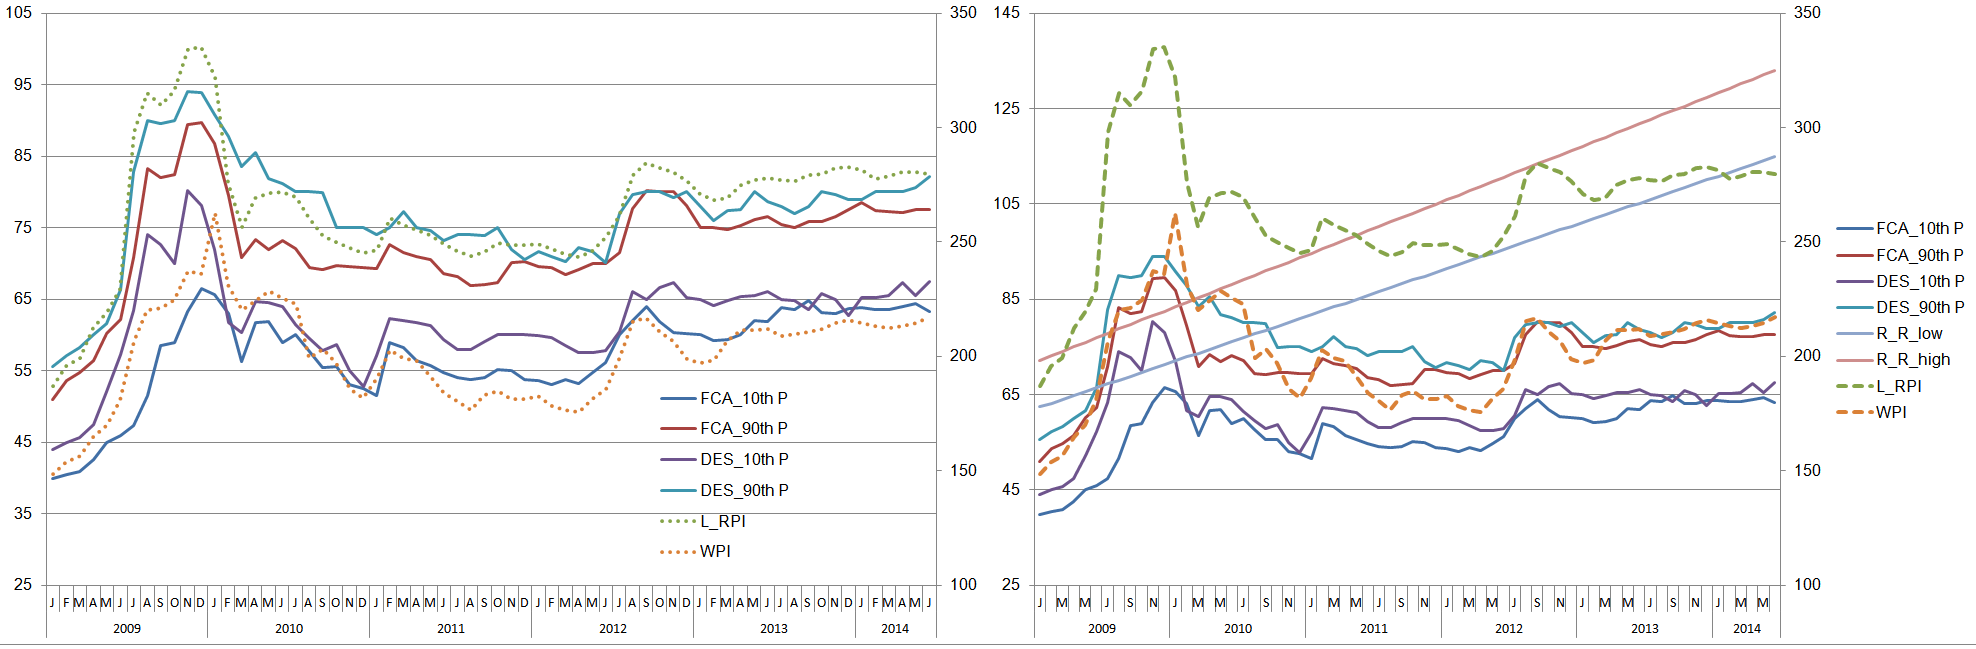
If you look at only the official account (left), the price of dal has been comfortable, but the consumer experience (right) tells a quite different story.
How urgently our national food price measuring methods need a complete overhaul is best shown with the example of a staple everyone is familiar with: arhar or tur dal.
Price indexes or indices are useful because they help us view the change in the price of a particular food staple over time, not the price itself, but change in price when taken from a base year or month. Price records are useful because they log the price (per kilo for retail consumption) of a food staple in a week or month.
The three ministries concerned with food prices update their indices or actual price reports every month or week. These are: the Department of Consumer Affairs of the Ministry of Food and Consumer Affairs, the Directorate of Economics and Statistics of the Department of Agriculture and Cooperation of the Ministry of Agriculture, and the Labour Bureau of the Ministry of Labour. In addition, there is the wholesale price index prepared by the Office of the Economic Adviser, Ministry of Commerce.
 Usually, movements and trends in these indices and price logs are examined by themselves, and conclusions are drawn about whether the price of a food staple has been held steady or is rising steadily or is rising seasonally and also annually (we never see prices and trends going downwards).
But this is not enough. We need also to examine whether these indices and price logs are describing what they are designed to in the same manner and – very much more important – whether their descriptions are reasonable or not.
In the two chart panels, I have plotted the descriptions for arhar/tur dal from several sources together. The left chart has solid coloured price lines from the Department of Consumer Affairs and from the Directorate of Economics and Statistics. Each has two lines, the higher at the 90th percentile and the lower at the 10th percentile of all monthly prices logged from 2009 January until 2014 June. The two dashed lines are indices – the wholesale price index for arhar/tur and the Labour Bureau’s retail price index for arhar/tur over the same period. The price logs are plotted against the left index and the price indices are plotted against the right index.
Between the two indices the WPI for arhar appears lower than the Labour Bureau index, but that has only to do with a difference base period. The overall pattern they describe is the same. The two sets of price logs shows the two different levels for the 90th and 10th percentiles – in both cases the prices recorded by the Directorate of Economics and Statistics are higher than those recorded by the Department of Consumer Affairs. However they all follow a similar pattern over the 66 months illustrated here.
 And so to the question: how true is what these indices and price logs are describing?
The answer is in the right chart. Here, two more lines are seen. These are both ascending relatively evenly over the 66 months, one at a slightly steeper rate. These I have called the ‘real retail’ price lines, one low and the other high. They describe the prices paid by urban consumers for a kilogram of arhar/tur dal based on what has been charged by ordinary retail outlets in towns and cities, with the price readings collected informally. They have also been ‘straightened’ by applying a 12%-14% true inflation that has been experienced by urban food consumers over these 66 months.
The effect, as you can see, is startling. The ‘real retail’ price lines explain why the consumption of pulses has been dropping and continues to drop especially amongst urban households whose livelihoods depend on multiple informal jobs. At Rs 90 to Rs 110 per kilogram, this dal (like other pulses) is almost beyond reach. At Rs 120 to Rs 130 per kilogram – these are levels that began to be recorded by consumers, but not consistently by the government price monitoring agencies, even two years ago – the dal can be consumed only by the upper strata of the urban middle class.
The question that immediately arises is: why is the real food price inflation being experienced by consumers not reflected in the official food price logs and indices? I will take up this question in the next posting.
The hunger that Bharat inherited from two lean decades
What did the ‘liberalisation’ of the Indian economy bring? What has 20 years of the ‘India growth story’, which is sold around the world, brought its labour and workers? How have households rural and urban fared at balancing their budgets and meeting their needs? Poorly, for it has been a struggle that continues.
 An analysis in the journal of the National Sample Survey Office, Sarvekshana, has compiled estimates of average calorie intake for the country and the major states from six quinquennial (every five years) surveys of consumer expenditure. These surveys show a decline in average calorie intake between 1972-73 and 2009-10. The overall decline is substantially greater for rural than for urban India, and appears to have been sharper in the period since 1993-94 (as measured by the 50th round of NSSO surveys), especially in the urban sector.
The analysis on ‘Trends in Nutritional Intake in India’ has shown that the proportion of households with calorie intake below the level of 2700 kcal per consumer unit per day (this is a measure different from per capita) has grown steadily since 1993-94: from under 52% in rural India to nearly 62%, and from 57% in urban India to about 63%.
This is no surprise to the large proportion of our population who have borne the merciless brunt of food inflation for close to a generation. Between 2004 and 2013, food prices in general rose by 157%. Cereals, the staple diet of the poorest, were high on the scale, with rice at 137% and wheat at 117%. Pulses – the sole source of protein for most – had risen by 123%. Potato was even higher at 185%. As for vegetables, they have long priced themselves out of the diet of the poor, by rising up to 350%. This crippling rise continued while the government (UPA-I and UPA-II) loudly claimed every few months it would bring prices down.
 That is why the share of cereals in total calorie intake has declined since 1993-94 by nearly 7 percentage points for rural India and by about 3.5 percentage points for urban India: the share of oils and fats has on the other hand risen by 3 percentage points for both. The share of milk and milk products has grown by about 1.4 percentage points in urban India but by only 0.6 percentage points in rural India.
Moreover, at the all-India level protein intake has fallen from 60.2 grams to 55 grams per person per day in rural India and from 57.2 grams to 53.5 grams in urban India over the period 1993-94 to 2009-10. The decline has taken place in most major states but has been sharpest in rural areas of Rajasthan, Haryana, Uttar Pradesh and Punjab – where intake has fallen by 9-12 grams.
As the major trade unions have been raising an alarm about at least every quarter, the price of rice for BPL (below poverty line) card holders increased from Rs 350 per quintal in 1997-98 to Rs 415 per quintal in 2007-08. In the same period the APL (above poverty line) price was increased from Rs 550 per quintal to Rs 755. For wheat, the price for BPL card holders was increased from Rs 250 per quintal to Rs 415 and for APL card holders from Rs 450 to Rs 610 in a period of 10 years.
 In such a situation, fats ought not to be a contributor to calories more than it was 30 years ago. But the analysis tells us otherwise – for India has become the favoured importer of palm oil from Malaysia and Indonesia. Every major state shows an increase in its population’s fat intake. At the all-India level the increase has been from 31.4 grams per person per day in 1993-94 for the rural population to 38.3 grams in 2009-10 – a rise of 7 grams per day over the 16-year period, and from 42 grams to 47.9 grams per day for the urban population, a rise of 6 grams per day over the same period. Between 1993-94 and 2009-10, the contribution of cereals to protein intake has fallen by about 4.5 percentage points in rural India and by 3 percentage points in urban India, while the contribution of pulses has fallen slightly in both rural and urban India.
This analysis from the NSSO must be viewed against the growing trend in India of the corporatisation of agriculture and the industrialisation of the food system. New market monopolies whose reach is far greater than could be conceived in 1993-94 are now at work, aided by speculative financial predators. There is in response a need for strengthening social ownership of the cultivation of food staples, of the organic agriculture movement, of shortening the distances that food travels, of localisation of the Bharatiya food web.
Faster, higher, dearer – dizzying pace of food price rise in India

The alarming tale of food prices, from 2004 January to 2013 August, that have squeezed the household budgets of cultivators and rural labourers.
For most of 2013, the central government broadcast, through important cabinet ministers and official statements, its worry about economic growth, that every effort must be made to steer India back towards a high economic growth rate. In the food and agriculture sector, that effort has led, in the last four to five years, to a gulf in growth rates between agriculture and the combination of processed and packaged foods and beverages (which the food retail industry is being arrayed around). While the agriculture sector (including fisheries and livestock) has been growing at or just above 4% a year for the last several years, the processed foods and beverages industry has been growing at around 15% a year.
The effects of this growth (setting aside criticisms of how such growth is measured) in both these allied sectors – the one much larger but the other which is a feature of urbanising India – may be seen in the transformation of cultivation and of food. That is why, not only has the consumer price index for rural citizens climbed without let every year for the last nine years, there is evidence in this index data to show that the rate of increase has accelerated in the last few years.

The trend we have all become painfully familiar with, in states and towns measured and unmeasured.
The consumer price index for agricultural labourers (usually abbreviated to CPI-AL) from 2004 January to 2013 August shows a steady rise for all the 20 states in the set (see the chart alongside). Compiled by the Labour Bureau, Ministry of Labour and Employment, the data shows that the average CPI-AL of these states has been rising around 50 percentage points a year for the last four years. Using quarterly averages (taken for June, July and August) for 2013, 2012 and 2011 and comparing them with the same averages a year earlier, we see that the all-India increases in the index for 12 months (2013 over 2012) is 12.96%, for 24 months (2013 over 2011) is 22.68% and for 36 months (2013 over 2010) it is 34.08%.
States that experienced the steepest increase in the CPI-AL over 36 months are Gujarat with 32%, Punjab 32.4%, Odisha 32.5%, Rajasthan 35.1%, Maharashtra 35.3%, Manipur 37.6%, Andhra Pradesh 37.9%, Kerala 38.4%, Tamil Nadu 39.2% and Karnataka 48.2%. That is why we have witnessed the widespread trend of migration by rural populations towards smaller urban agglomerations, with the impacts recorded in various data releases from Census 2011.
The Labour Bureau data contains evidence that for all states which have CPI-AL measured, the rate at which the index is rising is accelerating. This acceleration is visible when the period 2004 January to 2013 August is divided into five phases. These are represented by the circles in the illustrated chart (the main image above), the phases 2004 Jan to 2005 Dec, 2006 Jan to 2007 Nov, 2007 Dec to 2009 Oct, 2009 Nov to 2011 Sep and 2011 Oct to 2013 Aug). These points (five for each state) are plotted against not the ordinary scale of the CPI-AL but against a range of point increases in the CPI-AL. Hence this shows the rise in the CPI-AL and the more recent speed of that rise.
Sauce, ketchup and Indian tomato prices

They say the prices are cyclical, like they are for all vegetables. They say India grows enough vegetables to provide for our growing population and we have enough surplus to export. Well, if that’s so, then why does a kilo of tomatoes today cost fifty rupees? A few phone calls and visits to local grocery shops (not the supermarkets) confirmed that today, in Bangalore, Mumbai and New Delhi, tomatoes sold for Rs 45 to Rs 55 a kilo.

Sauce and ketchup every which way you look in sizes from 90 grams to 1 kg – that’s where India’s tomatoes are going.
Why are our staple vegetables experiencing such price spikes so frequently (the big onion panic is not two months old)? Here’s what the official numbers look like, from the Ministry of Agriculture, Directorate of Economics and Statistics, Retail Price Monitoring System. This collects prices of food staples every week from 87 urban centres in all 35 states and union territories, and I have used this quite comprehensive data series to examine the ups and downs of the price of the tomato.
The chart above illustrates the price of a kilo of tomatoes in India’s urban centres between the first week of July 2010 and the third week of October 2013 – tomato prices have been recorded for 59 urban centres over 173 weeks. To simplify what is otherwise a maniacal tangle of individual threads (see chart below) I have taken a median price, and urban price at the 80th and 20th percentiles, which together describe the overall movement and variation well enough. The cycles are indeed visible – they are roughly 40 weeks long.

Tomato prices recorded for 59 urban centres over 173 weeks.
But the cycle changed from the first week of April 2013, when the prices of a kilo of tomato rose more steeply than before. And from the first week of August 2013, tomato prices have settled at a new plateau significantly higher than at any time in the last three years.
Why has this happened? The growth of the processed foods industry is the main cause – this industry sector has for the last three years grown (in value) at around 15% per year, which is greater than the GDP ‘growth’ and greater than the growth in value recorded for agriculture in general. For tomatoes, this means that every quarter, more tomatoes exit the stream of tomatoes that would otherwise go to home kitchens and instead enter factories, there to be turned into sauce, ketchup, purée and powder (which you find as flavouring even in those awful noodle ‘tastemaker’ sachets and cup noodle containers). These thousands of tons will become available as packaged and processed goods (the better to accompany the acres of super-fattening industrial pizza being baked every day) and this means less, per capita or per household, is available as primary produce that can be used in kitchens at home.
One curious question for international grains traders
The International Grains Council’s charts for all grains and major traded grains. What is the connection between these charts and local food price inflation?
The International Grains Council’s monthly Grain Market Report for 2013 October finds its grains and oilseeds index down 16% from the same period a year ago because, as the IGC has said, “the supply outlook for grains, rice and oilseeds markets is significantly more comfortable than last year”.

Recent export prices for major traded grains. Source: IGC
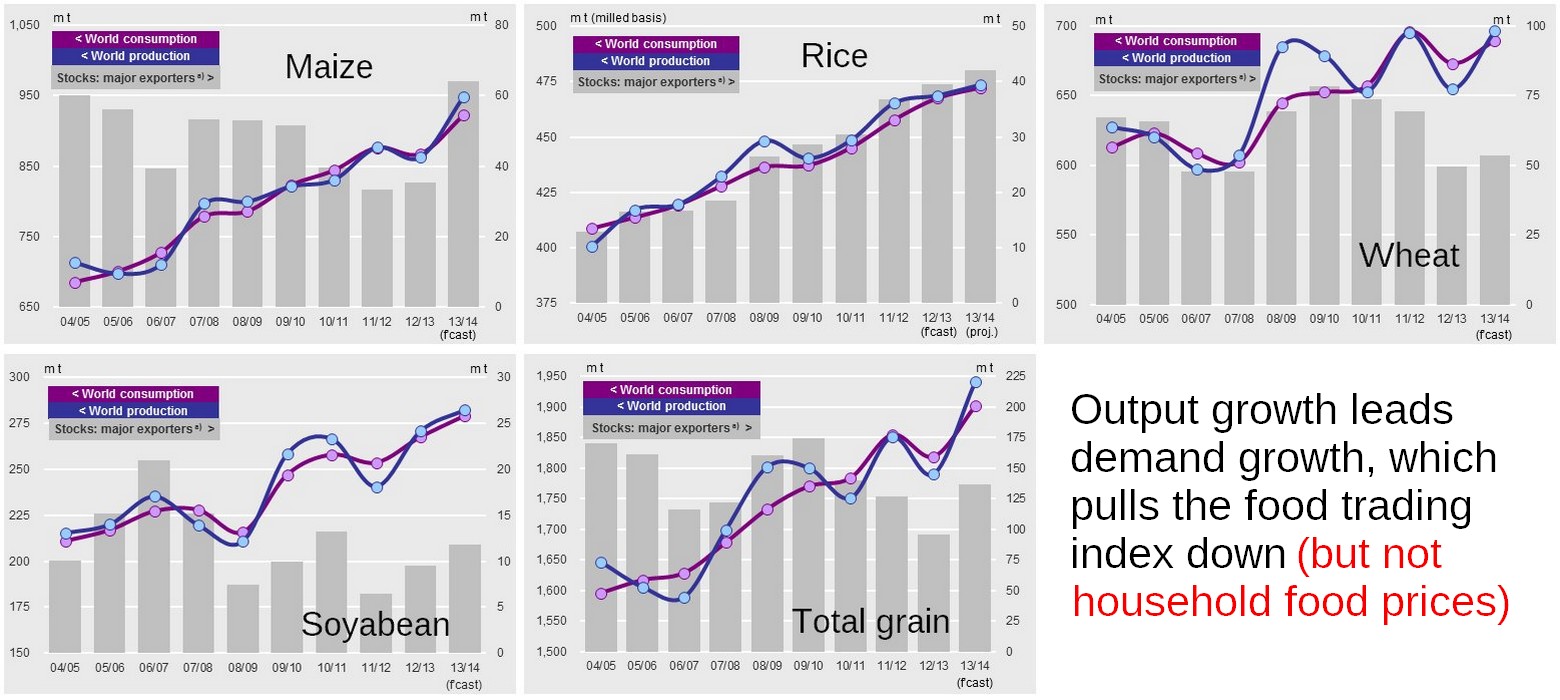
The IGC has raised the output forecast for total grains (wheat and coarse grains) in 2013-14 by 10 million tons this month, to 1,940 mt, up 8% from the same period last year. Demand is also expected to rise, but by a slower 5% compared to the same period a year ago. The IGC has said that “inventories are seen recovering by 39 mt to a four-year high at the end of 2013-14”.
The global trade forecast is raised by 3 mt, to 273 mt, which will exceed the previous record in 2010-11. Hence the question ought to be: if the international trade in grain collects, moves and processes just under 15% of the world’s total grain, why do prices in our local wholesale and retail food markets get influenced so much by what the IGC’s monthly report describes? This is not an answer you can expect given to you with honesty and concern from your local administration, much less from the food retail and industrial agriculture representatives.
For the major grains, here are the IGC summaries. Wheat output is expected to rise by 6% in 2013-14 from the level of a year ago and closing stocks are seen up by 7 mt, at 182mt, although this would still be below the level seen in 2011-12. The 2013-14 forecast for the global maize harvest has been raised by 5 mt this month to a record 948mt, and stocks are seen recovering to a 13-year high of 152 mt.
Rice is considered by the IGC to be “mixed, with good export demand and weather-related crop worries underpinning values in Vietnam, but Thailand’s prices fell further on limited buying interest and pressure from heavy intervention reserves”. Rice output for 2013-14 is forecast up 1% from a year ago, with world ending stocks expected to rise for a ninth consecutive year. (The IGC’s report for 2013 October is available here.)
Indexing food prices the FAO way

The FAO food price index for 2013 October which includes the calculation and measurement changes. Spot the differences? I can’t.
Why has the Food and Agriculture Organisation (FAO) changed the way it calculates the monthly FAO Food Price Index? But hold on, let us scrutinise first what the FAO Food Price Index is for 2013 October.
The FAO has said: “The FAO Food Price Index rose slightly in October, averaging 205.8 points. This was 2.7 points, or 1.3% above September, but still 11 points, or 5.3% below its October 2012 value. The slight increase was largely driven by a surge in sugar prices, although prices of the other commodity groups were also up.”

The usual blue pair.
In substance, this sort of commentary for the FAO monthly food price index barely differs from the standard tedious template, in tone and tenor, that FAO has applied throughout 2013. The tone has been, as we begin to close 2013, that food prices have not moved very much through the year, and the tenor has been that food price volatility is being reined in.
Based on the evidence provided by real prices I experience in India – real markets (or bazaars or mandis) in which real vendors sell actual produce to real household buyers – I have no idea what the FAO Food Price Index is talking about. Nor do tens of millions of urban and rural households all over the world when they try and correlate the numbers of the FAO index to what they must confront every time they make a food purchase.
This is because of what the FAO Food Price Index measures which, I wearily point out, is a criticism levelled time and again. Why call it a food price index when it is in fact a food exporters’ and importers’ price indication?

Impressive equations, but where’s the connection with the local markets you and me buy our veggies from?
Now, with a change in its calculations, the FAO index includes the following 23 commodities: wheat (10 price quotations monitored and reported by the International Grains Council), maize (1 quotation) and rice (16 quotations) for cereals; butter, whole milk powder, skimmed milk powder (2 quotations for each) and cheese (1 quotation) for the dairy group; poultry (13 quotations), pig (6 quotations), bovine (7 quotations) and ovine (1 quotation) for the meat dairy group; sugar (1 quotation); the oils group consists of one oil price quotation for soybean, sunflower, rapeseed, groundnut, cotton seed, copra, palm kernel, palm, linseed and castor. This construction, thus, includes the use of 73 price series.
The FAO has said: “The Index, which is a measure of the monthly change in international prices of five major food commodity groups (including 73 price quotations), has undergone some changes in the way it is calculated, although the new approach did not significantly alter the values in the series.” (See the Food Outlook released in 2013 November.)
Perhaps. We will not know for another few months. If a change was needed that made sense to consuming households, then FAO should have ensured the index reflected what households pay for the food the buy in the markets near their homes. If the FAO must serve multiple audiences, then it must devise food price indexes for these audiences separately (but the IGC already serves the food traders, and FAO’s own Agricultural Market Information System already serves the policymakers and the major international blocs).
India’s food price inflation is no surprise
Reports on the new evidence of price increases for staple foods in India have evoked surprise and a variety of responses from economic analysts. Reuters has reported that inflation “unexpectedly hit a seven-month high in September as food prices climbed” because the “wholesale price index (WPI), the main inflation measure, climbed to 6.46 percent last month”.

If tomato, potato and onion show the behaviour of all vegetable prices, the new food inflation peak is no surprise at all.
Supplied by the views from the financial markets and industry sources, and supported by a government position of prices and food supply that is predictably optimistic, reports in the mass media claim that inflation is expected to come down in coming months.
Business Standard reported that “the simultaneous rise in WPI- and CPI-based inflation in September can be explained by the lag effect of rising food prices on consumer prices. The newspaper quoted a chief economist of the State Bank of India who said: “Consumer price inflation is correcting the huge gap we had witnessed in food items at retail and wholesale levels in the previous months.” It also quoted an economist with a credit rating agency, CARE Ratings, who said the divergent trend in July and August could be explained by the fact that retailers couldn’t increase prices at the same rate as wholesalers and, therefore, had to squeeze their margins.
The Hindu reported that “headline inflation unexpectedly touched a seven-month of 6.46 in September riding on the back of a whopping 323 per cent increase in price of onion followed by all round hike in price of other fruit and vegetable items”. This newspaper said that the latest data released by the government on Monday put the food inflation at 18.40 per cent in September over the same month last year.
The three pairs of charts you see here describe the prices of tomato, potato and onion as recorded by the retail price monitoring cell of the Department of Consumer Affairs, Ministry of Food and Consumer Affairs, Government of India. The cell collects retail prices of 22 food items from 57 urban centres, and these are the monthly averages from 2009 January to 2013 September.
The monitoring cell does not collect the prices of common vegetables (such as brinjal, cauliflower or pumpkin) or leafy green vegetables, hence these will serve as indicative proxies that describe the movements of vegetable prices in Indian urban retail food markets over the measured period.
The charts with the full set of price trendlines for all 57 centres are dense to look at, hence I have simplified them to three trendlines each: an average, the price of the 80th percentile of the centres, and the price of the 20th percentile of the centres. Doing so helps preserve the overall trend over the period measured and also helps more clearly display the difference between the upper and lower bounds of the variation in price amongst the set of urban centres.
The tomato chart shows periodic spikes from mid-2010 however the peak of 2013 July dwarfs all others. The potato chart shows the previous peak being during 2009 October, but in terms of the persistence of high price the period from 2012 August till the present is the longest since 2009 January. The onion chart records the previous spike during 2010 December to 2011 January, which has been topped during the current spike that began in 2013 June.
The tale of the charts is that even for items that go through cycles, like vegetables, the overall trend is upwards and this upward trend is at a rate faster than the wage increases for agricultural and rural labour, for those working in the informal urban sector, and is a rate that is only partly offset by any dearness allowance (if that old mechanism is still used).
For all those who are said to be knowledgeable on food price and the causes of inflation – the ministries of agriculture, of commerce and of food processing, the industry associations, the bankers and financiers, the food and retail industry – the current food inflation spike is no surprise at all, it was expected as the festival season has begun. The difference now is that with every such season, the new base price for our food staples is pushed to higher level, further squeezing household budgets that are not reinforced by bonuses.
The cereals, oils and sugars have been far more predictable in their rise for the last five years. Their price rise in inevitable given the growth of the retail food industry, the processed foods industry, the rise in the price of fuel, and the rise on the prices of fertiliser and pesticides. Just as the so-called ‘carrying cost’ of PDS foodgrain is derided as being inefficient by the private sector, they too bear a carrying cost – inventory of processed food and inventory of primary crop used for such food – which is concealed in the price the consumer pays.
It is only local food networks that choose organic crops, supply locally and insulate themselves from the organised food profiteers that can free themselves from the pain of India’s steadily rising food price inflation.
If global food indices are descending, why are local food prices rising?

The trends of ten international food commodity indices from 2006 onwards.
The main chart plots the course of the Food and Agriculture Organisation (FAO) Food Price Index and nine other international food price indices. These are FAO’s cereals index, the International Monetary Fund’s (IMF) food index, the International Grains Council (IGC) wheat index, the IGC’s rice index, the UN Conference on Trade and Development’s (UNCTAD) two wheat indices, Unctad’s rice index, the World Bank’s (WB) food index and WB’s grains index.

Consumer price index trends 2006 to 2013 for five South Asian countries

The familiar FAO blue pair for 2013 August
On the main chart, after 2008 December four stages are marked. The first stage is 2008 December to 2010 July, when the indices describe a plateau but which is very much higher than where they were through 2006. The second stage is 2010 July to 2011 April, which corresponds to the second global food price rise and when all these indices rose in concert. The third stage is 2011 April to 2012 September when they all declined to another plateau which nonetheless is higher overall than the last one (stage one), but which rose steeply for a short while towards the end of the stage. The fourth stage is still current, from 2012 June, which is seeing a gradual decline in all the indices to the point they were in 2011 August-September.
I have appended to the main chart the counterpoint of the consumer price indexes from South Asian countries – Nepal, Sri Lanka, Bangladesh, Pakistan and India. The question that follows, when reading the main chart with ten indices and the CPI chart for South Asia, is why the CPI trends do not follow the international grains trends. One of the major factors (which charting this data cannot reveal, as the FAO Food Price Index does not) is the extent to which the industrialisation of prmary crops sets the retail price in the markets of Colombo or Chittagong or Karachi or Mumbai or Kathmandu. Primary crop – that is, cereals, pulses, fruit and vegetable, milk and dairy – is being moved internally, processed, packaged, moved again, retailed in modern convenience stores to a much greater degree than was the case a decade ago. Those costs lie outside what the FAO-IGC-IMF-Unctad-WB indices can describe. But we need to urgently – within these countries and as a group – share methods to gauge and monitor these costs and document their impacts on households.
