Posts Tagged ‘energy’
It’s time to permanently retire the UN climate circus

‘World on Fire’ by Spiros Derveniotis, courtesy Cartoon Movement, http://www.cartoonmovement.com/p/2486
This year’s ritual of talking about climate and talking about the effects of changing climates has begun. This is the 21st year that this is being done, and in none of the previous 20 years have the talkers achieved any worthwhile goal. They will not this year either, although much money will be spent on slick and colourful messages to convince the publics of 196 countries otherwise.
On 1 June the Bonn Climate Change Conference June 2015 began. The actors at this conference are mainly from the same cast that has played these roles for 20 years. They have been replaced here and there, and overall the main cast and supporting casts have grown in number – I think this growth in the number of climate negotiators and climate experts matches the growth rate of parts per million of carbon dioxide in our atmosphere, there may be a correlation that can inspire a new discipline of research.
These conferences are expensive, for thousands of people are involved. Most of these people profess to be concerned about climate change and its effects and most of these people maintain curriculum vitaes that are tomes designed to awe and impress, usually with the purpose of securing well-paid consultancies or academic tenureships or some such similar lucrative sinecures. It is an industry, this negotiating climate change, whose own rates of growth are about as steep as the number of those, in the OECD countries, who fall into debt. As before, there may be interesting correlations to note.

The soundbite, big data and cool vector graphics world of UNFCCC climate negotiation pretense has gone on for far too long.
The publics of the 196 countries that are constrained to send emissaries and observers and negotiators to these colossal jamborees have been lied to for 20 years quite successfully, and this 21st year we will see the lies repeated and presented all wrapped up in new tinsel. Many of these countries – from south-eastern and central Europe, from small island states in the Pacific and Indian oceans, from the Caribbean, from South America and from South-East Asia – pay for the useless privilege of sending representatives to attend this annual round of sophisticated tomfoolery. It is money down the drain for them.
The United Nations Framework Convention on Climate Change (UNFCCC) under whose aegis most of these jamborees are held, and in whose august name most of the hollow but portentous pronouncements are ritually made, is an organisation that is over the hill, round the bend and up the wall. It represents today nothing that is in the interest of the public and it represents today almost everything that is in the interest of the corporate plutocracy, whether global or regional or national.
A 21st edition of annual obfuscation by the UNFCCC and its crony institutions.
Unembarrassed by its own hopelessly prodigal existence, the UNFCCC lines up ‘technical expert meetings’ month after month to produce suitably technical papers that would fill libraries, if they were printed. It arranges conclaves in expensive locales (all sponsored naturally) to gauge ‘mitigation ambition of countries through multilateral assessment’. It commissions extensive reviews of the adequacy of countries’ agreed goals to keep the global average temperature from rising beyond 2°C above pre-industrial levels and the abundantly-qualified authors of these reviews (which read very much like the reviews of 2014, 2013, 2012 and so on) self-importantly inform us that “the world is not yet on track to achieve the long-term global goal, but successful mitigation policies are known and must be scaled up urgently”, just as their predecessors did 20 years ago.
The main UNFCCC cast and its supporting cast (of thousands, but these thousands alas do not form the geographic representation that the United Nations system pretends to) spend days together at preparatory conferences and meetings, and pre-preparatory conferences and meetings, and agenda-setting conferences and meetings, and theme-outlining conferences and meetings, all year round. From somewhere within this flurry of busy nothingness they announce (perhaps on the days before the solstices and following the equinoxes) that new breakthroughs have been made in the negotiating text and that consensus is nigh.
This has gone on far too long. Twenty years ago, when this great obfuscation began, there were some 1.83 billion children (under 14 years old) in the world. Today they are at ages where they are finishing primary school, have begun working (many of them in informal, insecure, hazardous jobs whose paltry wages keep families alive) and a few are completing university degrees. Some of this 1.83 billion may have an interest in what climate is and why it changes but for them, the techno-financial labyrinths invented by the UNFCCC and its comfortable nest of crony institutions offer no enlightenment. For those young women and men, the cancerous industry of climate change negotiations has done nothing to ensure, during their lifetimes till now, any reduction in the exploitation and use of materials whose first and primary effect is to degrade the nature upon which we all depend. [This article has also been posted on the India Climate Portal.]
No Shri Javadekar, India won’t gamble with carbon

Coal will account for much of India’s energy for another generation. How does the BJP calculate its ‘value’ at international climate talks? Image: PTI/Deccan Chronicle
There is a message New Delhi’s top bureaucrats must listen to and understand, for it is they who advise the ministers. The message has to do with climate change and India’s responsibilities, within our country and outside it. This is the substance of the message:
1. The Bharatiya Janata Party-led National Democratic Alliance government must stop treating the factors that contribute to climate change as commodities that can be bartered or traded. This has been the attitude of this government since it was formed in May 2014 – an attitude that says, in sum, ‘we will pursue whatever GDP goals we like and never mind the climate cost’, and that if such a pursuit is not to the liking of the Western industrialised world, India must be compensated.
2. Rising GDP is not the measure of a country and it is not the measure of India and Bharat. The consequences of pursuing rising GDP (which does not mean better overall incomes or better standards of living) have been plain to see for the better part of 25 years since the process of liberalisation began. Some of these consequences are visible in the form of a degraded natural environment, cities choked in pollution, the rapid rise of non-communicable diseases, the economic displacement of large rural populations. All these consequences have dimensions that deepen the impacts of climate change within our country.
3. There are no ‘terms of trade’ concerning climate change and its factors. There is no deal to jockey for in climate negotiations between a narrow and outdated idea of GDP-centred ‘development’ and monetary compensation. The government of India is not a broking agency to bet a carbon-intensive future for India against the willingness of Western countries to pay in order to halt such a future. This is not a carbon casino and the NDA-BJP government must immediately stop behaving as if it is.
 The environment minister, Prakash Javadekar, has twice in March 2015 said exactly this: we will go ahead and pollute all we like in the pursuit of our GDP dream – but if you (world) prefer us not to, give us lots of money as compensation. Such an attitude and such statements are to be condemned. That Javadekar has made such a statement is bad enough, but I find it deeply worrying that a statement like this may reflect a view within the NDA-BJP government that all levers of governance are in fact monetary ones that can be bet, like commodities can, against political positions at home and abroad. If so, this is a very serious error being made by the central government and its advisers.
Javadekar has most recently made this stand clear in an interview with a foreign news agency. In this interview (which was published on 26 March 2015), Javadekar is reported to have said: “The world has to decide what they want. Every climate action has a cost.” Worse still, Javadekar said India’s government is considering the presentation of a deal – one set of commitments based on internal funding to control emissions, and a second set, with deeper emissions cuts, funded by foreign money.
Earlier in March, during the Fifteenth Session of the African Ministerial Conference on Environment (in Cairo, Egypt), Javadekar had said: “There has to be equitable sharing of the carbon space. The developed world which has occupied large carbon space today must vacate the space to accommodate developing and emerging economies.” He also said: “The right to development has to be respected while collectively moving towards greener growth trajectory.”
Such statements are by themselves alarming. If they also represent a more widespread view within the Indian government that the consequences of the country following a ‘development’ path can be parleyed into large sums of money, then it indicates a much more serious problem. The UNFCCC-led climate change negotiations are infirm, riddled with contradictions, a hotbed of international politics and are manipulated by finance and technology lobbies.
 It remains on paper an inter-governmental arrangement and it is one that India is a part of and party to. Under such circumstances, our country must do all it can to uphold moral action and thinking that is grounded in social and environmental justice. The so-called Annex 1 countries have all failed to do so, and instead have used the UNFCCC and all its associated mechanisms as tools to further industry and foreign policy interests.
It is not in India’s nature and it is not in India’s character to to the same, but Javadekar’s statement and the government of India’s approach – now made visible by this statement – threatens to place it in the same group of countries. This is a crass misrepresentation of India. According to the available data, India in 2013 emitted 2,407 million tons of CO2 (the third largest emitter behind the USA and China). In our South Asian region, this is 8.9 times the combined emissions of our eight neighbours (Pakistan, 165; Bangladesh, 65; Sri Lanka, 15; Myanmar, 10; Afghanistan, 9.4; Nepal, 4.3; Maldives, 1.3; Bhutan, 0.7).
When we speak internationally of being responsible we must first be responsible at home and to our neighbours. Javadekar’s is an irresponsible statement, and is grossly so. Future emissions are not and must never be treated as or suggested as being a futures commodity that can attract a money premium. Nor is it a bargaining chip in a carbon casino world. The government of India must clearly and plainly retract these statements immediately.
Note – according to the UNFCCC documentation, “India communicated that it will endeavour to reduce the emissions intensity of its GDP by 20-25 per cent by 2020 compared with the 2005 level. It added that emissions from the agriculture sector would not form part of the assessment of its emissions intensity.”
“India stated that the proposed domestic actions are voluntary in nature and will not have a legally binding character. It added that these actions will be implemented in accordance with the provisions of relevant national legislation and policies, as well as the principles and provisions of the Convention.”
The fuel favour year for India
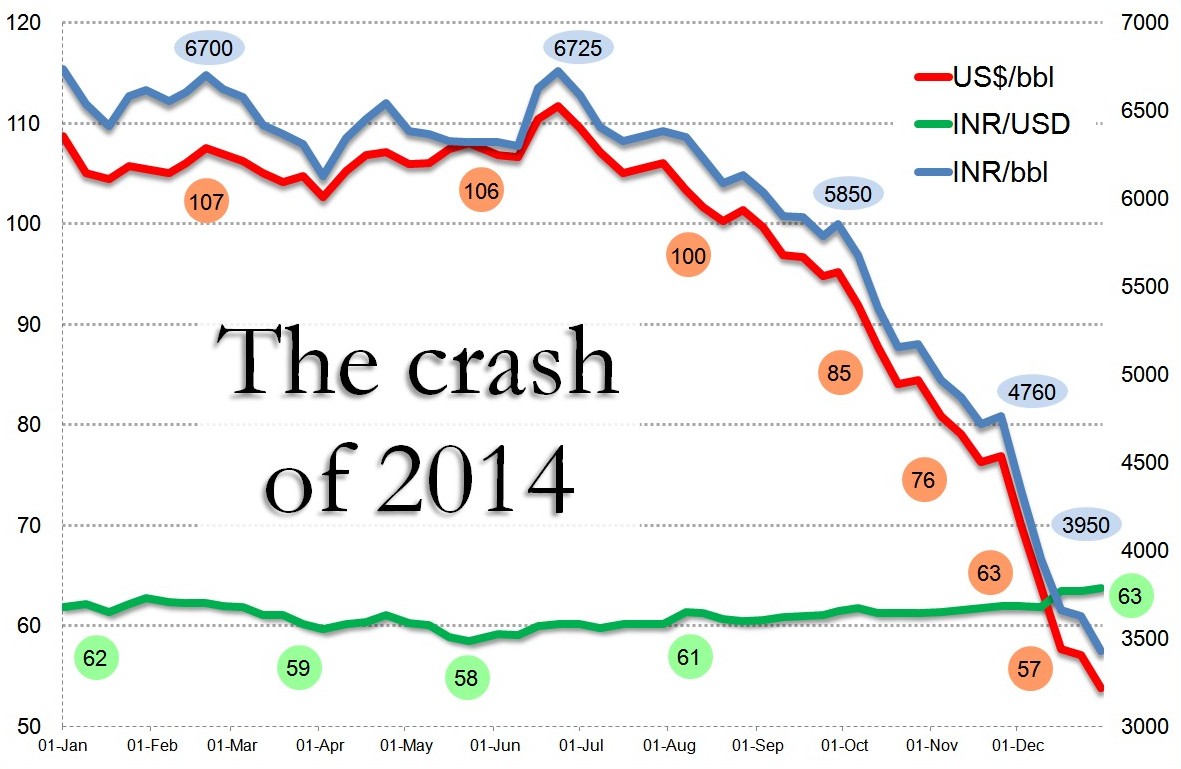
The US$ per barrel (red line) and the rupee-dollar exchange rate (green line) are plotted to the left scale. The rupee per barrel (blue line) is plotted to the right scale. I have used data from the Petroleum Planning and Analysis Cell of the Ministry of Petroleum and Natural Gas – the global crude oil price of the ‘Indian Basket’ in US$ per barrel.
It started in early August, the extraordinary slide in petroleum prices. Until then, the international crude oil price of the ‘Indian Basket’ (of crude oils, as it is called) had swung between US$ 110 and US$ 105 per barrel.
The rupee-dollar exchange rate, and the effective price of a barrel of crude oil in Indian rupees (both measures also appear on this chart), fluctuated but little for most of the first half of 2014. In early June 2014, the rupee-dollar rate turned around from 59 and has been rising since, while in early July the rupee price per barrel descended from its plateau of 6,300-6,600 and has been dropping since.
The cost of oil-derived energy has had a number of effects upon our everyday lives in the second half of 2014. It has helped the new NDA-BJP government during its first year by dampening overall inflation (the consumer price index) and particularly food price inflation. This has been particularly fortunate for the NDA-BJP government as the deficient monsoon of 2014 has meant a drop in the production of food staples, and market forces being what they are, food price inflation especially would have been well into the 13%-14% range (last quarter 2014 compared with last quarter 2013).
 Galloping consumer price inflation has been forestalled by the plunging price of crude oil. The data I have used for this startling chart is courtesy the Petroleum Planning and Analysis Cell (PPAC) of the Ministry of Petroleum and Natural Gas which computes several times a week the “global crude oil price of Indian Basket in US$ per bbl” – which means the average price we pay per barrel for the various kinds of crude oil we purchase.
A barrel of crude oil is 42 gallons or around 159 litres. This crude, when refined, is turned into diesel, petrol, lighter fuels, feedstock for the manufacture of various plastics, and other products. Typically, up to 70% of the oil we buy is converted into diesel and petrol (and carbon from all those exhaust pipes). Also typically, a barrel of crude oil (which is an extremely dense form of packaged energy) contains around 5.8 million BTUs (British thermal units). More familiar to us is the kilowatt hour (or kWh) and these 5.8 million BTUs are about 1,700 kWh – at current national average rates of per head electricity consumption this is worth about 26 months of electricity!
From early August till the end of December the price we paid for a barrel of crude has dropped from around US$ 103 to US$ 54 and correspondingly (factoring in the rupee-dollar exchange rate) the rupee price of a barrel of crude has dropped from 6,300 to around 3,500. Put another way, the INR 6,300 we paid in early August for 5.8 million BTU could buy, in mid-October 7.1 million BTU and by end-December, 10.4 million BTU.
Most of us tend not to be profligate with energy (our electricity comes mainly from the burning of coal, but the sale of automobiles has continued at a steady pace, or so the industry tells us). The question is whether this windfall energy saving (in terms of petroleum energy units per rupee) has been well used by the sector that can spread the benefit the most – agriculture and food. It will take another three months to judge, and we will keep a wary eye for the next quarter on the Indian crude oil Basket.
India’s giant megawatt trap

A panel of charts that show India’s energy consumption, imports, and dependence on fossil fuel.
Electricity as fundamental right and energy convenience as the basis of ‘development’ in Bharat and in India. If this is what Piyush Goyal means when he says his government is “is committed to ensure affordable 24×7 power” then it will come as yet another commitment that supports energy provision and consumption as the basis for determining the well-being of Bharat-vaasis and Indians (the UPA’s Bharat Nirman was the predecessor). But the Minister of State (Independent Charge) for Power, Coal and New and Renewable Energy cannot, using such a promise, ignore the very serious questions about the kind of ‘development’ being pursued by the NDA-BJP government and its environmental and social ramifications. [This article is also posted at the India Climate Portal.]
Goyal has said, via press conferences and meetings with the media, that the NDA government is committed to ensuring affordable power at all times (’24 x 7′ is the expression he used, which must be banished from use as being a violent idea – like nature our lives follow cycles of work and rest and ’24 x 7′ violently destroys that cycle). Goyal has promised, pending the taking of a series of steps his ministry has outlined, that such a round the clock provision of electric power will be extended to “all homes, industrial and commercial establishments” and that there will be “adequate power for farms within five years”.

The summary of India’s power generation capacity, by type and by region. Source for data: Central Electricity Authority
Some of the very serious questions we raise immediately pertain to what Goyal – with the help of senior ministry officials and advisers – has said. The NDA-BJP government will spend Rs 75,600 crore to (1) supply electricity through separate feeders for agricultural and rural domestic consumption, said Goyal, which will be used to provide round the clock power to rural households; and (2) on an “integrated power development initiative” which involves strengthening sub-transmission and distribution systems in urban areas. This is part of the “transformative change” the ministry has assured us is for the better. Goyal and his officials see as a sign of positive transformation that coal-based electricity generation from June to August 2014 grew by nearly 21 per cent (compared with the same months in 2013), that coal production is 9% higher in August 2014 compared with August 2013, and that Coal India (the largest coal producer company in the world which digs out 8 of every 10 tons of coal mined in India) is going to buy 250 more goods rakes (they will cost Rs 5,000 crore) so that more coal can be moved to our coal-burning power plants.
 We must question the profligacy that the Goyal team is advancing in the name of round the clock, reliable and affordable electricity to all. To do so is akin to electoral promises that are populist in nature – and which appeal to the desire in rural and urban residents alike for better living conditions – and which are entirely blind to the environmental, health, financial and behavioural aspects attached to going ahead with such actions. In less than a fortnight, prime minister Narendra Modi (accompanied by a few others) will attend the United Nations Climate Summit 2014. Whether or not this summit, like many before it, forces governments to stop talking and instead act at home on tackling anthropogenic climate change is not the point. What is of concern to us is what India’s representatives will say about their commitment to reduce the cumulative impact of India’s ‘development’, with climate change being a part of that commitment. [Please see the full article on this page.]
The meat map of the world
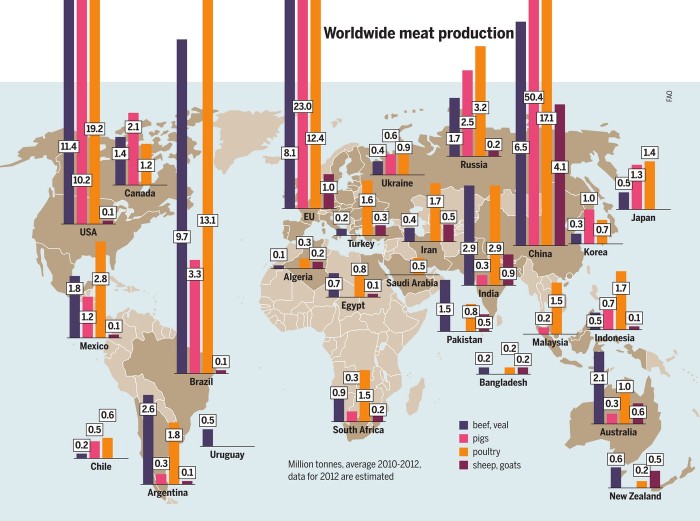
The economies in Asia and elsewhere will see around 80 percent of the growth in the meat sector by 2022. The biggest growth will be in China and India because of huge demand from their new middle classes. Chart: Meat Atlas
Industrial livestock production in Europe and the USA began when feed, energy and land were inexpensive, the ‘Meat Atlas’ has explained, which is published jointly by the Heinrich Böll Foundation and Friends of the Earth Europe.
Nowadays, feed, energy and land have all become scarce and costs have gone up. As a result, total meat production is growing less quickly than before. “The market is growing only for pigs and poultry. Both species utilise feed well and can be kept in a confined space. This means that they can be used to supply the insatiable demand for cheap meat,” the Meat Atlas has said.
By 2022, almost half the additional meat consumed will come from poultry. Beef production, on the other hand, is scarcely growing. The USA remains the world’s largest beef producer, but the meat industry describes the situation there as dramatic. For 2013, it expects a fall of 4-6 per cent compared to 2012 and predicts the decline to continue in 2014. In other traditional producing regions including Brazil, Canada and Europe, production is stagnating or falling.
 “The star of the day is India, thanks to its buffalo meat production, which nearly doubled between 2010 and 2013. India is forcing its way onto the world market, where 25 percent of the beef is in fact now buffalo meat from the subcontinent,” said the Atlas (see this news report from 2013 June).
According to the US Department of Agriculture, India became the world’s biggest exporter of beef in 2012 – going ahead of Brazil. Buffaloes are considered inexpensive to keep by the USDA (what benchmark do they use for husbandry I wonder). Thus the USDA considers buffalo meat a dollar a kilo cheaper than beef from Western cattle. In addition, the Meat Atlas has reminded us, the Indian government has invested heavily in abattoirs. Moreover, faced with the high price of feed, Brazilian cattle-raisers are switching to growing soybeans which has presented an opportunity for Indian buffalo-meat exporters.
China and India differ markedly in their food consumption patterns. In India, a vegetarian lifestyle has deep cultural and social roots. In surveys cited by the Atlas, a quarter or more of all Indians say they are vegetarian. “But the number of meat-eaters is growing. Since the economic boom (my note: usual dreadful mis-labelling here; it is no ‘boom’ but a slow destruction) in the early 1990s, a broad middle class that aspires to a Western lifestyle has emerged (true enough). This includes eating meat which has become a status symbol among parts of the population. Nevertheless, meat consumption in India is still small – per person it is less than one-tenth of the amount consumed in China.”
 The costs borne by the environment because of the world’s fondness for animal-origin protein are probably the biggest, but are still difficult to calculate despite some 30 years of following advances in environmental economics. This helps us estimate some damage to nature in monetary terms. It covers the costs of factory farming that do not appear on industry balance sheets, such as money saved by keeping the animals in appalling conditions. The burden upon nature also grows by over-fertilisation caused by spreading manure and slurry on the land and applying fertilisers to grow fodder maize and other crops.
Sizing up the deadly and fake nuclear renaissance
Two excellent resources to point to for those who want to shut down reactors and bury nuclear power once and for all. The first is ‘Quietly Into Disaster – A Plea For Survival’, a film well worth your while. It deals with facts and topics concerning nuclear fission: the damage done to health and environment, nuclear waste and politics, renewable energies, reactor safety, the serious implications of a nuclear accident and public resistance.
The second is the World Nuclear Industry Status Report 2013 which provides a global overview of the history, the current status and the trends of nuclear power programmes worldwide. It examines nuclear reactor units in operation and under construction, includes an update on nuclear economics as well as an overview of the status, on-site and off-site, of the challenges triggered by the Fukushima disaster.

Nuclear Power Reactor Grid Connections and Shutdowns, 1956–2013. Source: World Nuclear Industry Status Report 2013 / IAEA-PRIS, MSC, 2013
The Report has noted that:
“For various reasons in many nations, the nuclear industry cannot tell the truth about its progress, its promise or its perils. Its backers in government and in academia do no better.”
“During the rise and fall of the bubble formerly known as “the nuclear renaissance” in the U.S. many of their tools have been on full display. Academic and governmental studies a decade ago understated the likely cost of new reactors and overstated their potential contribution to fighting climate change.”
“Where the authors introduce judgment, they explain what they have done and why. The Report has a track record stretching back years. It is much better than the embarrassing exuberances of the International Atomic Energy Agency, the World Nuclear Association or the pronouncements of most national governments.”
“In short, the nuclear renaissance has always consisted entirely of the number of reactors whose excess costs governments were prepared to make mandatory for either customers or taxpayers.”
The common good of India and the Planning Commission of today
 The Deputy Chairman of the Planning Commission, Government of India, has in an interview starkly emphasised the priorities for the current government, priorities which accord no importance whatsoever to the principles governing the work of the Planning Commission itself, principles that were clearly enunciated 63 years ago.
In the interview, titled ‘We can’t get on a 9% growth path if we underprice energy’, Montek Singh Ahluwalia, the Deputy Chairman of the Planning Commission, has been asked a series of questions by reporters of one of India’s English-language business and financial dailies.
Q 1. Of late, there have been moves to correct the under-pricing of energy. Is the government moving the way the 12th five-year Plan document wanted it to? [In this question the reporters provide as a given the idea of ‘under pricing’ of energy in India.]
A 1. If prices do not reflect the real cost of energy, why will anyone invest in energy-saving equipment? Also, if prices don’t reflect the marginal cost of supply, which is imports, why will people invest to produce energy? Our problem is that energy is generally under-priced. Diesel, cooking gas and kerosene are under-priced.
We need a complete rethink on energy prices and align close to world prices. We cannot close the gap at one go but phased adjustment is necessary. Nobody likes to pay a higher price but we must recognise that we cannot expect to get on a nine per cent growth path if we don’t align its energy prices with global prices.
Ahluwalia wants nine per cent annual growth of the Indian economy at all costs. That these costs are social, ecological and ruinous are of no concern to him. He is only interested in the ‘marginal cost of supply’ of energy, of investment to produce more energy. He has ignored the data from the Government of India (in fact the Central Electricity Authority) which shows that the transmission and distribution losses between power generation and consumption are still 24% averaged for the last five years. Ahluwalia is either ignorant of or unmindful of the steep rise in the ‘fuel and light’ sub-index of the All-India Consumer Price Index. Over a single month, from November to December 2012, the fuel and light index for agricultural labourers rose from 760 to 769 and for rural labourers it rose from 758 to 766. What will this index reach for these two groups if Ahluwalia (and his supporters) has his way? What fearful cost will be exacted from India’s agricultural and rural labourers when our prices are ‘aligned’ with global prices? For whose benefit is this alignment being promoted by Ahluwalia?
Q 2. What should be the direction in coal?
A 2. We need some difficult decisions there. In the Plan, we have clearly said the nationalisation of coal needs to be reconsidered. There is no economic logic in keeping the private sector out of coal if it is allowed in petroleum and natural gas. Why do we allow the private sector in these areas? Because we want to bring in as much investment as possible into energy production and we want new technology.
Ahluwalia is (a) contemptuous about the Planning Commission’s own ‘Low Carbon Strategies for Inclusive Growth’ direction paper, in which the adoption of renewable energy sources and the steady reduction of coal and oil as primary fuels is advocated, and (b) conceals the truth that in India there are 455 new coal-powered generation plants under construction or have been approved (who needs clearances from the castrated Ministry of Environment and Forests? who needs environment impact assessments, pesky things that hinder our gallop towards GDP growth rates? who needs public consultation when the Prime Minister’s Office itself rams through projects?) or being planned. These 455 coal burners are to generate some 519,396 megawatts. For whom? For those agricultural and rural labourers struggling to buy kerosene for a stove on which to cook their evening meals? No, for the urban middle classes who are being gathered together by India’s unspoken social engineering project that herds the income-privileged into towns and cities.
Many of these new coal burners are private sector already. I mention coal burning power plants currently under construction in three states only to overturn Ahluwalia’s economy with the truth. In Andhra Pradesh who are VSF Projects, Thermal Powertech Corporation, Indu Projects Limited and Dr. RKP Power? In Bihar who are AES India, Mirach Power Pvt. Ltd, Triton Energy Ltd and Buxar Bijlee Company? In Maharashtra who are Indiabulls Power, Ideal Energy Projects, Mantri Power and Lenexis Energy? Who are they if not private?
The World Resources Institute’s Global Coal Risk Assessment explained: “International public financial institutions are important and long-time contributors to the coal industry. Since 1994, multilateral development banks (MDBs) and industrialised countries’ export credit agencies (ECAs) have helped finance 88 new and expanded coal plants in developing countries, as well as projects in Europe. Together, MDBs and ECAs have provided more than US$37 billion in direct and indirect financial support for new coal-fired power plants worldwide. The World Bank has actually increased lending for fossil fuel projects and coal plants in recent years. An analysis by the Environmental Defense Fund concludes that the lending strategies of MDBs and ECAs in the energy sector do not sufficiently consider the environmental harm wrought by fossil fuel projects.”
Q 3. There is a talk of a food security law and there is a five-year map for the fiscal deficit. Can both go hand in hand?
A 3. Yes. If food security is a critical programme, we can give it top priority and cut something else. We have talked about reducing subsidies from 2.4 per cent of GDP to 1.5 per cent. We have not said there should be no subsidy. There is enough room in the limit indicated to accommodate a sensible food security bill but it does mean other subsidies will have to be cut more.
Why is Ahluwalia using an ‘if’ to misqualify the need for the Republic of India to provide affordable food to its citizens? What is meant by “cut something else”? Who is to decide what essential programmes need support if not the citizens of India through their representatives and through public participation and consultation? Ahluwalia’s are the statements of a ruling regime that has abandoned every last shadow of democratic practice.
To turn to the Planning Commission itself. In its description of its functions the Planning Commission has provided this information:
“The 1950 resolution setting up the Planning Commission outlined its functions as to: (a) Make an assessment of the material, capital and human resources of the country, including technical personnel, and investigate the possibilities of augmenting such of these resources as are found to be deficient in relation to the nation’s requirement; (b) Formulate a Plan for the most effective and balanced utilisation of country’s resources; (c) On a determination of priorities, define the stages in which the Plan should be carried out and propose the allocation of resources for the due completion of each stage;” [There are four other functions mentioned.]
Worryingly, what has been omitted is far more significant. What do these functions relate to? The answer can be found in the introduction to the First Five Year Plan:
“The Planning Commission was set up in March, 1950 by a Resolution of the Government of India which defined the scope of its work in the following terms:
‘The Constitution of India has guaranteed certain Fundamental Rights to the citizens of India and enunciated certain Directive Principles of State Policy, in particular, that the State shall strive to promote the welfare of the people by securing and protecting as effectively as it may a social order in which justice, social, economic and political, shall inform all the institutions of the national life, and shall direct its policy towards securing, among other things—
that the citizens, men and women equally, have the right to an adequate means of livelihood;
that the ownership and control of the material resources of the community are so distributed as best to subserve the common good; and
that the operation of the economic system does not result in the concentration of wealth and means of production to the common detriment.’ “
Citizens, welfare, people, social and economic and political justice, control by the people of the material resources of India, the common good, no concentration of wealth, no means of production to the common detriment. These have now been hidden by the Planning Commission of today, shamefully. And it is from that base act of concealment that Montek Singh Ahluwalia speaks.
Are you getting your 65 units of electricity a month?

India’s biggest cities by population and their appetite for watts. The population figures (supplied by the Central Electricity Authority in 2010) are lower than those listed in Census 2011. Hence for 2013, the peak, total sales and per capita purchase will be greater.
If the kilowatt hour a day is the ‘lifeline’ unit of energy that a person in India is entitled to, then the purchase of an average, nationally, of 65 units of electricity a month could mean that in this 66th year after Independence, the Republic of India is able to provide sufficient energy equitably to its citizens.
Not so. The average is utterly misleading and here is why. In the city of Bengaluru (or Bangalore) the average per capita units per month purchased is 89.5, in Kolkata (the Calcutta of yore) it is 92.5, in Mumbai (the Bombay of ditto) it is 93.4, in Hyderabad it is 108.6, in Chennai (Madras, once upon a time) it is 113.8 and in New Delhi (the source of sub-continental malpractice on an imperial scale) it is 169.7. That is the tale of the table above, the data excellently provided by the Prayas Energy Group of Pune (yes also once more familiarly called Poona) and released in a working paper entitled ‘Electricity in Megacities’.
But of course there is aggressive electricity consumption in those cities of India which are sans (for now) the ‘mega’ prefix. Their inhabitants make every effort to, first, move into the category of household which has four or more rooms (not bedrooms, rooms), and in which is installed an air-conditioner, a water heater (geyser, we would call those hot water boilers, in an earlier era), a washing machine (for those cities that hadn’t a ‘dhobi ghat’ or two), a refrigerator (remember when ‘frost free’ first came along?), a television set naturally, all the better to dull ones wits with, four or five tube-lights, an equal number of ceiling or pedestal fans, a few compact fluorescent bulbs, and a computer (with a multi-megabit connection at the very least).

Total electricity consumed has more than doubled in ten years. So much for low carbon growth, let alone energy equity between rural and urban, between poor and privileged.
And where will we find these over-watted households? There is, as Census 2011 has informed us, Ahmedabad with 6.5 million inhabitants, Pune with 5.0 million, Surat 4.5 million, Jaipur 3.0 million, Kanpur 2.9 million, Lucknow 2.9 million, Nagpur 2.4 million, Ghaziabad 2.3 million, Indore 2.1 million, Coimbatore 2.1 million, Kochi 2.1 million, Patna 2.0 million and Kozhikode 2.0 million. Not ‘mega’ but in no way minor.
How many units a month of electricity are the households in these cities consuming? The monthly average of the five ‘mega’ cities (New Delhi excluded because of its off-the-charts greed for watts) is around 100 units per capita per month. Outside the ‘mega’ cities ranks and excepting a few others, electricity is not a round-the-clock service. Hence my estimate is, on the conservative side, that the 100 units per head per month can be scaled down to 80 (which is still a good fraction above the so-called national average of 65). We then have for the next 13 cities whose populations are above 2 million (Census 2011) a combined household purchase of 3.22 billion units a month! That is more than the Indian Railways consumed on its electrified railway lines in the entire year of 1985-86!
Countries awash with carbon

Even though countries are burning unprecedented amounts of oil and gas, the estimates of how much is left continue to grow, thanks to high prices and new technologies that have enabled companies to find and extract new resources. Graphic: Nature
More than ever, these charts by Nature, the science magazine, show, countries are providing themselves with energy from (what they continue to believe are abundant supplies of) fossil fuels.
“Renewables such as solar and wind power are growing faster than any other source of energy, but are barely making a dent in fossil-fuel consumption,” said the Nature text accompanying these graphics. “The scale of the challenge will only grow as the expanding global population requires more energy. This tour of global and regional energy trends makes clear that even with aggressive action to reduce energy consumption and curb emissions, fossil fuels will be around for a very long time.”

A decade ago, it was the tar sands of Canada and Venezuela. More recently, hydraulic-fracturing technologies have opened up oil and gas resources in the United States. Across the globe, proven oil and gas reserves are 60% higher today than they were in 1991. Graphic: Nature
Nature also has a clickable guide to the world’s energy use which you can use to find out which countries were using up Earth’s resources fastest in 2011 (they’ve charted the numbers from the BP Statistical Review of World Energy 2012) and which ones were taking a lead on renewable energy.

At current consumption rates, fossil fuel reserves would last for about 60 years — and that could be extended by new discoveries and unconventional deposits. Coal reserves have not increased in size, but the supply will last for at least a century at current rates of consumption. Graphic: Nature
Energy, climate, growth, China, India – the World Energy Outlook 2012

Inputs to the power sector to generate electricity accounted for 38% of global primary energy use in 2010, the single largest element of primary demand. In the New Policies Scenario, this share rises to 42% in 2035. Demand for electricity is pushed higher by population and economic growth, and by households and industries switching from traditional biomass, coal, oil and natural gas to electricity. The fuel mix within the power sector changes considerably, with low- and zero-carbon technologies becoming increasingly important. Graphic: IEA, WEO-2012
 In four parts, 18 chapters, four annexes, illustrated by around 300 figures, the chapters supported by about 100 tables, a separate set of data upon which scenarios rest, the World Energy Outlook 2012 of the International Energy Agency (IEA) is a 690-page behemoth. I can only sketch its merest outline here, and in a fleeting way touch upon the knowledge and information it contains.
Drawing on the latest data and policy developments, the World Energy Outlook 2012 presents projections of energy trends through to 2035 and insights into what they mean for energy security, the environment and economic development. “Over the Outlook period, the interaction of many different factors will drive the evolution of energy markets,” said the WEO-2012. “As outcomes are hard to predict with accuracy, the report presents several different scenarios, which are differentiated primarily by their underlying assumptions about government policies.” We are told that the starting year of the scenarios is 2010, the latest year for which comprehensive historical energy data for all countries were available. What are these four scenarios?

Based on preliminary estimates, energy-related CO2 emissions reached a record 31.2 gigatonnes (Gt) in 2011, representing by far the largest source (around 60%) of global greenhouse-gas emissions (measured on a CO2-equivalent basis). Emissions continue to rise in the New Policies Scenario, putting the world on a path that is consistent with a long-term average global temperature increase of 3.6 °C above levels that prevailed at the start of the industrial era. Chart: IEA, WEO-2012
1. The New Policies Scenario – the report’s central scenario – takes into account broad policy commitments and plans that have already been implemented to address energy-related challenges as well as those that have been announced, even where the specific measures to implement these commitments have yet to be introduced.
2. To illustrate the outcome of our current course, if unchanged, the Current Policies Scenario embodies the effects of only those government policies and measures that had been enacted or adopted by mid-2012.
3. The basis of the 450 Scenario is different. Rather than being a projection based on past trends, modified by known policy actions, it deliberately selects a plausible energy pathway. The pathway chosen is consistent with actions having around a 50% chance of meeting the goal of limiting the global increase in average temperature to two degrees Celsius (2°C) in the long term, compared with pre-industrial levels.
4. The Efficient World Scenario has been developed especially for the World Energy Outlook 2012 (WEO-2012). It enables us to quantify the implications for the economy, the environment and energy security of a major step change in energy efficiency.

In the New Policies Scenario, global energy intensity (energy demand per unit of GDP) falls by 1.8% per year between 2010 and 2035. Between 2010 and 2035, energy intensity declines by an average of 37% and 49% in OECD and non-OECD countries respectively. Yet average energy intensity in non-OCED countries in 2035 of 0.16 tonnes of oil equivalent (toe) per thousand dollars of GDP is still more than twice the OECD level. Chart: IEA, WEO-2012
I have extracted five important messages from the summary which are connected to the subjects you find in this blog – food and agriculture, consumer behaviour and its impacts on our lives, the uses that scarce energy is put to, the uses that scarce water is put to, the ways in which governments and societies (very different, these two) view food, energy and water.
Five key messages:
“Energy efficiency can keep the door to 2°C open for just a bit longer.” Successive editions of the World Energy Outlook have shown that the climate goal of limiting warming to 2°C is becoming more difficult and more costly with each year that passes. The 450 Scenario examines the actions necessary to achieve this goal and finds that almost four-fifths of the CO2 emissions allowable by 2035 are already locked-in by existing power plants, factories, buildings, etc. No more than one-third of proven reserves of fossil fuels can be consumed prior to 2050 if the world is to achieve the 2°C goal.
“Will coal remain a fuel of choice?” Coal has met nearly half of the rise in global energy demand over the last decade, growing faster even than total renewables. Whether coal demand carries on rising strongly or changes course will depend on the strength of policy measures that favour lower-emissions energy sources, the deployment of more efficient coal-burning technologies and, especially important in the longer term, CCS. The policy decisions carrying the most weight for the global coal balance will be taken in Beijing and New Delhi – China and India account for almost three-quarters of projected non-OECD coal demand growth (OECD coal use declines).

China makes a major contribution to the increase in primary demand for all fuels: oil (54%), coal (49%), natural gas (27%), nuclear power (57%) and renewables (14%). Its reliance on coal declines from 66% of the country’s primary energy use in 2010 to 51% in 2035. Energy use in India, which recently overtook Russia to become the world’s third-largest energy consumer, more than doubles over the Outlook period. India makes the second-largest contribution to the increase in global demand after China. Chart: IEA, WEO-2012
“If nuclear falls back, what takes its place?” The anticipated role of nuclear power has been scaled back as countries have reviewed policies in the wake of the 2011 accident at the Fukushima Daiichi nuclear power station. Japan and France have recently joined the countries with intentions to reduce their use of nuclear power, while its competitiveness in the United States and Canada is being challenged by relatively cheap natural gas. The report’s projections for growth in installed nuclear capacity are lower than in last year’s Outlook and, while nuclear output still grows in absolute terms (driven by expanded generation in China, Korea, India and Russia), its share in the global electricity mix falls slightly over time.
“A continuing focus on the goal of universal energy access.” Despite progress in the past year, nearly 1.3 billion people remain without access to electricity and 2.6 billion do not have access to clean cooking facilities. Ten countries – four in developing Asia and six in sub-Saharan Africa – account for two-thirds of those people without electricity and just three countries – India, China and Bangladesh – account for more than half of those without clean cooking facilities. The report presents an Energy Development Index (EDI) for 80 countries, to aid policy makers in tracking progress towards providing modern energy access. The EDI is a composite index that measures a country’s energy development at the household and community level.
“Energy is becoming a thirstier resource.” Water needs for energy production are set to grow at twice the rate of energy demand. The report estimates that water withdrawals for energy production in 2010 were 583 billion cubic metres (bcm). Of that, water consumption – the volume withdrawn but not returned to its source – was 66 bcm. The projected rise in water consumption of 85% over the period to 2035 reflects a move towards more water-intensive power generation and expanding output of biofuels.
Such is the barest glimpse of the WEO-2012. There are a number of aspects of the Outlook which deserve more scrutiny with a view to learning energy use and misuse, and this will be expanded upon in the weeks ahead.
