Posts Tagged ‘monsoon’
Misreading monsoon

As usual in May, there is a welter of forecasts and opinions about the monsoon, the great majority of which are short on understanding and shorter on elementary science. The media – newspapers, television news channels, their websites – are to blame for spreading half-baked forecasts and wild prognoses. Not one of the numerous newspapers and TV channels, whatever the language they employ, bother to provide their reporters a basic grounding in the climatological system that gives us our monsoon.
In the first place, the India Meteorological Department (IMD) issues an operational forecast for the south-west monsoon season (June to September) rainfall for the country as a whole in two stages. The first stage forecast is issued in April and the second stage forecast is issued in June. These forecasts are prepared using state-of-the-art Statistical Ensemble Forecasting system (SEFS) and using the dynamical coupled Ocean-Atmosphere global Climate Forecasting System (CFS) model developed under Monsoon Mission of the Ministry of Earth Sciences.
On 15 April 2019 the IMD issued its first stage forecast. Based on our own in-field observations from the west coast, from the patterns of maximum termperature bands and variations in the lower and central peninsular region, from the sea surface temperatures in the Arabian Sea particular its southerly reaches and ditto for the Bay of Bengal, and from the wind patterns that can be experienced at various places in the peninsula and on the west coast, we find the IMD first stage forecast to be reliable.

It is the chronically ignorant media – which over the last few years has displayed a tendency to prefer some so-called private sector weather forecasters instead of what the Ministry of Earth Sciences provides – found irresponsibly claiming that the monsoon of 2019 will be ‘deficient’ and will also begin ‘late’. Neither of these terms is sensible in any way, and we take no satisfaction in noting that only a media that is insensible to planetary and mesoscale events like climate, will employ such insensible terms in reporting that is meant to educate and benefit the public.
IMD’s April forecast used the following five predictors: 1. the Sea Surface Temperature (SST) Gradient between North Atlantic and North Pacific (in December and January), 2. the Equatorial South Indian Ocean SST (in February), 3. the East Asia Mean Sea Level Pressure (in February and March), 4. North-west Europe Land Surface Air Temperature (in January), and 5. Equatorial Pacific Warm Water Volume (in February and March).
There are two forecasts the IMD makes. One is based on the Monsoon Mission CFS Model, which considers global atmospheric and oceanic initial conditions up to March 2019 and use 47 ensemble members (or kinds of data). The forecast based on the CFS model suggests that the monsoon rainfall during the 2019 monsoon season (June to September) averaged over the country as a whole is likely to be 94% ± 5% of the Long Period Average (LPA).
The second is the forecast based on the operational Statistical Ensemble Forecasting system (SEFS). This shows that quantitatively, the monsoon seasonal rainfall is likely to be 96% of the Long Period Average (LPA) with a model error of ± 5%. The SEFS comprises five category probability forecasts for the June to September rainfall over the country as a whole:

Overall therefore the IMD forecast is for the 2019 monsoon rainfall to be near normal. The IMD has already pointed out (which can be seen from the probabilities of the categories given in the table) that there is only a small chance for the monsoon rainfall to be above normal or excess. In view of the weather events and the climatological changes that we are seeing from day to day in May, ascribing a ‘lateness’ to the monsoon is absurd. Monsoon conditions already exist in and over the Indian land mass and in and over the great watery zones extending southwards from latitude 8 degrees North – and that is why we will find rain-bearing clouds crossing the south-western coastline in the first week of June 2019.
Three views of monsoon 2018

The India Meteorological Department (IMD) on 16 April had issued its first long range forecast for the 2018 South-West Monsoon season, which the IMD has historically taken to be 1 June to 30 September. The IMD had said that the “monsoon seasonal rainfall is likely to be 97% of the Long Period Average with a model error of ± 5%”. The IMD had also said that its forecast “suggests maximum probability for normal monsoon rainfall (96%-104% of the long period average) and low probability for deficient rainfall during the season”.
In early June, the IMD will issue its second long range forecast for the 2018 monsoon. Until then, I have studied three of the more reliable (in my view) international multi-model ensemble forecasts for the monsoon. What are ensemble forecasts? Each consists of several separate forecasts (some ensembles use 50) forecasts made by the same computer model – these are run on super-computers such as the High Performance Computer System of the Ministry of Earth Sciences (one is at the Indian Institute of Tropical Meteorology in Pune with 4.0 petaflops capacity and the other at the National Centre for Medium Range Weather Forecasting in Noida with 2.8 petaflops capacity).

The monsoon 2018 forecast for three-month blocks of the Multi-Model Ensemble (MME), USA National Centers for Environmental Prediction
The separate forecasts that make up one ensemble are all activated from the same starting time. The starting conditions for each differ from each other to account as far as possible for the staggering number of climatological, atmospheric, terrestrial and oceanographic variables that affect and influence our monsoon. The differences between these ensemble members tend to grow as the forecast travels two, three, four and more months ahead of the present.
I have considered the ensemble forecasts for the 2018 monsoon of the European Centre for Medium-Range Weather Forecast (ECMWF), the NOAA Climate Prediction Center and the Multi-Model Ensemble (MME) of the USA National Centers for Environmental Prediction. In this order, I find that the ECMWF forecast is somewhat pessimistic, the NOAA CPC is largely neutral and the MME is optimistic. The forecasting periods are in blocks of three months.
I have considered the ensemble forecasts for the 2018 monsoon of the Multi-Model Ensemble (MME) of the USA National Centers for Environmental Prediction, the NOAA Climate Prediction Center and the European Centre for Medium-Range Weather Forecast (ECMWF). In this order, I find that the MME is optimistic, the NOAA CPC is largely neutral and the ECMWF forecast is somewhat pessimistic.
Here are the details:
(1) The MME forecast, precipitation anomalies relative to the period 1993-2016, based on initial conditions calculated at the beginning of May 2018.
June July August (JJA) – west coast and Konkan, coastal Andhra Pradesh and Odisha, West Bengal, part of the North-East, the entire upper, middle and lower Gangetic region (Uttarakhand, Himachal, Uttar Pradesh, Bihar, Jharkhand), Madhya Pradesh, Chhattisgarh, Maharashtra and Telengana to have up to +1 mm/day. Rest of India other than Gujarat (-0.5 mm/day) normal.
July August September (JAS) – Gujarat to have up to -1 mm/day, Rajasthan up to -0.5 mm/day, Sikkim, Brahmaputra valley and Arunachal Pradesh up to -0.5 mm/day. Himachal Pradesh and Uttarakhand up to +0.5 mm/day, Madhya Pradesh, Odisha, Chhattisgarh, Jharkhand and West Bengal up to +0.5 mm/day. Andhra Pradesh and Tamil Nadu up to -0.5 mm/day.
August September October (ASO) – Gujarat up to -0.5 mm/day. Tamil Nadu up to -1 mm/day. Kerala and adjacent Karnataka up to -0.5 mm/day. Madhya Pradesh, Chhattisgarh, Odisha, West Bengal up to +1 mm/day. Tripura, Mizoram, Manipur, Nagaland, Uttarakhand, Himachal Pradesh up to +0.5 mm/day
September October November (SON) – Tamil Nadu, Kerala and adjacent Karnataka up to -1 mm/day. Maharashtra, Madhya Pradesh, Chhattisgarh, Odisha, West Bengal, Himachal Pradesh and Uttarakhand up to +0.5 mm/day.

(2) The NOAA CPC forecast, seasonal precipitation anomalies using initial conditions of 30 April 2018 to 9 May 2018.
May June July (MJJ) – for most of India a normal reading (+0.5 to -0.5 mm/day fluctuation) and for the west coastal, Konkan, Kerala, south Tamil Nadu and coastal Andhra Pradesh areas variation of up to +1.5 mm/day.
June July August (JJA) – for most of India a normal reading (+0.5 to -0.5 mm/day fluctuation).
July August September (JAS) – normal for most of India. Some areas in the central Deccan plateau, on the west coast and east coast variation of up to -1 mm/day.
 (3) The ECMWF forecast, mean precipitation anomaly based on climate period data of 1993-2016 and initial conditions as on 1 May 2018.
June July August (JJA) – all of the southern peninsula and part of the Deccan region (Kerala, Tamil Nadu, Karnataka, Andhra Pradesh, part of Telengana) up to -100 mm for the period. West Bengal, Bihar, Jharkhand, Uttar Pradesh up to +100 mm for the period.
July August September (JAS) – all of the southern peninsula and the Deccan region – Kerala, Tamil Nadu, Karnataka, Andhra Pradesh, part of Telengana and Maharashtra up to -100 mm for the period.
August September October (ASO) – Maharashtra, Telegana, Andhra Pradesh and Karnataka up to -100 mm for the period.
September October November (SON) – Central and western India, eastern states and entire Gangetic region up to -50 mm for the period.
The drying of the Deccan

This panel of 12 images shows the change that takes place in a region of the Deccan. Each image shows what is called a Normalised Difference Vegetation Index (NDVI) for the region. This is a rolling eight-day series computed daily using imagery from the Terra/MODIS system and viewed using the NASA Worldview website.
The colours (green and brown shades, whitish shades) show us the vegetation health with deep green being better than light green, dark brown being better than light brown. The index is also used to signal where areas are beginning to experience arid and water-scarce conditions.
 The region is the west-central Deccan – the Karnataka Plateau – corresponds to the Vijayapur (Bijapur) district of north Karnataka with parts of Bagalkot district and is part of the central Indian semi-arid bioclimatic zone.
The pictures in the panel show the vegetation extent and health (NDVI) calculated on that day for an eight-day period. Each picture is a fortnight apart, and this series starts on 4 November 2016 (bottom right) and ends on 7 April 2017 (top left). The retreat of the green is seen clearly from one fortnight to the next.
Of interest in this region is the Almatti dam and reservoir, in the Krishna river basin, which is visible in the lower centre of each picture. On 13 April there was no water in Almatti, which has a full capacity of 3.105 billion cubic metres (bcm). For the week ending 30 March it had 0.015 bcm of water, the week ending 6 April 0.001 bcm.
 For the week ending 3 November 2016, which is when the panel of pictures begins, Almatti had 2.588 bcm of water. The reservoir water runs a hydroelectric power plant, of 240 MW, and which needs flowing water to turn the turbines.
When the reservoir is full, the hydel plant produces about 175 million units of electricity. But on 13 March the Central Electricity Authority’s daily report showed that Almatti could produce only 3.02 million units. On 10 April, this had plunged to 0.04 million units, but the hydel plant had produced no power since 1 April.
A winning kharif season for Bharat

A rural road being repaired in the Konkan.
With only just over a week remaining of the usual June to September monsoon season, the first estimates of crop production for the year 2016-17 have brought welcome news to Bharat.
The estimates are the first in the normal series of four which are released through the crop year 2016-17 by the Ministry of Agriculture ad Farmers’ Welfare. What they show is important for two reasons.
First, they come against doubts that have been raised in various quarters since the last week of August about the adequacy of the 2016 summer monsoon. Second, they show that the effects of the drought and drought-like conditions that gripped a number of districts of Bharat from March to May have not affected crop production. These are important messages both.
Coming to the numbers released, the production of kharif rice is on target: 93.88 million tons (mt) against the target of 93 mt. The production of ‘coarse cereals’ (which includes jowar, bajra, maize, ragi, small millets and barley) is on target: 32.46 mt against the target of 32.50 mt. The production of pulses (which includes tur or arhar, gram, urad, moong, and other kharif pulses) above target: 8.7 mt against the target of 7.25 mt.
The overall outlook then for kharif season production is foodgrains of about 135 mt (final amounts will be subject to revision as states confirm their data).
Dimensions of drought
We lack not at all for experience with drought, yet have not grown used to treating water with the greatest of care. Drought does not strike in the manner a hailstorm does, yet our administrations seem unable to read the signals. Citizens and panchayats alike can contribute to our managing droughts better, provided all are willing to change both perception and behaviour.
 It is because drought is such a forbidding condition for any state to fall into that it becomes at once threatening and emotive. Its every symptom becomes a new trial for a drought-afflicted population and simultaneously a likely indictment of the administration, whether local or regional. Food and crop, water and health, wages and relief: this is the short list for which action is demanded by a population concerned for those in the drought-affected districts and blocks.
The administration is bound to answer, as it is likewise bound to plan, prepare, anticipate and act. But where the interrogation of a government for its tardiness in providing immediate relief comes quickly, a consideration of the many factors that contribute to the set of conditions we call drought is done rarely, and scarcely at all when there is no drought. It is the gap between these two activities that has characterised most public criticism of the role of administration today when there is drought.
For farmers and district or block-level administrators alike, drought is a normal and recurrent feature of climate in the dryland regions of India. It occurs in nearly all climatic zones – our long recording history of droughts and floods in particular show that whereas in eastern India (West Bengal, Odisha and Bihar) a drought occurs once in every five years, in Gujarat, East Rajasthan and western Uttar Pradesh the frequency is once in three years. Although the characteristics of what we call drought varies significantly from one meteorological sub-division to another, and indeed from one agro-ecological zone to another, the drought condition arises from a deficiency in precipitation that persists long enough to produce a serious hydrological imbalance.
 Drought is a complex phenomenon. There is first a need to distinguish between meteorological and agricultural droughts. A meteorological drought is a period of prolonged dry weather conditions due to below normal rainfall. An agricultural drought refers to the impact caused by precipitation shortages, temperature anomalies that lead to increased evapotranspiration by crops and vegetation, and consequently to a shortage of the water content in the soil, all being factors that adversely affect crop production and soil moisture. The National Commission on Agriculture has defined an agricultural drought differently for the kharif (monsoon cropping season, July to October) and rabi (winter cropping season, October to March).
What the country has witnessed during March and April is an agricultural drought, brought about by the high temperatures which raised mean and maximum temperatures into the heat-wave band. This we have witnessed in Odisha, Telengana, Vidarbha, Marathwada, north interior Karnataka, Rayalaseema, coastal Andhra Pradesh, Tamil Nadu, eastern Madhya Pradesh and Chhattisgarh, Jharkhand and West Bengal.
[You can read the rest of this article at the Financial Chronicle. Page pdfs are here (2MB) and here (1.8MB).]
Food, climate, culture, crops and government

The weekly standardised precipitation index of the India Meteorological Department (IMD) which is a running four-week average. This series shows the advancing dryness of districts in south India.
In November 2015, the Departmentally Related Standing Committee on Agriculture of the Lok Sabha, Parliament of India, invited suggestions and submissions on the subject “Comprehensive Agriculture Research based on Geographical Condition and Impact of Climatic Changes to ensure Food Security in the Country”.
The Committee called for inputs on issues such as the need to evolve new varieties of crops which can withstand climatic fluctuation; requirement to evolve improved methods of irrigation; the need to popularise consumption of crops/fruits which can provide better nutrition; the need to develop indigenous varieties of cattle that can withstand extreme climatic stress; the need to develop a system for precision horticulture and protected cultivation; diversification of species of fish to enhance production from the fisheries sector; the need to strengthen the agriculture extension system; and means to focus on agriculture education.
I prepared a submission as my outline response, titled “Aspects of cultivation, provision of food, and use of land in Bharat today and a generation hence”. The outline I provided includes several issues of current urgency and connects them to scenarios that are very likely to emerge within a generation. My intention is to signal the kinds of pathways to preparation that government (central and state) may consider. It is also meant to flag important cultural and social considerations that lie before us, and to emphasise that economic and quantitative measurements alone are not equipped to provide us holistic guidance.
The outline comprises three sections.
(A) The economic framework of the agriculture and food sector and its imperatives.
(B) The social, ecological, and resource nature of crop cultivation, considering factors that influence it.
(C) Methods, pathways and alternatives possible to adopt with a view to being inter-generationally responsible.
In view of the current climatic conditions – heat waves in the central and eastern regions of the country, stored water in our major reservoirs which are at or near ten-year lows – I reproduce here the section on the economic framework of the agriculture and food sector and its imperatives. The full submission can be found here [pdf, 125kb].
This framework considers the agriculture and food sector, including primary agricultural production recorded, the inputs and products of industry based on agricultural raw material (primary crop whether foodgrain, horticulture, spices, plantation, ruminants and marine, oilseeds, fibres), agribusiness (processing in all its forms), supply chains connecting farmers and farmer producer organisations to primary crop aggregators, buyers, merchants, stockists, traders, consumers, as well as associated service providers. This approach is based on the connection between agricultural production and demand from buyers, processers and consumers along what is called the supply chain.

Water storage quantities in the 91 major reservoirs in the first week of April 2016. Blue bars are each reservoir’s full storage capacity (in billion cubic metres, bcm) and orange bars are the current storage at the time. Data from the Central Water Commission, Government of India.
If this framework is considered as existing in Bharat to a significant degree which influences crop cultivation choices, the income of cultivating household, the employment generation potential of associated service providers, then several sets of questions require answers:
* Concerning economic well-being and poverty reduction: what role does agricultural development need to play in promoting economic stability in rural (and peri-urban) regions thereby contributing to poverty reduction and how can the agrifood sector best contribute to jobs and higher incomes for the rural poor?
* Concerning food security: what role can agricultural and agro-industry development play in ensuring rural and urban communities have reliable access to sufficient, culturally appropriate and safe food?
* Concerning the sustainability of food producing systems: how should agriculture and agro-industry be regulated in a participatory manner so as to ensure that methods of production do not overshoot or endanger in any way (ecological or social) conservative carrying capacity thresholds especially in the contexts of climate change and resource scarcity?
When viewed according to the administrative and policy view that has prevailed in Bharat over the last two generations, there is a correlation between agricultural productivity growth and poverty reduction and this is the relationship the macro- economic and policy calculations have been based upon. Our central annual agricultural (and allied services) annual and five-year plan budget and state annual and five-year plan budgets have employed such calculations since the 1950s, when central planning began.
However the choices that remain open to us are considerably fewer now than was the case two generations (and more) ago when the conventional economic framework of the agriculture and food sector took shape.
A monsoon to look forward to

These gentlemen would welcome any news of a normal monsoon for 2016. Rice farmers in north Goa. Photo: Rahul Goswami
The Indian summer monsoon in 2016, for the months of June to September, will be normal to better-than-normal in almost all of the 36 meteorological sub-divisions. This is my reading of the seasonal climatic predictions provided by five different sources. Should the conditions that presage such a rainy season continue to be favourable, a normal monsoon coming after two years of faltering rain, and with drought conditions have set into many districts, will be a vast relief.
My outlook for the June to September 2016 monsoon period is based on an initial study of the three-monthly and seasonal predictions which are in the public domain, from the following agencies: The Climate Prediction and Monitoring Group of the India Meteorological Department (IMD), Ministry of Earth Sciences, Government of India; the Climate Forecast System Version 2 (CFSv2) by the Climate Prediction Center of the National Centers for Environmental Prediction (NCEP), USA; regionalised Multi-Model Ensemble (NMME) forecasts from the Climate Prediction Center which are based on models of the NOAA and NASA; and the Meteorological ‘Met’ Office of Britain which is a World Meteorological Organisation climate research centre.

Components of a typical model ‘ensemble’
Combining the indications from this early set of forecasts we see that after typical monsoon conditions have set in over southern and peninsular India, the June and July rainfall (quantities) should be normal for June with an increase in average rainfall for July (in the southern peninsula, the west coast, north-eastern states and the north India mountainous states). The five models currently also point to the August and September period recording above normal rainfall over most of India, and normal rainfall in central India.
Predictive capabilities have increased over the last few years, and a number of national weather service agencies collaborate to share data and expertise on climate models. There is much collaboration particularly for the Asian monsoons – our Indian summer monsoon and the monsoon of south-east Asia – because of the implications for the volumes of food crops, in particular rice and wheat, that are likely to be sown and then harvested.
The climatic prediction models whose forecasting products I examined make their predictions for 90-day periods (such as May, June and July together) based on conditions observed and calculated for a given month (January, February and March so far). Later in April and then twice again in May I will consolidate and expand the scope of this initial prognosis – which is of a normal to above normal monsoon – as the forecasts are updated. [This is also posted at India Climate Portal.]
Water and a district in Maharashtra

In this panel of maps the relationship between the district of Parbhani (in the Marathwada region of Maharashtra) and water is graphically depicted over time. The blue squares are water bodies, as seen by a satellite equipped to do so. The intensity of the blue colour denotes how much water is standing in that coloured square by volume – the deeper the blue, the more the water.
Water bodies consist of all surface water bodies and these are: reservoirs, irrigation tanks, lakes, ponds, and rivers or streams. There will be variation in the spatial dimensions of these water bodies depending on how much rainfall the district has recorded, and how the collected water has been used during the season and year. In addition to these surface water bodies, there are other areas representing water surface that may appear, such as due to flood inundations, depressions in flood plains, standing water in rice crop areas during transplantation stages. Other than medium and large reservoirs, these water features are treated as seasonal and some may exist for only a few weeks.
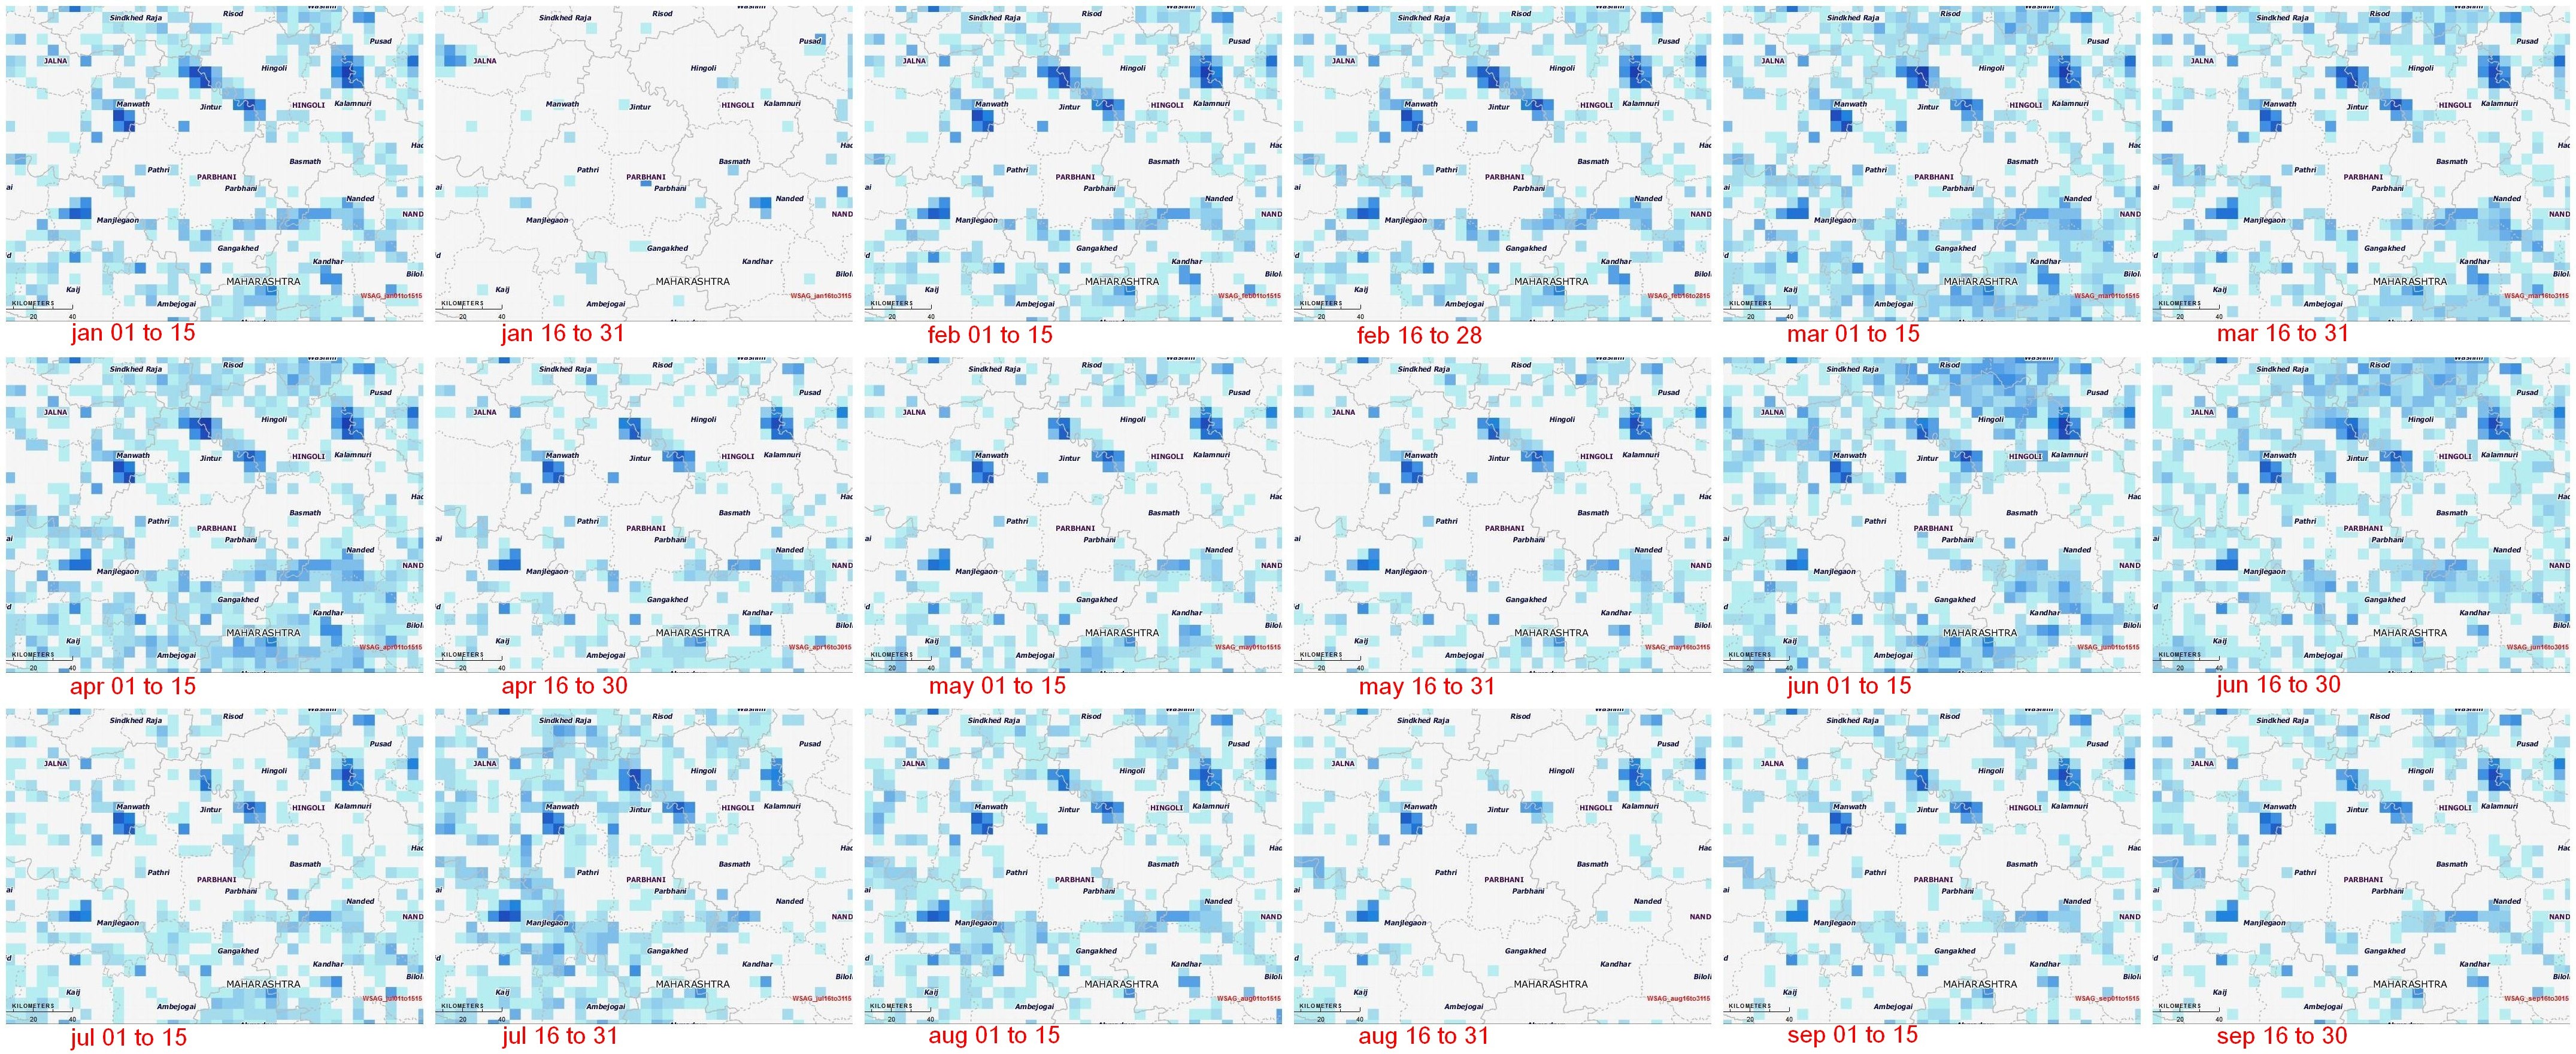
Click on this detail for a full size image (1.7MB) of the panel of fortnightly maps.
The importance of monitoring water collection and use at this scale can be illustrated through a very brief outline of Parbhani. The district has 830 inhabited villages distributed through nine tehsils that together occupy 6,214 square kilometres, eight towns, 359,784 households in which a population of 1.83 million live (1.26 rural and 0.56 million urban). This population includes 317,000 agricultural labourers and 295,000 cultivators – thus water use and rainfall is of very great importance for this district, and indeed for the many like it all over India.
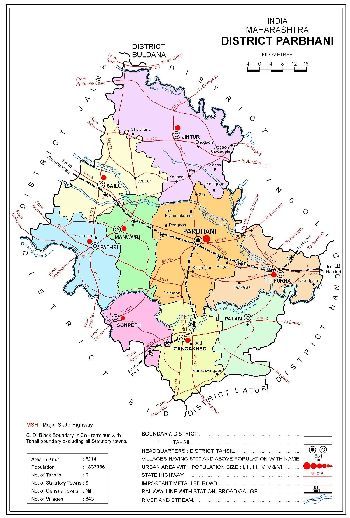
The map of Parbhani district and its talukas, from the Census 2011 District Census Handbook.
This water bodies map for Parbhani district is composed of 18 panels that are identical spatially – that is, centred on the district – and display the chronological progression of water accumulation or withdrawal. Each panel is a 15-day period, and the series of mapped fortnights begins on 1 January 2015.
The panels tell us that there are periods before the typical monsoon season (1 June to 30 September) when the accumulation of water in surface water bodies has been more than those 15-day periods found during the monsoon season. See in particular the first and second fortnights of March, and the first fortnight of April. [Here is a good quality image of the census map, 968KB.]
During the monsoon months, it is only the two fortnights of June in which the accumulation of water in the surface water bodies of Parbhani district can be seen. The first half of July and the second half of August in particular have been recorded as relatively dry.
This small demonstration of the value of such information, provided at no cost and placed in the public domain, is based on the programme ‘Satellite derived Information on Water Bodies Area (WBA) and Water Bodies Fraction (WBF)’ which is provided by the National Remote Sensing Centre (NRSC), Indian Space Research Organisation (ISRO), Department of Space, Government of India.
For any of our districts, such continuous monitoring is an invaluable aid to: facilitate the study of water surface dynamics in river basins and watersheds; analyse the relationships between regional rainfall scenarios and the collection and utilisation of water in major, medium reservoirs and irrigation tanks and ponds; inventory, map and administer the use of surface water area at frequent intervals, especially during the crop calendar applicable to district and agro-ecological zones. [Also posted on India Climate Portal.]
Lessons of monsoon 2015 for district India
 With two weeks of the June to September monsoon remaining in 2015, one of the end-of-season conclusions that the India Meteorological Department (IMD) has spoken of is that four out of ten districts in the country has had less rainfall than normal.
This overview is by itself alarming, but does not aid state governments and especially line ministries plan for coming months, particularly for agriculture and cultivation needs, water use, the mobilisation of resources for contingency measures, and to review the short- and medium-term objectives of development programmes. [See ‘A method for a post-carbon monsoon’ for a recent discussion.]
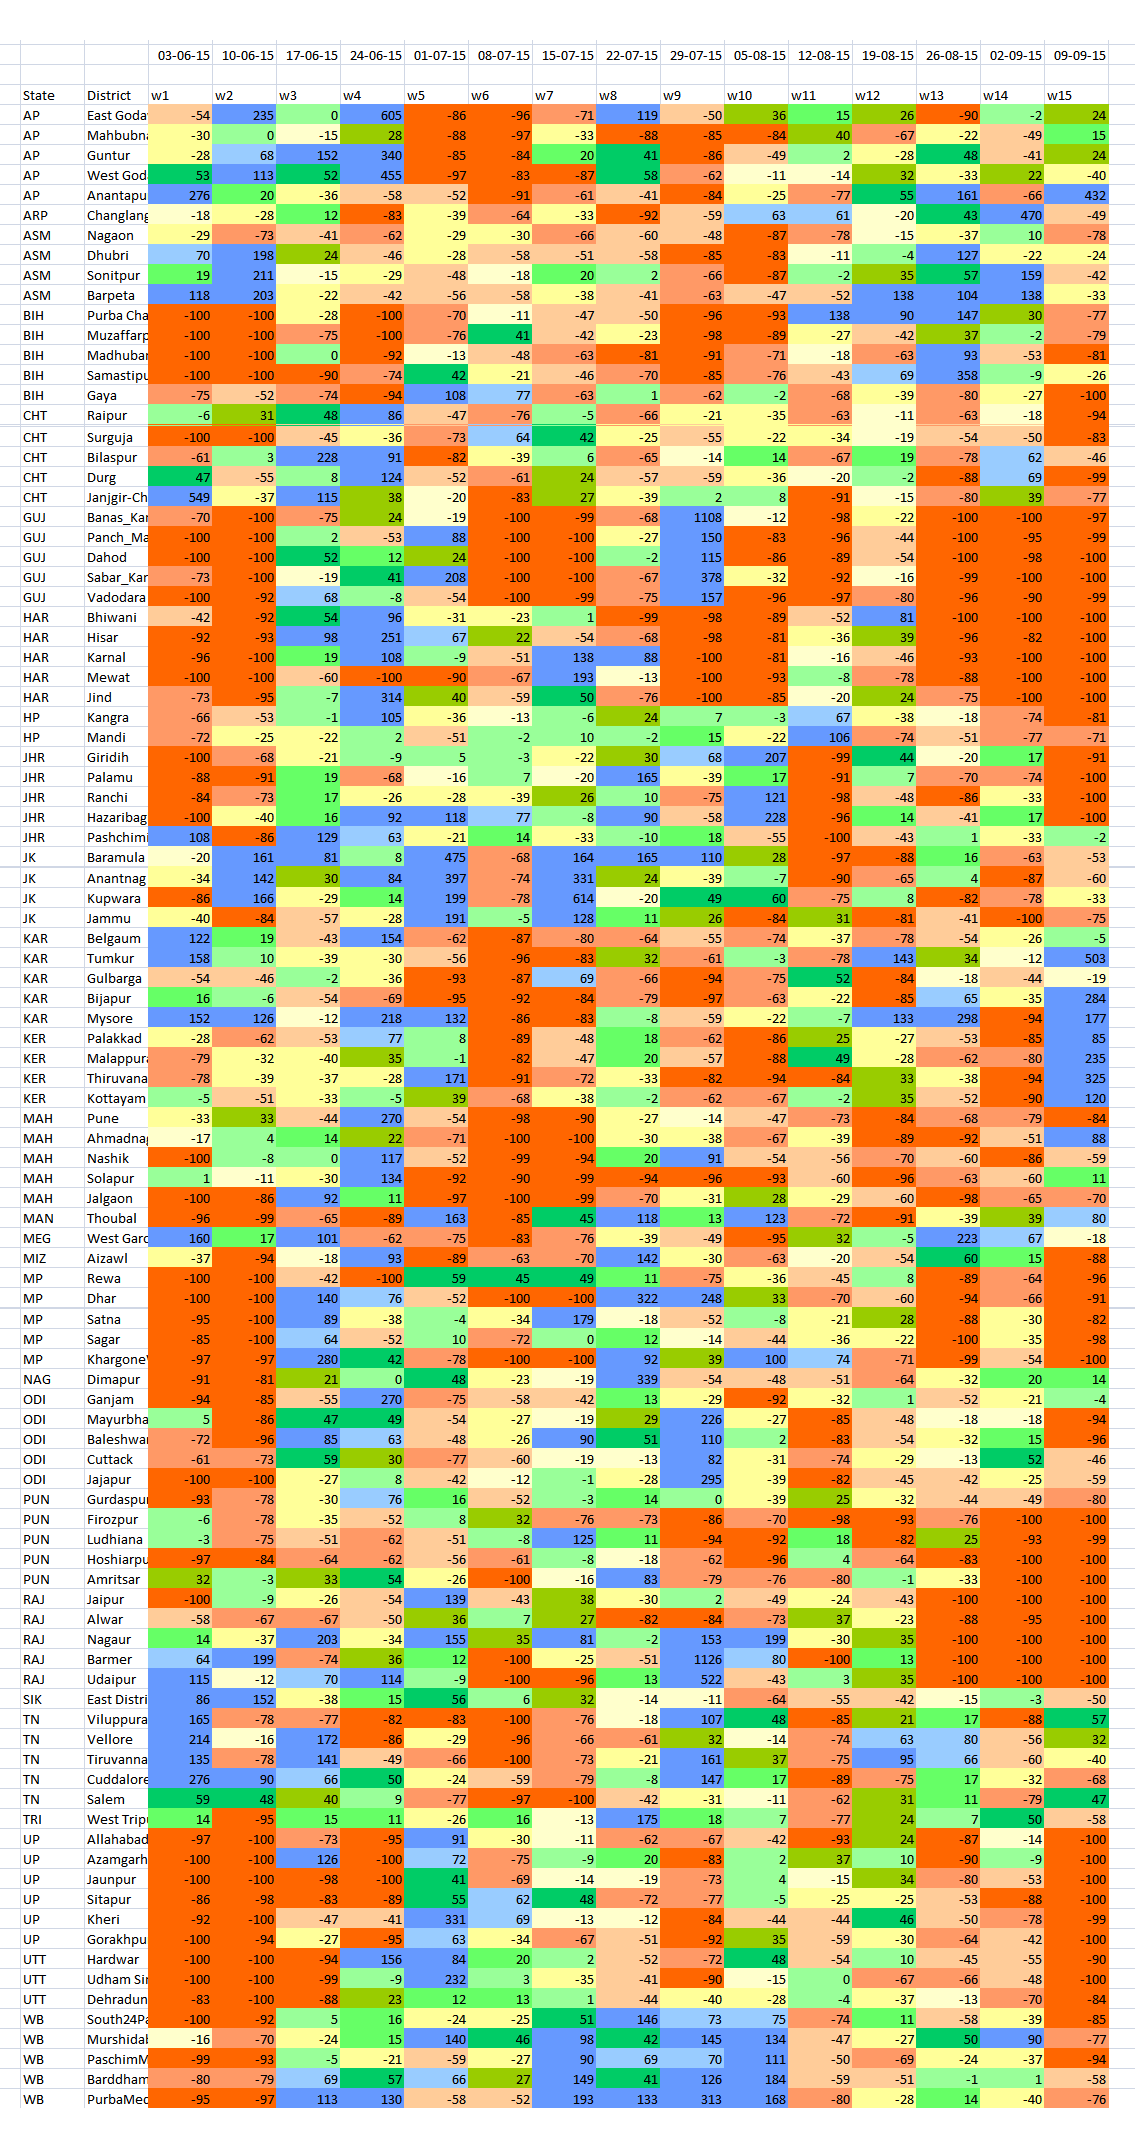 The detailed tabulation (done for 15 weeks) is meant to provide guidance of where this may be done immediately – in the next two to four weeks – and how this can be done in future. The districts are chosen on the basis of the size of their rural populations (calculated for 2015). Thus Purba Champaran in Bihar, Bhiwani in Haryana, Rewa in Madhya Pradesh and Viluppuram in Tamil Nadu are the districts in those states with the largest rural populations.
In this way, the effect of rainfall variability, from Week 1 (which ended on 3 June) to Week 15 (which ended on 9 September), in the districts with the largest rural populations can be analysed. Because a large rural population is also a large agricultural population, the overall seasonal impact on that district’s agricultural output can also be inferred.
The distribution of the districts is: six from Uttar Pradesh; five each from Andhra Pradesh, Bihar, Chhattisgarh, Gujarat, Haryana, Jharkhand, Karnataka, Maharashtra, Madhya Pradesh, Odisha, Punjab, Rajasthan, Tamil Nadu and West Bengal; four each from Assam, Jammu and Kashmir, and Kerala; three from Uttarakhand; two from Himachal Pradesh; one each from Arunachal Pradesh, Manipur, Meghalaya, Mizoram, Nagaland, Sikkim and Tripura.
Using the new 11-grade rainfall categorisation, a normal rainweek is one in which the rainfall is between +10% more and -10% less for that week. The overview for this group of 100 districts, only 11 have had five or more normal weeks of rain out of 15 weeks. In alarming contrast, there are 77 districts which have had three or fewer normal weeks of rain – that is, more than three-fourths of these most populous districts. Half the number (51 districts) have had two, one or no normal weeks of rain. And 22 of these districts have had only one or no normal weeks of rain.
From this group of 100 most populous (rural population) districts Gorakhpur in Uttar Pradesh and Nagaon in Assam have had the most deficit rainweeks, tallying 13, out of the 15 tabulated so far. There are ten districts which have had 12 deficit rainweeks out of 15 and they are (in decreasing order of rural population): Muzaffarpur (Bihar), Pune and Jalgaon (Maharashtra), Surguja (Chhattisgarh), Panch Mahals and Vadodara (Gujarat), Firozpur (Punjab), Thiruvananthapuram (Kerala), Hoshiarpur (Punjab) and Mewat (Haryana).
[Also posted by India Climate Portal as ‘Where they waited for rain in 2015’.]
A method for a post-carbon monsoon

The uses to which we have put available climatic observations no longer suit an India which is learning to identify the impacts of climate change. Until 2002, the monsoon season was June to September, there was an assessment in May of how well (or not) the monsoon could turn out, and short-term forecasts of one to three days were available only for the major metros and occasionally a state that was in the path of a cyclone. But 2002 saw the first of the four El Niño spells that have occurred since 2000, and the effects on our Indian summer monsoon began to be felt and understood.
The India Meteorology Department (which has become an everyday abbreviation of IMD for farmers and traders alike) has added computational and analytical resources furiously over the last decade. The new research and observational depth is complemented by the efforts of a Ministry of Earth Sciences which has channelled the copious output from our weather satellites, under the Indian Space Research Organisation (ISRO), and which is interpreted by the National Remote Sensing Centre (NRSC), to serve meteorological needs.
The IMD, with 559 surface observatories, 100 Insat satellite-based data collection platforms, an ‘integrated agro-advisory service of India’ which has provided district-level forecasts since 2008, a High Performance Computing System commissioned in 2010 (whose servers run at Pune, Kolkata, Chennai, Mumbai, Guwahati, Nagpur, Ahmedabad, Bengaluru, Chandigarh, Bhubaneswar, Hyderabad and New Delhi) ploughs through an astonishing amount of numerical data every hour. Over the last four years, more ‘products’ (as the IMD system calls them) based on this data and its interpretation have been released via the internet into the public domain. These are reliable, timely (some observation series have three-hour intervals), and valuable for citizen and administrator alike.

The new 11-grade indicator for assessing weekly rainfall departures in districts. Same data, but dramatically more useful guidance.
Even so, the IMD’s framing of how its most popular measures are categorised is no longer capable of describing what rain – or the absence of rain – affects our districts. These popular measures are distributed every day, weekly and monthly in the form of ‘departures from normal’ tables, charts and maps. The rain adequacy categories are meant to guide alerts and advisories. There are four: ‘normal’ is rainfall up to +19% above a given period’s average and also down to -19% from that same average, ‘excess’ is +20% rain and more, ‘deficient’ is -20% to -59% and ‘scanty’ is -60% to -99%. These categories can mislead a great deal more than they inform, for the difference between an excess of +21% and an excess of +41% can be the difference between water enough to puddle rice fields and a river breaking its banks to ruin those fields.
In today’s concerns that have to do with the impacts of climate change, with the increasing variability of the monsoon season, and especially with the production of food crops, the IMD’s stock measurement ‘product’ is no longer viable. It ought to have been replaced at least a decade ago, for the IMD’s Hydromet Division maintains weekly data by meteorological sub-division and by district. This series of running records compares any given monsoon week’s rainfall, in a district, with the long period average (a 50-year period). Such fineness of detail must be matched by a measuring range-finder with appropriate interpretive indicators. That is why the ‘no rain’, ‘scanty’, ‘deficient’, ‘normal’ or ‘excess’ group of legacy measures must now be discarded.
In its place an indicator of eleven grades translates the numeric density of IMD’s district-level rainfall data into a much more meaningful code. Using this code we can immediately see the following from the chart ‘Gauging ten weeks of rain in the districts’:
1. That districts which have experienced weeks of ‘-81% and less’ and ‘-61% to -80%’ rain – that is, very much less rain than they should have had – form the largest set of segments in the indicator bars.
2. That districts which have experienced weeks of ‘+81% and over’ rain – that is, very much more rain than they should have had – form the next largest set of segments in the indicator bars.
3. That the indicator bars for ‘+10% to -10%’, ‘-11% to -20%’ and ‘+11% to +20%’ are, even together, considerably smaller than the segments that show degrees of excess rain and degrees of deficient rain.

Far too many districts registering rainfall departures in the categories that collect extremes of readings. This is the detailed reading required to alert state administrations to drought, drought-like and potential flood conditions.
Each bar corresponds to a week of district rainfall readings, and that week of readings is split into eleven grades. In this way, the tendency for administrations, citizens, the media and all those who must manage natural resources (particularly our farmers), to think in terms of an overall ‘deficit’ or an overall ‘surplus’ is nullified. Demands for water are not cumulative – they are made several times a day, and become more or less intense according to a cropping calendar, which in turn is influenced by the characteristics of a river basin and of an agro-ecological zone.
The advantages of the modified approach (which adapts the Food and Agriculture Organisation’s ‘Global Information and Early Warning System’ categorisation, designed to alert country food and agriculture administrators to impending food insecurity conditions) can be seen by comparing the single-most significant finding of the IMD’s normal method, with the finding of the new method, for the same point during the monsoon season.
By 12 August 2015 the Hydromet Division’s weekly report card found that 15% of the districts had recorded cumulative rainfall of ‘normal’ and 16% has recorded cumulative rainfall of ‘deficient’. There are similar tallies concerning rainfall distribution – by region and temporally – for the meteorological sub-divisions and for states. In contrast the new eleven-grade measure showed that in seven out of 10 weeks, the ‘+81% and over’ category was the most frequent or next-most frequent, and that likewise, the ‘-81% and less’ category was also the most frequent or next-most frequent in seven out of 10 weeks. This finding alone demonstrates the ability of the new methodology to provide early warnings of climatic trauma in districts, which state administrations can respond to in a targeted manner.
