Posts Tagged ‘China’
恭禧發財 for the Year of the Monkey

Monkey-themed stamps are being issued by postal services all over the world to welcome the Year of the Monkey; Chinese television audiences are angry that a popular monkey king actor hasn’t been invited to big broadcaster CCTV’s Spring Festival gala; but they may be mollified by plans to release the fantasy epic ‘The Monkey King 2’ in 100 cities in 30 countries on or around 8 February; amidst the many festivities for the lunar new year, monkey-themed designs are found on stamps to commemorative coins, fashion and handicrafts; it is also the start of spring in the P R of China and there’s a lot to learn; folk  artists are making traditional paper-cut monkeys to celebrate the new year (red paper, always red) as the paper cuts symbolise best wishes for the new year; figurines made out of dough of popular Chinese opera characters have been made to welcome the New Year; and Chinese ink painting masters have made monkey portraits in techniques that use few colors (black, yellow, and a bit of red) in a calligraphic manner; and if you are one of the 100,000 waiting for your train at the Guangzhou railway station, let’s hope you’re on your way home in time for the many new year activities. Welcome to the Year of the Monkey.

The colossi of Guangdong

West of Hong Kong lies one of the most extraordinary landscapes in the world, as much for the dense concentration of urban zones, of industrial and factory regions, but also for the change that has occurred over the space of a generation. In the 1970s, the Pearl River Delta was a mainly rural region. Of course there was Guangzhou (known to the world as Canton) but the rest of the sprawling delta was village. The Pearl River itself (‘Zhu Jiang’ in the Chinese) is China’s third longest river, but the second largest by volume of water which moves (after the Yangtze) and its course and seasons governed a basin in south-central China that is just over 400,000 square kilometres large.
The nine cities of the Pearl River Delta together form the world’s most urbanised region. Where did they come from? According to most annals of trading history concerning China, in the late 17th century the Qing government became more open to foreign trade and when that happened Guangzhou (Canton) quickly became a suitable port.

A shipping container terminal whose size defies the scale the eye can gauge, but one of several in the Pear River delta region.
The Portuguese in Macau, the Spanish in Manila, Arabs from the Middle East and Muslims from India were already actively trading in the port of Canton by the 1690s, when the French and English began frequenting the port through the ‘Canton System’ (which was the name given to the imperial court’s regulatory response to what it saw, that long ago, as political and commercial threats). But for the Pearl River Delta, the gates had been opened – the Ostend General India company arrived, so did the Dutch East India Company, then came ships from most western colonial powers.

Over every horizon in every direction but towards the sea is such a landscape, teeming with structures and over-crammed with multi-tiered infrastructure.
By the middle of the 18th century, Guangzhou had already emerged as one of the world’s great trading ports, and the ‘Thirteen Factories’ (not in fact factories at all but the designated areas of the port in where foreign trading was conducted) which were given imperial leave to operate, ensured the distinction was maintained until the outbreak of the First Opium War (1839) and the opening of other ports a few years later.
When, in the 1990s, China became known as the factory of the world, the province of Guangdong (of which Guangzhou is the capital) was where these manufactures were done. This is the activity which has made the province both the most populous in China and the biggest contributor to national GDP. What has also happened is the most rapid urban expansion in human (and Chinese) history. In a little more than 30 years, the Pearl River Delta region has become the epicentre of the Chinese manufacturing and consumer economy.
Over two generations, the urbanisation rate has increased from 28% to 83% which in effect means that where once not very long ago two-thirds of the residents pursued agriculture-based livelihoods, now four-fifths live in fully urban environments. The scale and speed of this transformation is astonishing. The cities of the Pearl River Delta have since 2008 been also referred to as a single interconnected zone of megacities, as their perimeters have blurred, they merge through wide highways and fast railway links and the endless manufacturing zones with their vast factory structures. The entire region has a geographical size larger than Denmark or Switzerland – with a wide river lined thick with docks and crammed with watercraft running through in the middle.

As densely packed as components on printed circuit boards, but these factory zones are kilometres long on each side, and their clones fade into the blue industrial haze.
Working and living here is the largest urbanised population in the world – Guangzhou with 12.8 million, Shenzhen with 10.5 million, Dongguan with 8.3 million, Foshan with 7.3 million and the rest (Huizhou, Zhongshan, Jiangmen, Zhaoqing and Zhuhai) with another 18 million together) for a linked agglomeration of 56.9 million people. This enormous urbanised region accounts for 4.2% of China’s total population, and for 9.3% of its GDP. The multi-megalopolis has been assembled through the completion (and continuous expansion) of more than 150 major infrastructure projects (each by itself would be a significant milestone in a small country) which have helped the colossal network of transportation, water, energy supply and telecommunication to function every day.
There are labyrinths of roads, tunnels and bridges across the delta, as well as intra- and inter-city railways so that the residents of the Pearl River Delta speed from any one of the nine cities to another in an hour or less. Extending south-eastwards, these lead into Hong Kong, the Special Autonomous Region, whose economic might and cultural richness are both natural guides for the Pearl River multi-megalopolis but also (as seen from within Hong Kong, and perhaps Beijing) its competitor. Will the Pearl River Delta – the world’s biggest concentration of manufacturing megawattage, of people and of infrastructure – eventually absorb Hong Kong?
[Photos by Rahul Goswami, 2015.]
So very many of us

The current world population of 7.3 billion is expected to reach 8.5 billion by 2030, 9.7 billion in 2050 and 11.2 billion in 2100, according to ‘World Population Prospects: The 2015 Revision”, which is compiled and issued by the Department of Economic and Social Affairs of the United Nations.
Of particular interest to us is the prediction (based on very sound estimates and the careful curation of data) that some time in 2022 the population of India will exceed the population of China. Currently, the population of China is approximately 1.38 billion compared with 1.31 billion (the UN-DESA estimate as of now) in India.
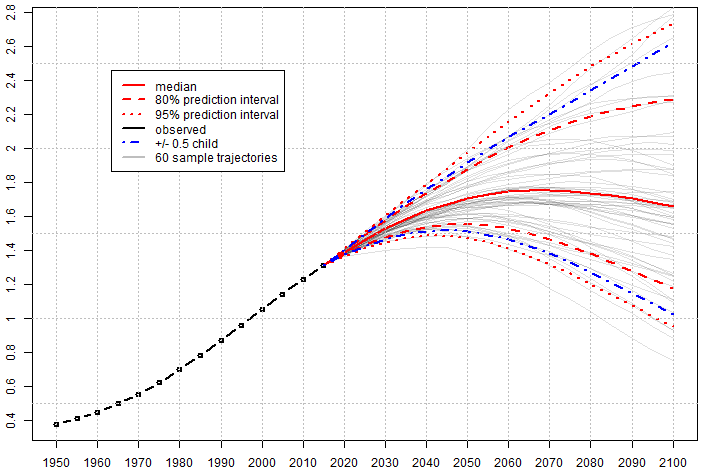
Population growth till here and the fan-tail of predictive projections for the next 85 years. Differing trajectories start becoming visible only from the mid-2020s. Image: UN-DESA
By 2022, both countries are expected to have approximately 1.4 billion people. Thereafter, India’s population is projected to continue growing for several decades to 1.5 billion in 2030 and 1.7 billion in 2050, while the population of China is expected to remain fairly constant until the 2030s, after which it is expected to slightly decrease.
China is now a ‘low fertility country’, that is, one in which women have fewer than 2.1 children, on average, over their life-times. Low-fertility countries now include all of Europe and Northern America, plus 20 countries of Asia. India is an ‘intermediate fertility’ country, that is, where women have on average between 2.1 and 5 children. Intermediate-fertility countries are found in many regions, with the largest being India, Indonesia, Pakistan, Bangladesh, Mexico, and the Philippines.

More urbanisation is expected which will concentrate larger numbers of people into town and city wards. Few will be as ideal as this graphic suggests.
Most of the projected increase in the world’s population can be attributed to a short list of high-fertility countries, mainly in Africa, or countries with already large populations. During 2015-2050, half of the world’s population growth is expected to be concentrated in nine countries: India, Nigeria, Pakistan, D R Congo, Ethiopia, Tanzania, USA, Indonesia and Uganda (listed according to the size of their contribution to the total growth).
Currently, among the ten largest countries in the world, one is in Africa (Nigeria), five are in Asia (Bangladesh, China, India, Indonesia, and Pakistan), two are in Latin America (Brazil and Mexico), one is in Northern America (USA), and one is in Europe (Russia). Of these, Nigeria’s population, currently the seventh largest in the world, is growing the most rapidly. Consequently, the population of Nigeria is projected to surpass that of the USA by about 2050, at which point it would become the third largest country by population in the world.
The power-guzzling Indian steel genie
The Parliamentary Consultative Committee to the Ministry of Steel and Mines has just met. Its chairperson, the Union Minister of Steel and Mines, Narendra Singh Tomar, has following the meeting made an announcement which, if even partly pursued, will alter hugely India’s energy use, our energy mix and our emissions of CO2. Its ecological impact can barely be guessed at.
Tomar said that until 2014 India was the fourth largest producer of iron and steel in the world (after China, Japan and USA). The first five months of 2015, according to industry data, indicate that India will end the year one position higher. This possibility is seen as a triumphant landmark by the present government, for USA will then be relegated to fourth place.
As the table alongside shows, India produced 81.3 million tons of steel in 2013 and 86.5 million tons in 2014 (data from the World Steel Association). The achievement that the minister is so proud about is the data for January to May 2015, during which time India produced 37.6 mt compared with the USA which produced 33.1 mt. On this basis, Tomar and the ministry and the country’s iron and steel industry see a bright future.

Country-wise steel production. Table and data: World Steel Association
So bright indeed that Tomar (having duly consulted the mandarins who are in the know of such things in the ministry) announced that as India’s per capita steel consumption is “quite low, 60 kilograms as against the world average of 216 kilograms, this low consumption no doubt indicates huge growth potential for Indian steel industry”. It hasn’t occurred to any inside the ministry or outside it apparently to wonder whether we would get by quite nicely with 60 kg per person per year or even 50 kg, now that so much has already been built using iron and steel.
But no, Tomar has instead grandly announced to the members of the Parliamentary Consultative Committee that “India has fixed a target of 300 million tonnes production capacity by 2025 and steel ministry is working out action plan and strategies to achieve this target”!
Where did this absurd ‘target’ come from? Does the Union Minister of Steel and Mines simply make numbers up as he wanders about gawking at blast furnaces and iron ore mines or are there advisers in this ministry, in the Ministry of Power (which includes coal and renewable energy), in the Ministry of Environment, in the Ministry of Rural Development and in particular in that ministry’s Department of Land Resources, who has given him these numbers? Or has this monstrous and foolish number come from the world’s iron and steel industry and in particular its Indian private sector heavyweights?
The World Steel Association, which serves as the apex association of the metalmen, scarcely bothers to camouflauge what it wants – that the two big and neo-liberally growing Asian economies continue to feed their appetite for iron and steel. “Despite continued turbulence around the world in 2014, it has been another record year for the steel industry,” explained the Association in its 2014 statistical round-up. “Crude steel production totalled 1,665 million tonnes, an increase of 1% compared to 2013. 2014 also saw the emergence of a new phase in steel markets. For the past decade, the steel industry was dominated by events in China. The evidence is that the steel industry is now entering a period of pause before undoubtedly picking up again when markets other than China drive new demand.”
That phase concerns India, the pause is the building of new steel-making capacity in India (and the staking out of new areas, many under dense old forest, to dig for iron ore and for coal), we are the market other than China (whose steel plants are working at 70% of capacity, if that, and whose consumption growth has stopped), and it is India, in this metallic calculation, that will drive new demand. That is the reason for Tomar’s announcement of per capita kilo-consumption of steel and the 300 million ton figure.
It is scandalous that a minister in charge of a major ministry makes such an announcement without a moment’s thought given to what it means in terms of energy use and what it means in terms of raw material. It takes a great deal of energy to make a ton of steel. Industry engineers call it energy intensity and, including the wide range of methods used to make steel and the wide variety of raw materials used, this energy intensity varies from about 15 gigajoules (GJ) per ton to about 23 GJ per ton.
Put another way, it takes as much energy as 22 average urban households in India use in a month (at about 250 units, or kilowatt hours, per month each) to make a ton of steel. This is the equivalence that ought to have been discussed by the Parliamentary Consultative Committee so that choices can be made that lead us to decisions that do not bury us under kilograms of steel while we suffocate from pollution and have no trees left to provide shade. The equivalence begins with the 86.5 million tons of steel India produced in 2014. This is 237,000 tons per day. India also generated some 1.2 million gigawatt hours of electricity in 2014-15. The two measures are not operands in the same equation because steelmaking also uses coking coal directly.
What we do know is that the residential and industrial sectors consume about 40% and 30% respectively of energy generated, that the making of iron and steel is extremely energy-intensive (it is estimated to account for about 6.5% of India’s total emissions), and that this sector alone accounts for a quarter of India’s total industrial energy consumption. And this is at 86.5 million tons, whether we stand at third or fourth place on the world steelmaking victory podium.
To make these many tons (for our regulation 60 kilos per year ration) it takes a gigantic quantity of raw material. A ton of steel produced in a basic oxygen furnace (which is how 42% of our steel is made) requires 0.96 ton of liquid hot metal (this in turn comes from 1.6 ton of iron ore and 0.6 ton of coking coal) and 0.2 ton of steel scrap. A ton of steel produced in an electric-arc furnace (58% of steel is made this way in India) requires around 0.85 tons of steel scrap and supplementary material amounting to about 0.3 tons (the coal having been burnt in the thermal power plant elsewhere).
What justification can Minister Tomar and his associates provide for this mad project to enclose all Indians in choking suits of armour? it comes from the world’s foremost ironmongers, speaking through their association: “The impact of urbanisation will have a key role to play in the future. It is estimated that a little more than one billion people will move to towns and cities between now and 2030. This major flow will create substantial new demand for steel to be used in infrastructure developments such as water, energy and mass transit systems as well as major construction and housing programmes.” And there we have it – the urbanisation obsession of India translated into ever heavier per capita allotments of metal, and to hell with the trees and the hills.
Retiring the American dollar

Off into history’s sunset, like the cowboy. This image (modified) is called ‘Dollar Green’ by the artist mancaalberto (http://mancaalberto.deviantart.com/)
Seventy years ago, to the very month, a man named Henry Morganthau celebrated the creation of a “dynamic world community in which the peoples of every nation will be able to realise their potentialities in peace”. It was the founding of what came to be called the Bretton Woods institutions (named after the venue for the meeting, in the USA) and these were the International Bank for Reconstruction and Development – better known as the World Bank – and the International Monetary Fund.
None of the lofty aims that seemed so apposite in the shattering aftermath of the Second World War have been achieved, although what has been written are libraries of counter-factual history that claim such achievements (and more besides) commissioned by both these institutions and their web of supporting establishments, financial, academic, political and otherwise. Instead, for the last two generations of victims of ‘structural adjustment’, and of ‘reform and austerity’ all that has become worthwhile in the poorer societies of the world has been achieved despite the Bretton Woods institutions, not because of them.
Now, seventy years after Morganthau (the then Treasury Secretary of the USA) and British economist John Maynard Keynes unveiled with a grey flourish a multi-lateral framework for international economic order, the Bretton Woods institutions are faced with a challenge, and the view from East and South Asia, from Latin America and from southern Africa is that this is a challenge that has been overdue for too long.

Let’s get the de-dollarisation of the world started.
It has come in the form of the agreement between the leaders of five countries to form a development bank. Russia’s President Vladimir Putin, China’s President Xi Jinping, India’s Prime Minister Narendra Modi, Brazilian President Dilma Rousseff and South Africa’s President Jacob Zuma made formal their intention during the sixth summit of their countries – together called ‘BRICS’, after the first letters of their countries’ names – held this month in Brazil.
What has been set in motion is the BRICS Development Bank and the BRICS Contingency Reserves Arrangement. Both the new institution and the new mechanism will counter the influence of Western-based lending institutions and the American dollar, which is the principal reserve currency used internationally and which is the currency that the IMF and the World Bank conduct their ruthless business in (and which formulate their policies around, policies that are too often designed to impoverish the working class and to cripple labour).
At one time or another, and not always at inter-governmental fora, the BRICS have objected to the American dollar continuing to be the world’s principal reserve currency, a position which amplifies the impact of policy decisions by the US Federal Reserve – the American central bank – on all countries that trade using dollars, and which seek capital denominated in dollars. These impacts are, not surprisingly, ignored by the Federal Reserve which looks after the interests of the American government of the day and US business (particularly Wall Street).
In the last two years particularly, non-dollar bilateral agreements have become more common as countries have looked for ways to free themselves from the crushing Bretton Woods yoke. Only this June, Russia’s finance minister said the central banks of Russia and China would discuss currency swaps for export payments in their respective national currencies, a direction that followed Putin’s visit to China the previous month to finalise the gigantic US$400 billion deal between Gazprom and China National Petroleum Corporation (CNPC). It is still early, and the BRICS will favour caution over hyperbole, but when their bank opens for business, the sun will begin to set on the US dollar.
Where the big rivers are

The biggest river deltas are flat and that’s why the cities which occupy some of the have expanded so much, so quickly. The last 50 years has seen a big population expansion on deltas – cities like Dhaka in Bangladesh. Twelve megacities on deltas have expanded in terms of populations from 62 million in 1975 to 153 million in 2010, an expansion that is not slowing.
‘Global Change’, which is the magazine of the International Geosphere Biosphere Programme (IGBP), has brought out a special number of deltas and the risks borne by city administrations that occupy deltas. The IGBP, in its own words, “coordinates international research on global-scale and regional-scale interactions between the Earth’s biological, chemical and physical processes, and their interactions with human systems”.
Flooding both from rivers and the sea is increasing. There was a storm surge in the Irrawaddy in Myanmar in 2008 when 200,000 people were killed. But people are still living on the delta. However, the estimate is that two million people have left the Indus delta in Pakistan to move to higher ground as salt water has invaded the farming zone. [A larger version of the graphic above can be found here (1.4MB). The original IGBP infographic which I have modified can be found here – caution, big file (12.7MB)].
The Po delta (near Venice in Italy) subsided largely because methane was being pumped from underground. They stopped the pumping and the delta is sinking 10 times less fast than it was. But the land surface is not actually rising, and it’s still below sea level. The Chao Phraya River Delta (along which Bangkok is built) subsided because of groundwater being pumped out to supply Thailand’s thirsty capital. So they introduced a tax on water use, such as showers. In Shanghai, the local government slowed the rate of pumping water out of the ground.
However, when countries set up commissions to look at the natural environment, it’s often water/river courses they’re concerned about, like with the Rhine. There is not so much focus on the delta. Where countries have tried geo-engineering, they can scarcely bear the prohibitive costs. It is estimated that China in the 15th to 18th centuries used 12-15% of its historical GDP in attempts to control the Yellow River from spilling out into its floodplain, but these gigantic efforts were never really successful.
Ten reliable rice years

The AMIS prices panel as we find it in 2014 January. Weekly international rice prices (top) are for Thai rice, which have been on a plateau from 2012 Jan to around 2013 April, after which they declined. Rice futures prices (60-day average) have also been on a very gentle upward slope (middle) since 2012 Jan after pronounced swings to that point from 2010 Jan. Rice price volatility was dampened during the last quarter of 2011 until third quarter 2013 (compared to the previous two years) and has moved slowly lower over three years (bottom). Charts: FAO-AMIS
International grains traders rarely consider the historicity of what they deal with day in and day out. Wheat up today, maize down tomorrow, soy futures worth considering for next month, milk powder positions to be liquidated, and so on. Hold what you can profit from only so long as there is profit to be made, and futures are nothing but bets you’ve studied carefully.
But even for the hard-boiled traders, the last decade of rice has made them turn to look back and consider the curiosities of the market. Inventories of rice, all over the world, have been growing slowly and steadily for close to a decade. Now that trend, which since 2003 has been one of the longest unbroken trends in world agriculture, is ending. The change is being attributed, in the commodity exchanges and grain trading floors, to what is called a ‘downgrade’ of supplies of rice in India by the International Grains Council.
The first such forecast decline in world rice stocks, of about one million tons, means that the IGC is estimating world rice inventories at the close of 2013-14 to be 108 million tons. The curious aspect is that India is expecting a bumper rice harvest for 2013-14, and although IGC says world inventories will drop slightly (the end of the trend), there is also a reduced estimate for world consumption of rice, which is another curiosity.
According to the traders Thailand, the top rice exporter for years, has been stockpiling rice “at prices some 40%-50% above the market” and thereby prompting credit rating agencies like Moody’s to claim that the cost of the Thai programme was “threatening the country’s sovereign debt rating”.
This is plain rubbish. Traders and commodity exchanges do not grow rice to feed their families and sell if there is a small surplus to sell. The finance bots in predatory agencies like Standard and Poor’s, Moody’s and Fitch – considered the three largest by the scale of their work – don’t know the difference between a cauliflower and millet and can grow neither. Thai, Indian and African small farmers could not care less whether credit rating agencies exist and our governments should learn what true sovereignty means from our small farmers.

The FAO and IGC food price indexes and their sub-indices. For FAO the chart shows the FAO Food price Index and the cereals, oils and fats and dairy sub-indices over the last five years. For IGC the lower chart shows the IGC Grains and Oilseeds Index, also over the last five years, with the wheat, maize and rice sub-indices. The IGC rice sub-index has also recorded a plateau from 2012 January onwards with a more pronounced decline setting in from 2013 August. Charts: FAO-AMIS
The odd tale of rice was given a late twist by two cyclones. One is Cyclone Phailin which struck the eastern Indian coast in the first week of October 2013. And he other is Typhoon Haiyan, which struck the Philippines in early November 2013. Vietnam is to supply 500,000 tons of rice to the Philippines, which has sought the supplies to boost state reserves depleted by the relief operations after Typhoon Haiyan.
The FAO’s Rice Market Monitor for 2013 November said: “Although accounting for much of the worsening in the global outlook, Asia is still expected to sustain growth in world rice production in 2013. According to the latest forecasts, the region is to harvest 672.7 million tonnes (448.6 million tonnes, milled), 1.2% more than in 2012. Foremost among countries responsible for the increase are India, Indonesia, Thailand, Myanmar and Bangladesh. By contrast, drought in China’s central and eastern provinces exacted a heavy toll on the intermediate and late rice crops, which may bring about the first production decline in the country since 2003.”
I find the FAO Rice Market Monitor more detailed than what the IGC puts out (although IGC’s public offerings are but a distillation of what subscribers to the information service obtain). The FAO Monitor has also added that given a poor delivery record so far, Thailand appears unlikely to boost its exports beyond the relatively low level of last year. And that expectations have improved for India, which may replicate the 2012 record performance, with Australia, Cambodia, China (Mainland), Egypt, Pakistan, Paraguay and the USA also forecast to export more.
The meat map of the world
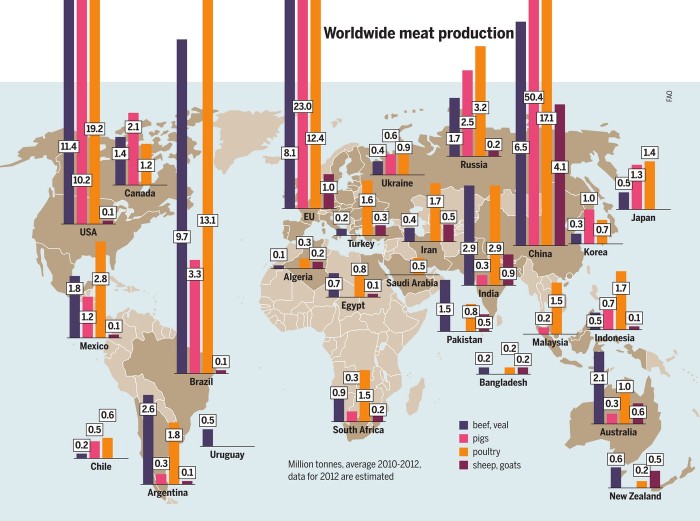
The economies in Asia and elsewhere will see around 80 percent of the growth in the meat sector by 2022. The biggest growth will be in China and India because of huge demand from their new middle classes. Chart: Meat Atlas
Industrial livestock production in Europe and the USA began when feed, energy and land were inexpensive, the ‘Meat Atlas’ has explained, which is published jointly by the Heinrich Böll Foundation and Friends of the Earth Europe.
Nowadays, feed, energy and land have all become scarce and costs have gone up. As a result, total meat production is growing less quickly than before. “The market is growing only for pigs and poultry. Both species utilise feed well and can be kept in a confined space. This means that they can be used to supply the insatiable demand for cheap meat,” the Meat Atlas has said.
By 2022, almost half the additional meat consumed will come from poultry. Beef production, on the other hand, is scarcely growing. The USA remains the world’s largest beef producer, but the meat industry describes the situation there as dramatic. For 2013, it expects a fall of 4-6 per cent compared to 2012 and predicts the decline to continue in 2014. In other traditional producing regions including Brazil, Canada and Europe, production is stagnating or falling.
 “The star of the day is India, thanks to its buffalo meat production, which nearly doubled between 2010 and 2013. India is forcing its way onto the world market, where 25 percent of the beef is in fact now buffalo meat from the subcontinent,” said the Atlas (see this news report from 2013 June).
According to the US Department of Agriculture, India became the world’s biggest exporter of beef in 2012 – going ahead of Brazil. Buffaloes are considered inexpensive to keep by the USDA (what benchmark do they use for husbandry I wonder). Thus the USDA considers buffalo meat a dollar a kilo cheaper than beef from Western cattle. In addition, the Meat Atlas has reminded us, the Indian government has invested heavily in abattoirs. Moreover, faced with the high price of feed, Brazilian cattle-raisers are switching to growing soybeans which has presented an opportunity for Indian buffalo-meat exporters.
China and India differ markedly in their food consumption patterns. In India, a vegetarian lifestyle has deep cultural and social roots. In surveys cited by the Atlas, a quarter or more of all Indians say they are vegetarian. “But the number of meat-eaters is growing. Since the economic boom (my note: usual dreadful mis-labelling here; it is no ‘boom’ but a slow destruction) in the early 1990s, a broad middle class that aspires to a Western lifestyle has emerged (true enough). This includes eating meat which has become a status symbol among parts of the population. Nevertheless, meat consumption in India is still small – per person it is less than one-tenth of the amount consumed in China.”
 The costs borne by the environment because of the world’s fondness for animal-origin protein are probably the biggest, but are still difficult to calculate despite some 30 years of following advances in environmental economics. This helps us estimate some damage to nature in monetary terms. It covers the costs of factory farming that do not appear on industry balance sheets, such as money saved by keeping the animals in appalling conditions. The burden upon nature also grows by over-fertilisation caused by spreading manure and slurry on the land and applying fertilisers to grow fodder maize and other crops.
The encirclement of Syria

A map prepared by German magazine Der Spiegel to show areas of control in Syria.
Update: Samples collected by the UN chemical experts team in the Damascus suburb will be transferred to laboratories for analysis “within hours,” a spokesperson for UN Secretary-General Ban Ki-moon has said in a note to correspondents. “The samples were shipped this afternoon from The Hague and will reach their destination within hours,” the note said. It added that the designated laboratories are prepared to begin the analyses “immediately after receipt of samples.”
Ria Novosti has quoted Alexei Pushkov, who heads the international affairs committee in the lower chamber of the Russian parliament, the State Duma, as having said: “By sending the Nimitz nuclear aircraft carrier to Syria’s shores, Obama demonstrates that the military action has been postponed, but not cancelled, and that he is determined to start a war.”
Press communiqués from Russia indicate that President Vladimir Putin’s government in Moscow wants any military action to go through the UN Security Council, but will likely block any resolution to authorise it, citing lack of conclusive evidence that the Syrian government, not the insurgents, was behind the attack.
Moscow will continue to support the Assad government with weapons and humanitarian aid, as it has in the past. The view of Russian analysts is that this is so because Moscow has invested a considerable sum in Assad’s government through loans and financial support.

A readers’ poll by presseurop shows 65% want nothing to do with war.
Der Spiegel has a longish news feature in which it has explained that the USA has stepped back from an immediate response to the alleged use of chemical weapons in Syria on 21 August 2013. But the Obama regime in Washington continues to profess “certainty” that Syrian president Bashar Assad is behind the attack. Der Spiegel’s tone is pro-White House and certainly not objective enough for even a third-rate district newspaper, but this sort of Europedantry is useful for indicating how the autocratic regimes in Berlin, Paris and London are currently thinking.
Russian Foreign Minister Sergey Lavrov has said secrecy by the West is unacceptable with regard to Syria and evidence of the use of chemical weapons there. He added that “what our American, British and French partners have shown us before – as well as now – does not convince us at all. There are no supporting facts, there is only repetitive talk in the vein of ‘we know for sure’. And when we ask for further clarification, we receive the following response: ‘You are aware that this is classified information, therefore we cannot show it to you.’ So there are still no facts.”
An article in Counterpunch has said that “having been released prior to even preliminary reports from UN chemical weapons investigators on the ground in Syria, the (American) document (claiming proof of the Syrian government’s use of chemical weapons on its own population) is as much a work of fiction as it is fact.”
Outside the cosmeticised clutter of the world’s mainstream and corporate media, a number of information channels are citing interviews with doctors, Ghouta residents, rebel fighters in Syria and their families, from which a very different picture emerges. Many believe that certain rebels received chemical weapons via the Saudi intelligence chief, Prince Bandar bin Sultan, and were responsible for carrying out the dealing gas attack.
In a recent article for Business Insider, reporter Geoffrey Ingersoll highlighted Saudi Prince Bandar’s role in the two-and-a-half year Syrian civil war. Many observers believe Bandar, with his close ties to Washington, has been at the very heart of the push for war by the U.S. against Assad. Ingersoll referred to an article in Britain’s Daily Telegraph about secret Russian-Saudi talks alleging that Bandar offered Russian President Vladimir Putin cheap oil in exchange for dumping Assad.
“Prince Bandar pledged to safeguard Russia’s naval base in Syria if the Assad regime is toppled, but he also hinted at Chechen terrorist attacks on Russia’s Winter Olympics in Sochi if there is no accord,” Ingersoll wrote. “Along with Saudi officials, the US allegedly gave the Saudi intelligence chief the thumbs up to conduct these talks with Russia, which comes as no surprise. Bandar is American-educated, both military and collegiate, served as a highly influential Saudi Ambassador to the US, and the CIA totally loves this guy.”

A picture drawn by a Syrian child, living through the conflict. Image: CBBC Newsround (www.bbc.co.uk/newsround/21771713)
Update: The rush to attack Syria by the Obama administration is being prepared in contempt of international law, democratic processes and in contempt of public opinion in the USA itself. This was made abundantly clear in the presentation US Secretary of State John Kerry delivered from the State Department on Friday, 30 August.
On Saturday, 31 August, Russian President Vladimir Putin dismissed as “utter nonsense” the US claims that the Syrian government forces have used chemical weapons. “The Syrian government troops are on the offensive … So giving a trump card to those who are calling for a military intervention is utter nonsense,” Putin told reporters in Vladivostok.
The so-called US ‘Government Assessment of the Syrian Government’s Use of Chemical Weapons’ contains not one shred of probative evidence. As emphasised by the website of the International Committee of the Fourth International, the document, barely three pages long, includes a series of unsubstantiated assertions that are tailored to the US policy aim of manufacturing a pretext for direct intervention in a US-provoked civil war aimed at toppling the Syrian regime of Bashar al-Assad.
To the question, put to him by Syrian playwright Mohammad Al Attar, which was, “You have a cautious stance on recent Western statements about arming opposition fighters. Why is this?”, Noam Chomsky, interviewed in July 2013, replied: “It is linked to an evaluation of the consequences. Once again, I believe there are much simpler ways that the West can take before making the leap to military aid, some of which I have mentioned above, but which further include providing increased levels of humanitarian aid. If we are serious, we must look at the consequences of such an action. What would be the result on a humanitarian level? My question is practical, not ethical.” More from the Heinrich Böll Stiftung Middle East.

A page extract from NBC’s poll on US military action against Syria.
But the views of the reasonable and pacifist many have rarely halted the war charges of the White House. A poll carried out by the American broadcaster NBC has showed that nearly 80% of those polled want approval from the US Congress for military action against Syria. “Nearly 80 percent of Americans believe President Barack Obama should receive congressional approval before using force in Syria, but the nation is divided over the scope of any potential strike,” the NBC report has said.
The raw poll findings, which I have extracted from the document helpfully posted in full by NBC, show the clarity with which the polled public view the recklessness of the Obama administration. In particular see the “no, will not improve the situation” and “no, not in our national interest” responses.
Older post: There is little point now in switching on any of the mainstream television news channels, for the propaganda campaign has shifted into high gear. The last decade has provided enough practice for such a campaign – war and unrest have become orchestrated as spectacles. There has been Iraq, Afghanistan, Libya, Egypt, Somalia and Al Qaeda. Hence the machinery used to package another war for the public has been well used. The official reasons given for the imminent attack on Syria are unsubstantiated and lies that are fashioned crudely into a bloodthirsty collection of pretexts to justify a policy planned well in advance.
Shoved aside are the voices that are calling for the investigations to find evidence of the alleged gas attacks inside Syria, to let dialogue and diplomacy dominate all interactions, to give all sides a hearing and count all views.
The voices are there and this is what they have said and are saying:
On 28 August 2013, with United Nations Secretary-General Ban Ki-moon and other UN officials urging continued cooperation, the UN team investigating alleged use of chemical weapons in Syria visited several locations in the suburbs of Damascus, including impact sites, where it collected additional information and samples. That work must continue, as Syria itself has asked the UN, speaking through its permanent representative to the UN speaking on 28 August 2013 (see this video clip).
On 25 August 2013 the Spokesperson for UN Secretary-General Ban Ki-moon said on 24 and 25 August 2013, the High Representative for Disarmament Affairs, Angela Kane, met with senior officials of the Government of the Syrian Arab Republic. “The purpose of her visit was to seek cooperation of the Government in facilitating an expeditious investigation of the incident in the Ghouta area on 21 August involving the alleged use of chemical weapons,” noted the statement.
The UN Secretary-General instructed the investigating mission which began its on-site fact-finding activities on 26 August 2013, that is, only three days ago. And yet the governments in Washington and London are ferociously claiming there is no need for a UN Security Council resolution on what form of intervention to make in response, and indeed for the investigations to cease so that war can commence immediately.
For the USA and Britain – and their supporters in Germany and France and a few other countries – to threaten to or to militarily strike at Syria is a blatant violation of the United Nations Charter – which has not been mentioned by Barack Obama or David Cameron. The UN Charter requires countries to settle their international disputes peacefully. Article 2(4) makes it illegal for any country to either use force or threaten to use force against another country. Article 2(7) prohibits intervention in an internal or domestic dispute in another country. The only time military force is lawful under the Charter is when the Security Council approves it, or under Article 51, which allows a country to defend itself if attacked. None of the governments now howling for war were attacked.

A graphic by Ria Novosti showing the build-up of military in the Mediterranean and surrounding Syria.
Writing in The Guardian, Hans Blix reminded us that “In 2003 the US and the UK and an alliance of ‘friendly states’ invaded Iraq without the authorisation of the UN Security Council. “A strong body of world opinion felt that this constituted a violation and an undermining of the UN charter,” wrote Blix. “A quick punitive action in Syria today without UN authorisation would be another precedent, suggesting that great military powers can intervene militarily when they feel politically impelled to do so.” Blix was the head of the UN monitoring, verification and inspection commission from March 2000 to June 2003. In 2002, the commission began searching Iraq for weapons of mass destruction, ultimately finding none.
We can expect that Russia and China, on the UN Security Council, will use their veto to halt an Anglo-American war on Syria. That is why the USA and Britain have been assembling warships in the Mediterranean – were these warships there before the alleged gas attacks in Syria? That is what responsible media should be asking governments in Washington and London.
Nonetheless, there are more reliable news sources to turn to. The Russian news website RT is running a ‘Syria ‘chemical weapons’ crisis live updates’ page. Ria Novosti is also covering the crisis and you will reports such as “Russian President Vladimir Putin and his Iranian counterpart, Hassan Rouhani, have discussed the situation in Syria, condemned the use of chemical weapons, and called for a political settlement”.
And the People’s Republic of China has its global news service, Xinhua, which has reported Syrian President Bashar al-Assad as having said that his country “would defend itself against any foreign aggression, stressing determination to ‘eliminate terrorism’ in the war-weary country”.
Tiffin: GM in China, land in Colombia, soya republic, the dodgiest food prize
1) China is the world’s biggest grain producer and maintains a standing policy that forbids growing GM grain. But China does allow imports of certain GM products. In 2012, China imported over 58 million tons of soybeans – mostly genetically modified. Public opinions on GM crops in China are polarised, with a great number of people holding suspicions toward GM products.
Rao Yi, a professor and dean of Peking University’s School of Life Sciences, said that while some GM-related concerns still need to be discussed, there are also rumors that need to be dispelled. Domestically-grown soybean is scarce in China, as China’s imports of GM soybeans rocketed to 58 million tons from less than 3 million tons in 1997. Many farmers have abandoned soybeans for other crops, as imported soybeans are cheaper. GM technology is the future of agriculture, said Fang Zhouzi, a biochemist and vocal supporter of GM technology, adding that it will be harder for China “to catch up with the USA” if China does not recognize this fact.
2) Cargill, the world’s largest food company, has been secretly amassing land from small farmers in eastern Colombia, despite a law prohibiting the practice. When the two countries signed a free trade agreement last year, Cargill emerged as the owner of 52,574 hectares where it grows corn and soybeans. The small farms in the isolated high plains of Vichada department in eastern Colombia were given to poor peasants in the 1990s under a scheme to convert ‘wasteland’ in an area that had become a stronghold for the lucrative cocaine trade. Colombian law prohibits any one person or entity from owning more than one “agricultural family unit” of this land in an effort to diversify land ownership in a country where most land is owned by a small wealthy minority.
3) The profound impacts of the agribusiness model know no borders between rural and urban. In rural areas and outer suburbs they are measured in terms of agrotoxin poisoning, displaced farmers (who swell the ranks of the urban poor), ruined regional economies, correspondingly high urban food prices, and contamination of the food supply. Ultimately, what we are looking at is a social and environmental catastrophe settling like a plague over the entire region. Wherever you live, you cannot ignore it.
The handful of people and companies responsible for this chain of destruction have names: Monsanto and a few other biotech corporations (Syngenta, Bayer) leading the pack; large landowners and planting pools that control millions of hectares (Los Grobo, CRESUD, El Tejar, Maggi, and others); and the cartels that move grain around the world (Cargill, ADM, and Bunge). Not to mention the governments of each of these countries and their enthusiastic support for this model. To these should be added the many auxiliary businesses providing services, machinery, spraying, and inputs that have enriched themselves as a result of the model.
To put some numbers on the phenomenon, there are currently over 46 million ha of GE soy monoculture in the region. These are sprayed with over 600 million litres of glyphosate and are causing deforestation at a rate of at least 500,000 ha per year.
4) The 2013 World Food Prize has gone to three chemical company executives, including Monsanto executive vice president and chief technology officer, Robert Fraley, responsible for development of genetically modified organisms (GMOs). Yet, GMO seeds have not been designed to meet the Prize’s mandate and function in ways that actually impede progress toward the stated goals of the World Food Prize.
Almost twenty years after commercialisation of the first GMO seeds, by far the most widely used are not engineered to enhance nutrient content, but to produce a specific pesticide or to resist a proprietary herbicide, or a combination of these traits. Even in reducing weeds, the technology is failing, for it has led to herbicide-resistant “super weeds” now appearing on nearly half of American farms.
This award not only communicates a false connection between GMOs and solutions to hunger and agricultural degradation, but it also diverts attention from truly “nutritious and sustainable” agroecological approaches already proving effective, especially in the face of extreme weather. Developed and controlled by a handful of companies, genetically engineered seeds further the concentration of power and the extreme inequality at the root of this crisis of food inaccessibility.
