Archive for the ‘Energy’ Category
The power-guzzling Indian steel genie
The Parliamentary Consultative Committee to the Ministry of Steel and Mines has just met. Its chairperson, the Union Minister of Steel and Mines, Narendra Singh Tomar, has following the meeting made an announcement which, if even partly pursued, will alter hugely India’s energy use, our energy mix and our emissions of CO2. Its ecological impact can barely be guessed at.
Tomar said that until 2014 India was the fourth largest producer of iron and steel in the world (after China, Japan and USA). The first five months of 2015, according to industry data, indicate that India will end the year one position higher. This possibility is seen as a triumphant landmark by the present government, for USA will then be relegated to fourth place.
As the table alongside shows, India produced 81.3 million tons of steel in 2013 and 86.5 million tons in 2014 (data from the World Steel Association). The achievement that the minister is so proud about is the data for January to May 2015, during which time India produced 37.6 mt compared with the USA which produced 33.1 mt. On this basis, Tomar and the ministry and the country’s iron and steel industry see a bright future.

Country-wise steel production. Table and data: World Steel Association
So bright indeed that Tomar (having duly consulted the mandarins who are in the know of such things in the ministry) announced that as India’s per capita steel consumption is “quite low, 60 kilograms as against the world average of 216 kilograms, this low consumption no doubt indicates huge growth potential for Indian steel industry”. It hasn’t occurred to any inside the ministry or outside it apparently to wonder whether we would get by quite nicely with 60 kg per person per year or even 50 kg, now that so much has already been built using iron and steel.
But no, Tomar has instead grandly announced to the members of the Parliamentary Consultative Committee that “India has fixed a target of 300 million tonnes production capacity by 2025 and steel ministry is working out action plan and strategies to achieve this target”!
Where did this absurd ‘target’ come from? Does the Union Minister of Steel and Mines simply make numbers up as he wanders about gawking at blast furnaces and iron ore mines or are there advisers in this ministry, in the Ministry of Power (which includes coal and renewable energy), in the Ministry of Environment, in the Ministry of Rural Development and in particular in that ministry’s Department of Land Resources, who has given him these numbers? Or has this monstrous and foolish number come from the world’s iron and steel industry and in particular its Indian private sector heavyweights?
The World Steel Association, which serves as the apex association of the metalmen, scarcely bothers to camouflauge what it wants – that the two big and neo-liberally growing Asian economies continue to feed their appetite for iron and steel. “Despite continued turbulence around the world in 2014, it has been another record year for the steel industry,” explained the Association in its 2014 statistical round-up. “Crude steel production totalled 1,665 million tonnes, an increase of 1% compared to 2013. 2014 also saw the emergence of a new phase in steel markets. For the past decade, the steel industry was dominated by events in China. The evidence is that the steel industry is now entering a period of pause before undoubtedly picking up again when markets other than China drive new demand.”
That phase concerns India, the pause is the building of new steel-making capacity in India (and the staking out of new areas, many under dense old forest, to dig for iron ore and for coal), we are the market other than China (whose steel plants are working at 70% of capacity, if that, and whose consumption growth has stopped), and it is India, in this metallic calculation, that will drive new demand. That is the reason for Tomar’s announcement of per capita kilo-consumption of steel and the 300 million ton figure.
It is scandalous that a minister in charge of a major ministry makes such an announcement without a moment’s thought given to what it means in terms of energy use and what it means in terms of raw material. It takes a great deal of energy to make a ton of steel. Industry engineers call it energy intensity and, including the wide range of methods used to make steel and the wide variety of raw materials used, this energy intensity varies from about 15 gigajoules (GJ) per ton to about 23 GJ per ton.
Put another way, it takes as much energy as 22 average urban households in India use in a month (at about 250 units, or kilowatt hours, per month each) to make a ton of steel. This is the equivalence that ought to have been discussed by the Parliamentary Consultative Committee so that choices can be made that lead us to decisions that do not bury us under kilograms of steel while we suffocate from pollution and have no trees left to provide shade. The equivalence begins with the 86.5 million tons of steel India produced in 2014. This is 237,000 tons per day. India also generated some 1.2 million gigawatt hours of electricity in 2014-15. The two measures are not operands in the same equation because steelmaking also uses coking coal directly.
What we do know is that the residential and industrial sectors consume about 40% and 30% respectively of energy generated, that the making of iron and steel is extremely energy-intensive (it is estimated to account for about 6.5% of India’s total emissions), and that this sector alone accounts for a quarter of India’s total industrial energy consumption. And this is at 86.5 million tons, whether we stand at third or fourth place on the world steelmaking victory podium.
To make these many tons (for our regulation 60 kilos per year ration) it takes a gigantic quantity of raw material. A ton of steel produced in a basic oxygen furnace (which is how 42% of our steel is made) requires 0.96 ton of liquid hot metal (this in turn comes from 1.6 ton of iron ore and 0.6 ton of coking coal) and 0.2 ton of steel scrap. A ton of steel produced in an electric-arc furnace (58% of steel is made this way in India) requires around 0.85 tons of steel scrap and supplementary material amounting to about 0.3 tons (the coal having been burnt in the thermal power plant elsewhere).
What justification can Minister Tomar and his associates provide for this mad project to enclose all Indians in choking suits of armour? it comes from the world’s foremost ironmongers, speaking through their association: “The impact of urbanisation will have a key role to play in the future. It is estimated that a little more than one billion people will move to towns and cities between now and 2030. This major flow will create substantial new demand for steel to be used in infrastructure developments such as water, energy and mass transit systems as well as major construction and housing programmes.” And there we have it – the urbanisation obsession of India translated into ever heavier per capita allotments of metal, and to hell with the trees and the hills.
No Shri Javadekar, India won’t gamble with carbon

Coal will account for much of India’s energy for another generation. How does the BJP calculate its ‘value’ at international climate talks? Image: PTI/Deccan Chronicle
There is a message New Delhi’s top bureaucrats must listen to and understand, for it is they who advise the ministers. The message has to do with climate change and India’s responsibilities, within our country and outside it. This is the substance of the message:
1. The Bharatiya Janata Party-led National Democratic Alliance government must stop treating the factors that contribute to climate change as commodities that can be bartered or traded. This has been the attitude of this government since it was formed in May 2014 – an attitude that says, in sum, ‘we will pursue whatever GDP goals we like and never mind the climate cost’, and that if such a pursuit is not to the liking of the Western industrialised world, India must be compensated.
2. Rising GDP is not the measure of a country and it is not the measure of India and Bharat. The consequences of pursuing rising GDP (which does not mean better overall incomes or better standards of living) have been plain to see for the better part of 25 years since the process of liberalisation began. Some of these consequences are visible in the form of a degraded natural environment, cities choked in pollution, the rapid rise of non-communicable diseases, the economic displacement of large rural populations. All these consequences have dimensions that deepen the impacts of climate change within our country.
3. There are no ‘terms of trade’ concerning climate change and its factors. There is no deal to jockey for in climate negotiations between a narrow and outdated idea of GDP-centred ‘development’ and monetary compensation. The government of India is not a broking agency to bet a carbon-intensive future for India against the willingness of Western countries to pay in order to halt such a future. This is not a carbon casino and the NDA-BJP government must immediately stop behaving as if it is.
 The environment minister, Prakash Javadekar, has twice in March 2015 said exactly this: we will go ahead and pollute all we like in the pursuit of our GDP dream – but if you (world) prefer us not to, give us lots of money as compensation. Such an attitude and such statements are to be condemned. That Javadekar has made such a statement is bad enough, but I find it deeply worrying that a statement like this may reflect a view within the NDA-BJP government that all levers of governance are in fact monetary ones that can be bet, like commodities can, against political positions at home and abroad. If so, this is a very serious error being made by the central government and its advisers.
Javadekar has most recently made this stand clear in an interview with a foreign news agency. In this interview (which was published on 26 March 2015), Javadekar is reported to have said: “The world has to decide what they want. Every climate action has a cost.” Worse still, Javadekar said India’s government is considering the presentation of a deal – one set of commitments based on internal funding to control emissions, and a second set, with deeper emissions cuts, funded by foreign money.
Earlier in March, during the Fifteenth Session of the African Ministerial Conference on Environment (in Cairo, Egypt), Javadekar had said: “There has to be equitable sharing of the carbon space. The developed world which has occupied large carbon space today must vacate the space to accommodate developing and emerging economies.” He also said: “The right to development has to be respected while collectively moving towards greener growth trajectory.”
Such statements are by themselves alarming. If they also represent a more widespread view within the Indian government that the consequences of the country following a ‘development’ path can be parleyed into large sums of money, then it indicates a much more serious problem. The UNFCCC-led climate change negotiations are infirm, riddled with contradictions, a hotbed of international politics and are manipulated by finance and technology lobbies.
 It remains on paper an inter-governmental arrangement and it is one that India is a part of and party to. Under such circumstances, our country must do all it can to uphold moral action and thinking that is grounded in social and environmental justice. The so-called Annex 1 countries have all failed to do so, and instead have used the UNFCCC and all its associated mechanisms as tools to further industry and foreign policy interests.
It is not in India’s nature and it is not in India’s character to to the same, but Javadekar’s statement and the government of India’s approach – now made visible by this statement – threatens to place it in the same group of countries. This is a crass misrepresentation of India. According to the available data, India in 2013 emitted 2,407 million tons of CO2 (the third largest emitter behind the USA and China). In our South Asian region, this is 8.9 times the combined emissions of our eight neighbours (Pakistan, 165; Bangladesh, 65; Sri Lanka, 15; Myanmar, 10; Afghanistan, 9.4; Nepal, 4.3; Maldives, 1.3; Bhutan, 0.7).
When we speak internationally of being responsible we must first be responsible at home and to our neighbours. Javadekar’s is an irresponsible statement, and is grossly so. Future emissions are not and must never be treated as or suggested as being a futures commodity that can attract a money premium. Nor is it a bargaining chip in a carbon casino world. The government of India must clearly and plainly retract these statements immediately.
Note – according to the UNFCCC documentation, “India communicated that it will endeavour to reduce the emissions intensity of its GDP by 20-25 per cent by 2020 compared with the 2005 level. It added that emissions from the agriculture sector would not form part of the assessment of its emissions intensity.”
“India stated that the proposed domestic actions are voluntary in nature and will not have a legally binding character. It added that these actions will be implemented in accordance with the provisions of relevant national legislation and policies, as well as the principles and provisions of the Convention.”
The slowing motion of India’s quick mobility

This is a chart whose lines drift downwards as time goes by, quite the opposite of all the usual depictions of India’s rising GDP, rising income, rising purchasing power, and so on. But in the two dropping lines is the proof that India’s households are tying themselves up in stifling vehicular knots.
This chart shows what we call two-wheelers (scooters and motor-cycles) and cars (four-wheeled passenger vehicles, formally). It also shows number of households and a span of 20 years. The two lines show the number of households to a car (the orange line) and the number of households to a two-wheeler (the blue line). As there are many more two-wheelers than there are cars, they are on different scales, so the left axis is for the two-wheelers and the right for cars.
 I have taken the data from two sources. One is the Census of India, for the census years 2011, 2001 and 1991. The other is the Road Transport Yearbook (2011-12) issued by the Transport Research Wing, Ministry Of Road Transport and Highways, Government Of India. The yearbook includes a table with the total number of registered vehicles (in different categories of vehicle – two-wheelers, cars, buses, goods vehicles, others) for every year. The number of households is from the census years, with simple decadal growth applied annually between census years. I have not yet found the detailed data that will let me refine this finding between urban and rural populations.
This is what the chart says: in 1992, there were 10 households to a two-wheeler and 48.7 households to a car. Ten years later in 2002 there were 4.8 households to a two-wheeler and 26.2 households to a car. Another ten years later in 2012 there were 2.2 households to a two-wheeler and 11.8 households to a car.
 The implications are several and almost all of them are an alarm signal. Especially for urban areas – where most of the buying of vehicles for households has taken place – the physical space available for the movement of people and goods has increased only marginally, but the number of motorised contrivances (cars, motor-cycles, scooters and more recently stupidly large SUVs and stupidly large and expensive luxury cars) has increased quickly. Naturally this ‘growth’ of wheeled metal has choked our city wards.
But there are other implications. One is the very idea of individual mobility in and through a town or city. The connection – foolishly maintained by one government after another, and foolishly defended by macro-economists and industrial planners – between the automobile industry and gross domestic product (GDP) has crippled common sense.
 More motorised conveyance per household also means more fuel demanded per household, and more fuel (and money) wasted because households are taught (by the auto industry with the encouragement of the foolish cohorts I mentioned earlier) that they are entitled to wasteful personal mobility. Over 20 years, the number of cars per household has increased 4.1 times but the number of buses per household has increased only 2.8 times. That is embarrassing proof of our un-ecological and climate unfriendly new habits.
In 2012, there were 1.67 million buses (of all kinds and configurations), there were 7.65 million goods vehicles (to move all those appliances demanded by households, food crops, fertiliser, retail food, etc), 13.16 million other vehicles (which as the ministry says “include tractors trailers, three-wheelers (passenger vehicles)/LMV and other miscellaneous vehicles which are not classified separately”), 21.56 million cars (including jeeps and taxis), and 115.41 million two-wheelers. There are far too many of some kinds and not enough of others. More than 20 years after ‘liberalisation’ began, India’s household mobility is crawling along in first gear for having made too many wrong choices.
The fuel favour year for India
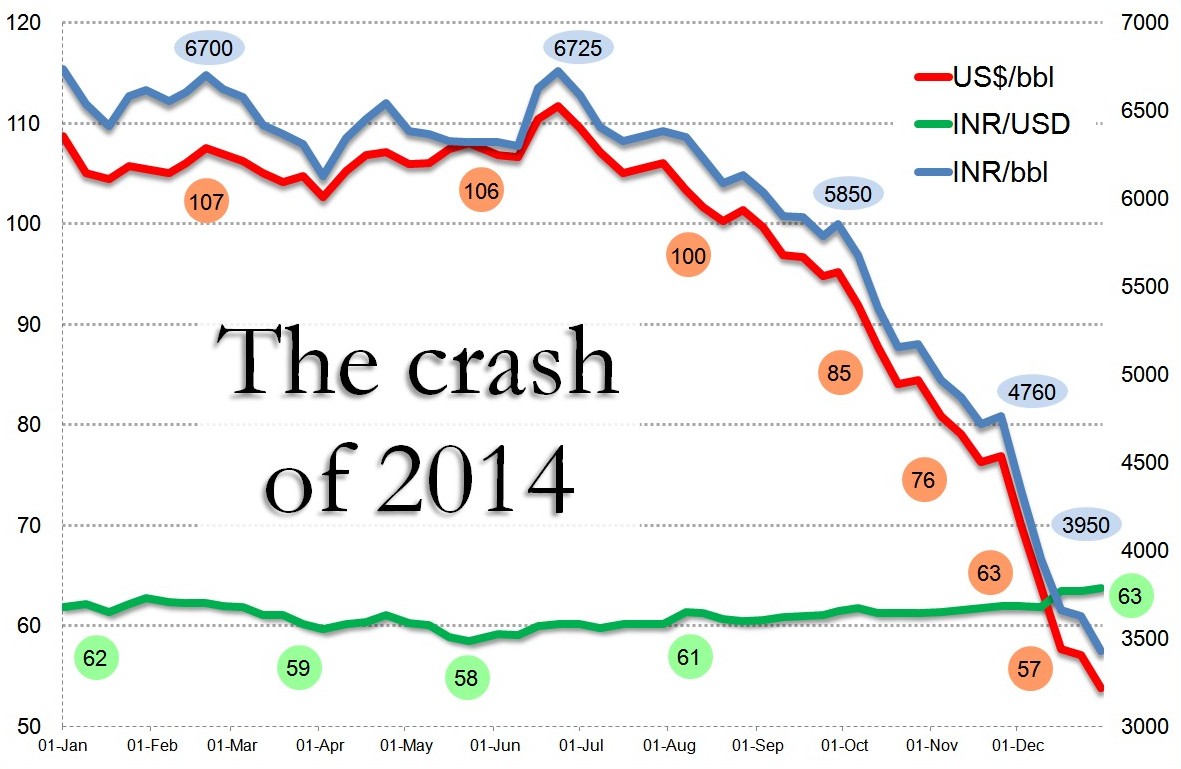
The US$ per barrel (red line) and the rupee-dollar exchange rate (green line) are plotted to the left scale. The rupee per barrel (blue line) is plotted to the right scale. I have used data from the Petroleum Planning and Analysis Cell of the Ministry of Petroleum and Natural Gas – the global crude oil price of the ‘Indian Basket’ in US$ per barrel.
It started in early August, the extraordinary slide in petroleum prices. Until then, the international crude oil price of the ‘Indian Basket’ (of crude oils, as it is called) had swung between US$ 110 and US$ 105 per barrel.
The rupee-dollar exchange rate, and the effective price of a barrel of crude oil in Indian rupees (both measures also appear on this chart), fluctuated but little for most of the first half of 2014. In early June 2014, the rupee-dollar rate turned around from 59 and has been rising since, while in early July the rupee price per barrel descended from its plateau of 6,300-6,600 and has been dropping since.
The cost of oil-derived energy has had a number of effects upon our everyday lives in the second half of 2014. It has helped the new NDA-BJP government during its first year by dampening overall inflation (the consumer price index) and particularly food price inflation. This has been particularly fortunate for the NDA-BJP government as the deficient monsoon of 2014 has meant a drop in the production of food staples, and market forces being what they are, food price inflation especially would have been well into the 13%-14% range (last quarter 2014 compared with last quarter 2013).
 Galloping consumer price inflation has been forestalled by the plunging price of crude oil. The data I have used for this startling chart is courtesy the Petroleum Planning and Analysis Cell (PPAC) of the Ministry of Petroleum and Natural Gas which computes several times a week the “global crude oil price of Indian Basket in US$ per bbl” – which means the average price we pay per barrel for the various kinds of crude oil we purchase.
A barrel of crude oil is 42 gallons or around 159 litres. This crude, when refined, is turned into diesel, petrol, lighter fuels, feedstock for the manufacture of various plastics, and other products. Typically, up to 70% of the oil we buy is converted into diesel and petrol (and carbon from all those exhaust pipes). Also typically, a barrel of crude oil (which is an extremely dense form of packaged energy) contains around 5.8 million BTUs (British thermal units). More familiar to us is the kilowatt hour (or kWh) and these 5.8 million BTUs are about 1,700 kWh – at current national average rates of per head electricity consumption this is worth about 26 months of electricity!
From early August till the end of December the price we paid for a barrel of crude has dropped from around US$ 103 to US$ 54 and correspondingly (factoring in the rupee-dollar exchange rate) the rupee price of a barrel of crude has dropped from 6,300 to around 3,500. Put another way, the INR 6,300 we paid in early August for 5.8 million BTU could buy, in mid-October 7.1 million BTU and by end-December, 10.4 million BTU.
Most of us tend not to be profligate with energy (our electricity comes mainly from the burning of coal, but the sale of automobiles has continued at a steady pace, or so the industry tells us). The question is whether this windfall energy saving (in terms of petroleum energy units per rupee) has been well used by the sector that can spread the benefit the most – agriculture and food. It will take another three months to judge, and we will keep a wary eye for the next quarter on the Indian crude oil Basket.
Why the FAO food index is also an oil gauge

The revealing relationship between the FAO cereals price sub-index, the OPEC Reference Basket price of a barrel of crude oil, and the Baltic Dry Index (right scale).
The Food and Agriculture Organisation (FAO) of the UN has released its food price index data and commentary for 2014 October. This would be of considerable interest if only the index described the tendencies of food prices as experienced by consumers. Alas FAO’s food price index, as we have remarked upon several times in the past, pays no attention to the true cost of food staples.
Of what use is the FAO index, which is used as a reference by any government (and UN member state) to judge the value of its food exports (or to judge whether when importing grain it is paying what seems to be a fair price)? In the first place, the index (which itself is composed of separately calculated cereal, vegetable oil, dairy, meat and sugar indices) is not a consumer food price index.

The FAO food price index and its component sub-indices for the period 2012 January to 2014 October. A general downward trend, says the FAO, but this is the picture for international food trade and not consumer food retail price.
The FAO has not claimed it is, but neither has the agency clearly and plainly said it is not. It should, because financial and general interest media all over the world report the ups and downs of this index as if it portrays how local food prices move, and of course it does not.
The FAO index is used by international traders whose business it is to buy and sell food staples (including cereal, vegetable oil, pulses, dairy, meat and sugar). Perhaps some of them use it as a benchmark while others forecast trends from its sub-indices. It may be used to validate the accuracy of a particular kind of agricultural commodity futures index, and help judge whether an investment in the production of food, its movement, its stocking or its trade is going to be a good investment or not. As you can gather, it is not an index that consumers can use, because consumers are local and this is assuredly not.
What pulls the FAO food price index up, down or sideways? There are two important factors at work on the main index. One is the price of petroleum products, the other is the cost of moving grain (or any other food staple). You may assess the short or long-term trend of the food index against the current or projected price of Brent crude (preferred in Europe), West Texas Intermediate (preferred in the USA) or the OPEC reference price (preferred almost everywhere else).

The FAO food price index and its component sub-indices for 2014 till October. The downward trend of the last six months, which the FAO commentary is faintly praising, mirrors the trend of crude oil prices over the same period.
And then you will assess what the food price index describes against the cost of moving a large quantity of the agricultural commodity to be traded across an ocean, for which the Baltic Dry Index will be consulted.
[If you are a trader and want the FAO food price data and movements, go here. The usual commentary can be found: “The FAO Food Price Index averaged 192.3 points in October 2014, marginally (0.2 percent) below the revised September figure but 14.3 points (6.9 percent) short of its corresponding level one year ago” and so on.]
To help determine what the FAO food price index is depicting, I have made charts for the index (and sub-indices) for the period 2012 January to 2014 October; for the index (and sub-indices) for 2014 till October; a chart that shows the FAO cereals sub-index together with the OPEC Reference Basket Price for a barrel of crude oil and the Baltic Dry Index (this is the shipping index most commonly referred to for the movement of dry goods by sea) for the period 2012 January to 2014 October; and a chart that plots the changes (from month to month) in the three indexes taken together (FAO Cereals, OPEC Reference and Baltic Dry).

The FAO food price index and the OPEC Reference Basket price of oil have much more in common than the Baltic Dry Index, which has swung with volatility since 2012 January.
What they describe can be found in the captions, but it becomes clear from a glance at the FAO-OPEC-Baltic charts that the food price as calculated by FAO has very much more to do with how energy is used to produce food staples (that is, the use of petroleum products directly, and the use of fossil fuels-derived energy) and how energy is used to transport, store, process, transport it again and retail it.
I see it as an index that describes the energy quotient of industrially produced food staples, and so it has little if anything to do with any other form of agriculture, in particular the smallholder, family-oriented and organic agriculture that the FAO advertises its concern about.
India’s giant megawatt trap

A panel of charts that show India’s energy consumption, imports, and dependence on fossil fuel.
Electricity as fundamental right and energy convenience as the basis of ‘development’ in Bharat and in India. If this is what Piyush Goyal means when he says his government is “is committed to ensure affordable 24×7 power” then it will come as yet another commitment that supports energy provision and consumption as the basis for determining the well-being of Bharat-vaasis and Indians (the UPA’s Bharat Nirman was the predecessor). But the Minister of State (Independent Charge) for Power, Coal and New and Renewable Energy cannot, using such a promise, ignore the very serious questions about the kind of ‘development’ being pursued by the NDA-BJP government and its environmental and social ramifications. [This article is also posted at the India Climate Portal.]
Goyal has said, via press conferences and meetings with the media, that the NDA government is committed to ensuring affordable power at all times (’24 x 7′ is the expression he used, which must be banished from use as being a violent idea – like nature our lives follow cycles of work and rest and ’24 x 7′ violently destroys that cycle). Goyal has promised, pending the taking of a series of steps his ministry has outlined, that such a round the clock provision of electric power will be extended to “all homes, industrial and commercial establishments” and that there will be “adequate power for farms within five years”.

The summary of India’s power generation capacity, by type and by region. Source for data: Central Electricity Authority
Some of the very serious questions we raise immediately pertain to what Goyal – with the help of senior ministry officials and advisers – has said. The NDA-BJP government will spend Rs 75,600 crore to (1) supply electricity through separate feeders for agricultural and rural domestic consumption, said Goyal, which will be used to provide round the clock power to rural households; and (2) on an “integrated power development initiative” which involves strengthening sub-transmission and distribution systems in urban areas. This is part of the “transformative change” the ministry has assured us is for the better. Goyal and his officials see as a sign of positive transformation that coal-based electricity generation from June to August 2014 grew by nearly 21 per cent (compared with the same months in 2013), that coal production is 9% higher in August 2014 compared with August 2013, and that Coal India (the largest coal producer company in the world which digs out 8 of every 10 tons of coal mined in India) is going to buy 250 more goods rakes (they will cost Rs 5,000 crore) so that more coal can be moved to our coal-burning power plants.
 We must question the profligacy that the Goyal team is advancing in the name of round the clock, reliable and affordable electricity to all. To do so is akin to electoral promises that are populist in nature – and which appeal to the desire in rural and urban residents alike for better living conditions – and which are entirely blind to the environmental, health, financial and behavioural aspects attached to going ahead with such actions. In less than a fortnight, prime minister Narendra Modi (accompanied by a few others) will attend the United Nations Climate Summit 2014. Whether or not this summit, like many before it, forces governments to stop talking and instead act at home on tackling anthropogenic climate change is not the point. What is of concern to us is what India’s representatives will say about their commitment to reduce the cumulative impact of India’s ‘development’, with climate change being a part of that commitment. [Please see the full article on this page.]
Retiring the American dollar

Off into history’s sunset, like the cowboy. This image (modified) is called ‘Dollar Green’ by the artist mancaalberto (http://mancaalberto.deviantart.com/)
Seventy years ago, to the very month, a man named Henry Morganthau celebrated the creation of a “dynamic world community in which the peoples of every nation will be able to realise their potentialities in peace”. It was the founding of what came to be called the Bretton Woods institutions (named after the venue for the meeting, in the USA) and these were the International Bank for Reconstruction and Development – better known as the World Bank – and the International Monetary Fund.
None of the lofty aims that seemed so apposite in the shattering aftermath of the Second World War have been achieved, although what has been written are libraries of counter-factual history that claim such achievements (and more besides) commissioned by both these institutions and their web of supporting establishments, financial, academic, political and otherwise. Instead, for the last two generations of victims of ‘structural adjustment’, and of ‘reform and austerity’ all that has become worthwhile in the poorer societies of the world has been achieved despite the Bretton Woods institutions, not because of them.
Now, seventy years after Morganthau (the then Treasury Secretary of the USA) and British economist John Maynard Keynes unveiled with a grey flourish a multi-lateral framework for international economic order, the Bretton Woods institutions are faced with a challenge, and the view from East and South Asia, from Latin America and from southern Africa is that this is a challenge that has been overdue for too long.

Let’s get the de-dollarisation of the world started.
It has come in the form of the agreement between the leaders of five countries to form a development bank. Russia’s President Vladimir Putin, China’s President Xi Jinping, India’s Prime Minister Narendra Modi, Brazilian President Dilma Rousseff and South Africa’s President Jacob Zuma made formal their intention during the sixth summit of their countries – together called ‘BRICS’, after the first letters of their countries’ names – held this month in Brazil.
What has been set in motion is the BRICS Development Bank and the BRICS Contingency Reserves Arrangement. Both the new institution and the new mechanism will counter the influence of Western-based lending institutions and the American dollar, which is the principal reserve currency used internationally and which is the currency that the IMF and the World Bank conduct their ruthless business in (and which formulate their policies around, policies that are too often designed to impoverish the working class and to cripple labour).
At one time or another, and not always at inter-governmental fora, the BRICS have objected to the American dollar continuing to be the world’s principal reserve currency, a position which amplifies the impact of policy decisions by the US Federal Reserve – the American central bank – on all countries that trade using dollars, and which seek capital denominated in dollars. These impacts are, not surprisingly, ignored by the Federal Reserve which looks after the interests of the American government of the day and US business (particularly Wall Street).
In the last two years particularly, non-dollar bilateral agreements have become more common as countries have looked for ways to free themselves from the crushing Bretton Woods yoke. Only this June, Russia’s finance minister said the central banks of Russia and China would discuss currency swaps for export payments in their respective national currencies, a direction that followed Putin’s visit to China the previous month to finalise the gigantic US$400 billion deal between Gazprom and China National Petroleum Corporation (CNPC). It is still early, and the BRICS will favour caution over hyperbole, but when their bank opens for business, the sun will begin to set on the US dollar.
Holding our breath in India’s cities

India’s cities and PM2.5 – the official response has been to reject the WHO findings
The findings by the World Health Organisation on the quality of air in India’s cities are the strongest signal yet to our government (old and new, for the results of the 2014 general election will become known on 16 May) that economic ‘growth’ is a weapon that kills citizens through respiratory tract diseases and infections.
Amongst the 124 Indian cities in the new WHO database on urban air quality worldwide, one city only is at the WHO guideline for PM2.5 and one city only is just above the guidelines for PM10. As a bloc, the quality of air in India’s cities are at alarmingly high levels above the guidelines, above Asian averages (poor as they are, and even considering China’s recklessly poor record) and above world averages.
This is not a singular matter. Already, the WHO has warned that India has a high environmental disease burden, with a significant number of deaths annually associated with environmental risk factors. The Global Burden of Disease for 2010 ranked ambient air pollution as the fifth largest killer in India, three places behind household air pollution. Taken cumulatively, household and ambient air pollution constitute the single greatest risk factor that cause ill health -leading to preventable deaths – in India.
The WHO database contains results of ambient (outdoor) air pollution monitoring. Air quality is represented by ‘annual mean concentration’ (a yearly average) of fine particulate matter (PM10 and PM2.5, which means particles smaller than 10 or 2.5 microns). The WHO guideline values are: for PM2.5 – 10 micrograms/m3 annual mean; for PM10 – 20 micrograms/m3 annual mean. The two charts show just how dangerously above the WHO guidelines the air quality of our cities are.

India’s cities and PM10 – it is the latest amongst many signs that India’s GDP growth fever is a killer.
Half of India’s urban population lives in cities where particulate pollution levels exceed the standards considered safe. A third of this population breathes air having critical levels of particulate pollution, which is considered to be extremely harmful. “We are also running out of ‘clean’ places. Small and big cities are now joined in the pain of pollution,” commented Down To Earth, the environment magazine.
Typically, the official Indian response was to question the WHO findings (these were carried out in the same way in 91 countries, and we don’t hear the other 90 complaining) and to reject them. The reason is easy to spot. Global offender Number One for air pollution amongst world cities is New Delhi, a city that has been pampered as the showcase for what the Congress government myopically calls “the India growth story”.
Hence government scientists are reported to have quickly said that WHO overestimated air pollution levels in New Delhi. “Delhi is not the dirtiest… certainly it is not that dangerous as projected,” said A B Akolkar, a member secretary of the Central Pollution Control Board.
The same recidivist line was parroted by Gufran Beig, chief project scientist at the Indian Institute of Tropical Meteorology (which otherwise does good work on the monsoon and on climate change). He is reported as having said that New Delhi’s air quality was better than Beijing’s, and that pollution levels in winter are relatively higher in New Delhi because of extreme weather events. Beig said: “The value which has been given in this (WHO) report is overestimating (pollution levels) for Delhi … the reality is that the yearly average is around 110 (micrograms).”
The WHO database has captured measurements from monitoring stations located in urban background, residential, commercial and mixed areas. The world’s average PM10 levels by region range from 26 to 208 micrograms/m3, with a world average of 71 micrograms/m3.
PM affects more people than any other pollutant. The major components of PM are sulfate, nitrates, ammonia, sodium chloride, black carbon, mineral dust and water. It consists of a complex mixture of solid and liquid particles of organic and inorganic substances suspended in the air. The most health-damaging particles are those with a diameter of 10 microns or less, which can penetrate and lodge deep inside the lungs. Chronic exposure to particles contributes to the risk of developing cardiovascular and respiratory diseases, as well as of lung cancer.
Central and state governments show no inclination to join the obvious dots. These are, that with more fuels being burned to satisfy the electricity and transport needs of a middle class now addicted to irresponsible consumption, the ‘India growth story’ is what we are choking to death on.
IPCC to world: stop and shrink, or perish

The language is clear and blunt. The message continues to be, as it was in 2013 September, that our societies must change urgently and dramatically. The evidence marshalled is, when compared with the last assessment report of 2007, mountainous and all of it points directly at the continuing neglect of our societies to use less and use wisely.
This Fifth Assessment Report (AR5) by the Intergovernmental Panel on Climate Change (IPCC) comes seven years after the last. It has said that observed impacts of climate change have already affected agriculture, human health, ecosystems on land and in the oceans, water supplies, and livelihoods. These impacts are occurring from the tropics to the poles, from small islands to large continents, and from the wealthiest countries to the poorest.

“There is increasing recognition of the value of social, institutional, and ecosystem-based measures and of the extent of constraints to adaptation”. Image: IPCC
“Climate change has negatively affected wheat and maize yields for many regions and in the global aggregate. Effects on rice and soybean yield have been smaller in major production regions and globally, with a median change of zero across all available data, which are fewer for soy compared to the other crops. Observed impacts relate mainly to production aspects of food security rather than access or other components of food security. Since AR4, several periods of rapid food and cereal price increases following climate extremes in key producing regions indicate a sensitivity of current markets to climate extremes among other factors.”
The IPCC’s Fifth Assessment Report (AR5) contains contributions from three Working Groups. Working Group I assesses the physical science basis of climate change. Working Group II assesses impacts, adaptation, and vulnerability, while Working Group III assesses the mitigation of climate change. The Synthesis Report draws on the assessments made by all three Working Groups.
The Working Group II AR5 considers the vulnerability and exposure of human and natural systems, the observed impacts and future risks of climate change, and the potential for and limits to adaptation. The chapters of the report assess risks and opportunities for societies, economies, and ecosystems around the world.

Widespread impacts in a changing world. Global patterns of impacts in recent decades attributed to climate change, based on studies since the AR4 (in 2007). Impacts are shown at a range of geographic scales. Symbols indicate categories of attributed impacts, the relative contribution of climate change (major or minor) to the observed impact, and confidence in attribution. Graphic: IPCC
“Differences in vulnerability and exposure arise from non-climatic factors and from multidimensional inequalities often produced by uneven development processes. These differences shape differential risks from climate change. People who are socially, economically, culturally, politically, institutionally, or otherwise marginalised are especially vulnerable to climate change and also to some adaptation and mitigation responses. This heightened vulnerability is rarely due to a single cause. Rather, it is the product of intersecting social processes that result in inequalities in socioeconomic status and income, as well as in exposure. Such social processes include, for example, discrimination on the basis of gender, class, ethnicity, age, and (dis)ability.”

“Risk of food insecurity and the breakdown of food systems linked to warming, drought, flooding, and precipitation variability and extremes, particularly for poorer populations in urban and rural settings.” Chart: IPCC
The Working Group 2 report has said that impacts from recent climate-related extremes (such as heat waves, droughts, floods, cyclones, and wildfires) reveal significant vulnerability and exposure of some ecosystems and many human systems to current climate variability. The impacts of such climate-related extremes include alteration of ecosystems, disruption of food production and water supply, damage to infrastructure and settlements, morbidity and mortality, and consequences for mental health and human well-being. The WG2 has starkly said that for countries at all levels of development, these impacts are consistent with a significant lack of preparedness for current climate variability in some sectors.
“Climate-related hazards exacerbate other stressors, often with negative outcomes for livelihoods, especially for people living in poverty. Climate-related hazards affect poor people’s lives directly through impacts on livelihoods, reductions in crop yields, or destruction of homes and indirectly through, for example, increased food prices and food insecurity. Observed positive effects for poor and marginalised people, which are limited and often indirect, include examples such as diversification of social networks and of agricultural practices.”
Here is how the Working Group II report, and it’s a hefty one indeed, has been organised.

“With increasing warming, some physical systems or ecosystems may be at risk of abrupt and irreversible changes.” Chart: IPCC
Volume 1 is called ‘Global And Sectoral Aspects’. Its sections and chapters are: Context for the AR5 (01-Point of departure, 02-Foundations for decision making), Natural and Managed Resources and Systems, and Their Uses (03-Freshwater resources, 04-Terrestrial and inland water systems, 05-Coastal systems and low-lying areas, 06-Ocean systems, 07-Food security and food production systems), Human Settlements, Industry, and Infrastructure (08-Urban Areas, 09-Rural Areas, 10-Key economic sectors and services), Human Health, Well-Being, and Security (11-Human health: impacts, adaptation, and co-benefits, 12-Human security, 13-Livelihoods and poverty), Adaptation (14-Adaptation needs and options, 15-Adaptation planning and implementation, 16-Adaptation opportunities, constraints, and limits, 17-Economics of adaptation), Multi-Sector Impacts, Risks, Vulnerabilities, and Opportunities (18-Detection and attribution of observed impacts, 19-Emergent risks and key vulnerabilities, 20-Climate-resilient pathways: adaptation, mitigation, and sustainable development).
Volume 2 is called ‘Regional Aspects’. Its chapters are: 21-Regional context, 22-Africa, 23-Europe, 24-Asia, 25-Australasia, 26-North America, 27-Central and South America, 28-Polar Regions, 29-Small Islands, 30-The Ocean. There is also ‘Summary Products’ which contains: a Technical Summary and WGII AR5 Volume-wide Frequently Asked Questions. There is ‘Cross-Chapter Resources’ which contains: a Glossary, WGII AR5 Chapter-specific FAQs, Cross-chapter box compendium. Finally there is ‘Edits to the Final Draft Report’ which contains: Changes to the Underlying Scientific/Technical Assessment, List of Substantive Edits.
Stop selling your nuclear monster to India, Mr Abe

How green do our becquerels glow. Shinzo Abe and Manmohan Singh in New Delhi, 2014 January. Photo: Press Information Bureau, Government of India
The Japanese salesman has come and gone, leaving behind him not the whiff of cherry blossoms but the stench of radiation. Shinzo Abe the prime minister of Japan, sipped tea with his host and counterpart in India, Manmohan Singh, as they watched the Republic Day parade together. The future of republics (indeed of democratic principles) must have been a distant matter for these two prime ministers, both glowing with a renewed nuclear fervour.
For, although the long history of accidents at nuclear facilities is painfully evident to all those of us who have lived through an era that included Three Mile Island, Chernobyl and Fukushima, Prime Ministers Abe and Singh promised to “make our nuclear power generation increasingly safe” and to “ensure that the safety and livelihoods of people are not jeopardised in our pursuit of nuclear power”. Who is the “our”, we ask. And because neither can answer, Abe’s visit was met with widespread protests.
In his letter, made public, eminent Gandhian Narayan Desai wrote to Abe: “People of India have learnt from the experience of nuclear power over the last six decades. Local communities have overwhelmingly opposed nuclear projects despite persistent government propaganda … Developing closer relations between our two countries is a desirable goal. However, for this to happen on a healthy durable basis, it is necessary that people’s wishes are listened to and their long term interests protected. Selling nuclear components to help facilitate setting up of nuclear power plants is not the way. This is doubly so, when India has not signed the Nuclear Non-proliferation Treaty and is actively engaged in the production of nuclear weapons. The well-being of future generations should not be sacrificed for short term commercial gains.”

In the ‘Jaitapur Times’, a resistance newspaper in Marathi printed in the district where the Jaitapur nuclear power plant is being opposed, a protest banner is reproduced.
More comprehensively, in ‘Resisting Abe’s Sales Pitch’, M V Ramana (Programme on Science and Global Security, Woodrow Wilson School of Public and International Affairs, Princeton University and author of ‘The Power of Promise: Examining Nuclear Energy in India‘ (Penguin 2012)) has said that “Abe’s democratic credentials are evident from his various attempts at peddling reactors despite this overwhelming opposition. One outcome of Abe’s globe-trotting atomic roadshow was an agreement with Turkey’s Recep Tayyip Erdogan, another head of state who doesn’t seem to be particularly concerned about democratic sentiment, to sell two nuclear reactors. The majority of the Turkish public too opposes the construction of nuclear power plants.”
Abe must have warmly appreciated the technique of Prime Minister Manmohan Singh (ably abetted by a ministers’ cabinet intent on gutting the country of its natural resources, witness the triumphant pronouncements by Veerappa Moily, the Minister for the Destruction of the Environment who is also the Minister of Petroleum and Natural Gas) who is skilled at replacing one bland statement with another opaque one and in this case he said, “Our negotiations towards an agreement for cooperation in the peaceful uses of nuclear energy have gained momentum in the last few months”.
But apart from the boring boilerplate statements, Manmohan Singh has presented himself as the South Asian buyer of what the then Japanese Prime Minister Naoto Kan called “a mutually satisfactory agreement for civil nuclear cooperation at an early date”. That the Japanese chair is filled by someone else now is of little consequence, for the position of Japan’s PM is to be an enthusiastic salesman for the country’s biggest businesses – high-speed rail, nuclear power and water-related infrastructure systems. [See the whole gamut of scary capitalist high-technology and anti-democratic partnership-mongering outlined here.]

The front page of the ‘Jaitapur Times’, a resistance newspaper in Marathi printed in the district where the Jaitapur nuclear power plant is being opposed.
The slow-motion nuclear meltdown that is taking place at Fukushima Daichi had prompted Kan to say that Japan should aim to be “a society without nuclear power”. But in India, inconveniently for a Japanese salesman PM and our own salesman PM, there is now significant opposition to nuclear power, especially at all the sites that have been selected for installing reactors imported from companies like Westinghouse, General Electric and Areva.
We have been educated by honest truth from within Japan itself, like the testimony of a Japanese engineer who helped build reactor 4 at the Fukushima No. 1 nuclear plant and who said such plants are inherently unstable, urging Taiwan to ditch atomic energy for renewable resources. Our public opposition knows well that the primary motivation for a nuclear agreement between Japan and India dates back to the US-India nuclear deal. M V Ramana has reminded us that in 2008, William Burns, a senior American diplomat, told the Senate of his country that as its part of the bargain, the Manmohan Singh (UPA) government had “provided the United States with a strong Letter of Intent, stating its intention to purchase reactors with at least 10,000 megawatts (MW) worth of new power generation capacity from U.S. firms [and] has committed to devote at least two sites to U.S. firms”.
These are the deals struck in secret – whose grossly anti-democratic nature Abe and Singh were upholding as they watched soldiers from India’s most decorated regiments march down Rajpath – and here was a salesman who only a few months earlier had midwived a secrecy act that would make unlawful the release of information about the situation at Fukushima. In Japan itself, some of its most famous scientists, including Nobel laureates Toshihide Maskawa and Hideki Shirakawa, have led the opposition against this new state secrecy legislation with 3,000 academics signing a public letter of protest. These scientists and academics declared the government’s secrecy law a threat to “the pacifist principles and fundamental human rights established by the constitution and should be rejected immediately”.
The sites promised to American firms, said Ramana, are Mithi Virdi in Gujarat and Kovvada in Andhra Pradesh. We also know thanks to Wikileaks that in 2007, former Chairman of the Atomic Energy Commission, Anil Kakodkar told a nuclear trade delegation from the US-India Business Council that “the Jaitapur site in southern Maharashtra would go to the French”. Now, the salient point is that all of these reactors need key components produced in Japan and the Japanese government has to formally allow these exports.
Abe’s Republic Day sales trip has come soon after the Tokyo Electric Power Company (TEPCO) acknowledged (was forced to, and did so, shamelessly and for the first time, nearly three years after
the accident started), that water was leaking from the reactor containment vessel in Unit 3 of the Fukushima Daiichi Nuclear Plant. According to Tatsujiro Suzuki the vice chairman of the Japan Atomic Energy Commission (JAEC), “the leakage is a significant finding [and] could indicate that the Unit 3 containment vessel has significant damage”. Barely a fortnight ago, Japan’s Asahi Shimbun reported that TEPCO has withheld 140 measurements of radioactive strontium levels taken in groundwater and the port of the Fukushima No. 1 nuclear plant between June and November last year. But Prime Merchant Manmohan Singh and his colleagues are intent on completing the US-Japan-India trimurti while the ordinary folk of India are demanding anumukti.
