Posts Tagged ‘crop’
Secrets of the record vegetables harvest
The Ministry of Agriculture’s third advance estimates for the production of horticultural crops in India during 2016-17 has record figures for vegetables and fruit, 176.17 million tons and 93.7 million tons respectively.
The horticultural division counts 22 vegetable classes and a 23rd which includes all others. Likewise 26 classes of fruit and a 27th which includes all other fruit. Unfortunately, the horticultural division does not name these ‘other’ vegetables – which I surmise will include a number of leafy greens, tubers and beans – and which are estimated by the division to have amounted for the year to 23.62 million tons (mt).
In this chart for vegetables the ‘other’ unnamed vegetables are clubbed together with those vegetables whose harvests are individually sizeable (0.2 to 0.7 mt) but under 1 mt: elephant foot yam, mushroom, capsicum and parwal.

What stands out in this record harvest of vegetables is how the total tonnage is distributed. Potato, tomato, onion and brinjal together account for 101.82 mt which is 57% of the total vegetables tonnage. This is an extraordinary concentration. Worse, potato alone is 48.24 mt which is just over 23% of the vegetables total.
This is a hopelessly skewed distribution by weight which I think describes how very far the writ of the snack food manufacturers runs, by governing crop cultivation choices made in the field. Most snacks available today are industrially produced mixtures of vegetable ingredients, with flavours, colourings and food scents chemically added.
So-called contract farming in India began with PepsiCo’s foods division directing the cultivation of potato for its chips. Onions and tomato followed – for the last five years some 2 to 2.5 mt of onions are exported, and tomato makes its way into numerous ketchups and sauces. Both are ‘popular’ snack flavours by themselves. Hence the top three vegetable classes account for nearly 90 million tons together. Compare this quantity with India’s wheat harvest for 2016-17 of 98.38 mt!
To put the total annual quantities of onions (21.72 mt) and tomatoes (19.54) in perspective, 22.95 mt of pulses were grown during 2016-17 and this being not enough to provide our households, a further 6.6 mt was imported during 2016-17 (at a cost of Rs 28,523 crore). This is what irrational crop cultivation choices results in: kisans’ plots are dedicated to the cultivation of a few vegetable staples that serve as raw material for a snack foods industry whose products are nutritionally harmful, whereas those plots could grow pulses and save the country money, besides contributing to balanced diets.
Yet the count of vegetables by the horticulture division of the Ministry of Agriculture does not enumerate even the better-known vegetables that arrive at the mandis, and whose mandi prices are listed by the same ministry.
Their market names are: Alsandikai, Amaranthus, Ashgourd, Balekai, Banana Green, Beetroot, Chapparad Avare, Cluster beans, Colacasia, Coriander, Cowpea, Drumstick, Field Pea, French Beans, Galgal, Ginger, Gram Raw/Chholia, Green Avare, Groundnut pods, Guar, Indian Beans/Seam, Kartali/Kantola, Knool Khol, Little gourd/Kundru, Long Melon/Kakri, Lotus Sticks, Mango Raw, Methi, Mint/Pudina, Ridgeguard/Tori, Round gourd, Season Leaves, Seemebadnekai, Snakegourd, Spinach, Sponge gourd, Squash/Kaddoo, Surat Beans/Papadi, Suvarna Gadde, Thondekai, Tinda, Turnip, and White Pumpkin.
These 43 classes (there are likely more based on seasons and agro-ecological regions) of commonly consumed vegetables, grown all over India, amount to about 22 mt, using the numbers from the third advance estimates for 2016-17. But it is upon the diversity of these lesser, ‘other’ classes of vegetables that the dietary balance of millions of households depends. Yes, the annual vegetables balance sheet for 2016-17 boasts an impressive bottom-line, but the numbers therein don’t add up.
GM and its public sector servants in India

The facade of sophisticated science carries with it an appeal to the technocrats within our central government and major ministries, and to those in industry circles, with the apparently boundless production and yield vistas of biotechnology seeming to complement our successes in space applications, in information technology, in nuclear power and complementing the vision of GDP growth.
Framed by such science, the messages delivered by the biotech MNC negotiators and their compradors in local industry appear to be able to help us fulfil the most pressing national agendas: ensure that food production keeps pace with the needs of a growing and more demanding population, provide more crop per drop, deliver substantially higher yield per acre, certified and high-performing seeds will give farmers twice their income, consumers will benefit from standardised produce at low rates, crops will perform even in more arid conditions, the use of inputs will decrease, and the litany of promised marvels goes on.
Yet it is an all-round ignorance that has allowed such messages to take root and allowed their messengers to thrive in a country that has, in its National Gene Bank over 157,000 accessions of cereals (including 95,000 of paddy and 40,000 of wheat), over 56,000 accessions of millets (the true pearls of our semi-arid zones), over 58,000 accessions (an accession is a location-specific variety of a crop species) of pulses, over 57,000 of oilseeds (more than 10,000 of mustard), and over 25,000 of vegetables.
And even so the National Bureau of Plant Genetic Resources reminds us that while the number of cultivated plant species is “relatively small and seemingly insignificant”, nature in India has evolved an extraordinary genetic diversity in crop plants and their wild relatives which is responsible for every agro-ecological sub-region, and every climatic variation and soil type that may be found in such a sub-region, being well supplied with food.
With such a cornucopia, every single ‘framed by great science’ claim about a GM crop made by the biotech MNCs must fall immediately flat because we possess the crop diversity that can already deliver it. Without the crippling monopolies that underlie the science claim, for these monopolies and licensing traps are what not only drove desi cotton out when Bt cotton was introduced but it did so while destroying farming households.

Without the deadly risk of risk of genetic contamination and genetic pollution of a native crop (such as, GM mustard’s risk to the many varieties of native ‘sarson’). Without the flooding of soil with a poison, glufosinate, that is the herbicide Bayer-Monsanto will force the sale of together with its GM seed (‘Basta’ is Bayer’s herbicide that is analogous to Monsanto’s fatal Glyphosate, which is carcinogenic to humans and destroys other plant life – our farmers routinely intercrop up to three crop species, for example mustard with chana and wheat, as doing so stabilises income).
Whereas the veil of ignorance is slowly lifting, the immediate questions that should be asked by food grower and consumer alike – how safe is it for plants, soil, humans, animals, pollinating insects and birds? what are the intended consequences? what unintended consequences are being studied? – are still uncommon when the subject is crop and food. This is what has formed an ethical and social vacuum around food, which has been cunningly exploited by the biotech MNCs and indeed which India’s retail, processed and packaged foods industry have profited from too.
When in October 2016 our National Academy of Agricultural Sciences shamefully and brazenly assured the Ministry of Environment, Forests and Climate Change on the safety of GM mustard, it did so specifically “To allay the general public concerns”. What followed was outright lies, such as “herbicide is used in the process only in hybrid production plot”, “The normal activity of bees is not affected”, “GE Mustard provides yield advantage”, “no adverse effect on environment or human and animal health”. None of these statements was based on study.
India grows food enough to feed its population ten years hence. What affects such security – crop choices made at the level of a tehsil and balancing the demands on land in our 60 agro-ecological sub-zones and 94 river sub-basins – is still influenced by political position, the grip of the agricultural ‘inputs’ industry on farmers, economic pressures at the household level, and the seasonal cycle. In dealing with these influences, ethics, safety and social considerations are rarely if ever in the foreground. Yet India is a signatory to the UN Convention on Biological Diversity and its Cartagena Protocol on Biosafety, whose Article 17 requires countries to prevent or minimise the risks of unintentional transboundary movements of genetically engineered organisms.
Neither the Genetic Engineering Approval Committee (GEAC), in the case of GM mustard, nor the Department of Biotechnology, the Department of Science and Technology (whose Technology Information, Forecasting and Assessment Council in a 2016 report saw great promise in genetic engineering for India), the Ministries of Environment and Agriculture, the Indian Council of Agricultural Research (ICAR, with its 64 specialised institutions, 15 national research centres, 13 directorates, six national bureaux and four deemed universities), the Council for Scientific and Industrial Research (CSIR) have mentioned ethics, consumer and environment safety, or social considerations when cheering GM.
This group of agencies and institutions which too often takes its cue from the west, particularly the USA (which has since the 1950s dangled visiting professorships and research partnerships before the dazzled eyes of our scientific community) may find it instructive to note that caution is expressed even by the proponents of genetic engineering technologies in the country that so inspires them. In 2016 a report on ‘Past Experience and Future Prospects’ by the Committee on Genetically Engineered Crops, National Academies of Sciences, Engineering, and Medicine of the USA, recognised that the public is sceptical about GE crops “because of concerns that many experiments and results have been conducted or influenced by the industries that are profiting from these crops” and recommended that “ultimately, however, decisions about how to govern new crops need to be made by societies”.
Practices and regulations need to be informed by accurate scientific information, but recent history makes clear that what is held up as unassailable ‘science’ is unfortunately rarely untainted by interests for whom neither environment nor human health matter.
[This is the second part of an article that was published by Swadeshi Patrika, the monthly journal of the Swadeshi Jagran Manch. Part one is here.]
How GM ‘science’ misled India

For the last decade, the reckoning of what agriculture is to India has been based on three kinds of measures. The one that has always taken precedence is the physical output. Whether or not in a crop year the country has produced about 100 million tonnes (mt) of rice, 90 mt of wheat, 40 mt of other cereals (labelled since the colonial era as ‘coarse’ although they are anything but, and these include ragi, jowar, bajra and maize), 20 mt of pulses, 30 mt of oilseeds, and that mountain of biomass we call sugarcane, about 350 mt, therewith about 35 million bales of cotton, and about 12 million bales of jute and mesta.
The second measure is that of the macro-economic interpretation of these enormous aggregates. This is described in terms of gross value added in the agriculture (and allied) sector, the contribution of this sector to the country’s gross domestic product, gross capital formation in the sector, the budgetary outlays and expenditures both central and state for the sector, public and private investment in the sector. These drab equations are of no use whatsoever to the kisans of our country but are the only dialect that the financial, business, trading and commodity industries take primary note of, both in India and outside, and so these ratios are scrutinised at the start and end of every sowing season for every major crop.
The third measure has to do mostly with the materials, which when applied by cultivating households (156 million rural households, of which 90 million are considered to be agricultural only) to the 138 million farm holdings that they till and nurture, maintains the second measure and delivers the first. This third measure consists of labour and loans, the costs and prices of what are called ‘inputs’ by which is meant commercial seed, fertiliser, pesticide, fuel, the use of machinery, and labour. It also includes the credit advanced to the farming households, the alacrity and good use to which this credit is put, insurance, and the myriad fees and payments that accompany the transformation of a kisan’s crop to assessed and assayed produce in a mandi.
 It is the distilling of these three kinds of measures into what is now well known as ‘food security’ that has occupied central planners and with them the Ministries of Agriculture, Rural Development, Food and Consumer Affairs (which runs the public distribution system), and Food Processing Industries. More recently, two new concerns have emerged. One is called ‘nutritional security’ and while it evokes in the consumer the idea which three generations ago was known as ‘the balanced diet’, has grave implications on the manner in which food crops are treated. The other is climate change and how it threatens to affect the average yields of our major food crops, pushing them down and bearing the potential to turn the fertile river valley of today into a barren tract tomorrow.
These two new concerns, when added to the ever-present consideration about whether India has enough foodgrain to feed our 257 million (in 2017) households, are today exploited to give currency to the technological school of industrial agriculture and its most menacing method: genetically modified (GM) or engineered seed and crop. The proprietors of this method are foreign, overwhelmingly from USA and western Europe and the western bio-technology (or ‘synbio’, as it is now being called, a truncation of synthetic biology, which includes not only GM and GE but also the far more sinister gene editing and gene ‘drives’) network is held in place by the biggest seed- and biotech conglomerates, supported by research laboratories (both academic and private) that are amply funded through their governments, attended to by a constellation of high-technology equipment suppliers, endorsed by intergovernmental groupings such as the UN Food and Agriculture Organisation (FAO) and the Consultative Group on International Agricultural Research (CGIAR), taken in partnership by the world’s largest commodities trading firms and grain dealers (and their associates in the commodities trading exchanges), and amplified by quasi-professional voices booming from hundreds of trade and news media outlets.
This huge and deep network generates scientific and faux-scientific material in lorry-loads, all of it being designed to bolster the claims of the GM seed and crop corporations and flood the academic journals (far too many of which are directly supported by or entirely compromised to the biotech MNCs) with ‘peer-reviewed evidence’. When the ‘science’ cudgel is wielded by the MNCs through their negotiators in New Delhi and state capitals, a twin cudgel is raised by the MNC’s host country: that of trade, trade tariffs, trade sanctions and trade barriers. This we have witnessed every time that India and the group of ‘developing nations’ attends a council, working group, or dispute settlement meeting of the World Trade Organisation (WTO). The scientific veneer is sophisticated and well broadcast to the public (and to our industry), but the threats are medieval in manner and are scarcely reported.
[This is the first part of an article that was published by Swadeshi Patrika, the monthly journal of the Swadeshi Jagran Manch. Part two is here.]
Masses of cotton but mere scraps of vegetables

The sizes of the coloured crop rectangles are relative to each other based on thousand hectare measures. The four pie charts describe the distribution of the main crops amongst the main farm sizes.
For a cultivating household, do the profits – if there are any – from the sale of a commercial crop both enable the household to buy food to fit a well-balanced vegetarian diet, and have enough left over to bear the costs of its commercial crop, apart from saving? Is this possible for smallholder and marginal kisans? Are there districts and talukas in which crop cultivation choices are made by first considering household, panchayat and taluka food needs?
Considering the district of Yavatmal, in the cotton-growing region of Maharashtra, helps point to the answers for some of these questions. Yavatmal has 838,000 hectares of cultivated land distributed over 378,000 holdings and of this total cultivable area, the 2010-11 Agriculture Census showed that 787,000 hectares were sown with crops.
Small holdings, between 1 and 2 hectares, account for the largest number of farm holdings and this category also has the most cultivated area: 260,000 hectares. Next is farms of 2 to 3 hectares which occupy 178,000 hectares, followed by those of 3 to 4 hectares which occupy 92,000 hectares.
The district’s kisans allocate their cultivable land to food and non-food crops both, with cereals and pulses being the most common food crops, and cotton (fibre crop) and oilseeds being the non-food (or commercial) crops.
How do they make their crop choices? From the agriculture census data, a few matters immediately stand out, which are illustrated by the graphic provided. First, a unit of land is sown 1.5 times in the district or, put another way, is sown with one-and-a-half crops. This means crop rotation during the agricultural year (July to June) is practiced but – with Yavatmal being in the hot semi-arid agri-ecoregion of the Deccan plateau with moderately deep black soil – water is scarce and drought-like conditions constrain rotation.
Second, land given to the cultivation of non-food crops is 1.6 times the area of land given to the cultivation of food crops (including the crop rotation factor), a ratio that is made abundantly clear by the graphic. This tells us that the food required by the district’s households (about 647,000 of which about 516,000 are rural) cannot be supplied by Yavatmal’s own kisans.
The vegetables required by the populations of Yavatmal’s 16 talukas (Ner, Babulgaon, Kalamb, Yavatmal, Darwha, Digras, Pusad, Umarkhed, Mahagaon, Arni, Ghatanji, Kelapur, Ralegaon, Maregaon, Zari-Jamani, Wani) can in no way be supplied by the surprisingly tiny acreage of land allocated to their cultivation. Nor do they fare better for fruit, which has even less land (although this is a more complex calculation for fruit trees, less so for vine fruits).
Third, 125,000 hectares to wheat and 71,000 hectares to jowar makes up almost the entire cereals cultivation. Likewise 126,000 hectares to tur (or arhar) and 94,000 hectares to gram accounts for most of the land allocated to pulses. Thus while Yavatmal’s talukas are well supplied with wheat, jowar, gram and tur dal, its households must depend on neighbouring (or not so neighbouring) districts for vegetables, as a minimum of 280,000 tons per year is to be supplied to meet each household’s recommended dietary needs.
What the graphic helps us ask is the size of the costs associated with crop cultivation choices in Yavatmal. The cultivation of hybrid cotton in India’s major cotton growing regions (several districts each in Maharashtra, Andhra Pradesh and Gujarat) is associated with heavy chemical fertiliser and pesticides use. Whether the soil on which cotton has grown can be sown again with a food crop is not clear from the available data but if so such a crop would be saturated with a vicious mix of chemicals that include nitrates and phosphates.
The health of the soil in Yavatmal’s 16 talukas is probably amongst the most fragile in Deccan Maharashtra, and after years of coaxing a false ‘productivity’ out of the ground for cotton, it would be best for the district’s 516,000 rural households to take a cotton ‘holiday’ for three to four years and revert to the mixed and integrated cropping of their forefathers (small millets). But the grip of the financiers and the textiles intermediaries is strong.
Seeing the growers of our food and where they are
Where the food that we eat is grown, who the growers of our food are, these are the sort of questions that independent Bharat ought very early to have made central to our understanding of the growing of food crops and the uses to which harvested food crops are put. Instead, we have an administrative understanding, weighed down completely by the bits and pieces of method left by an imperial British administration – whose interests were exploitative and fully colonial.
And assisting this anachronistic administrative view of food and agriculture is a more recent ‘market’ view. This is even more distanced from the farming household and the consuming household than the colonial view was, because its engine is constructed according to the blueprints drawn by a western macro-economics which has served neither the populations of the western countries nor the post-colonial populations of former colonies. The ‘market’ view survives till today only because of the continuous creation of new consumers for food ‘products’ – which is quite different from the seasonal consumption of raw food staples provided by local cultivators.

For these and allied reasons the ability of the central government administration of Bharat – from the time of the First Five Year Plan of 1951-56 – to consider agriculture and food as something other than a ‘sector’, a contributor to gross domestic product (GDP), as an activity through which employment could be supported and poverty kept at bay, has been crippled. There is no reason for it to continue being crippled today. It has continued only because of the legions of planners, advisers, economists and econometricians, academics and researchers, bankers and financiers, and to which assembly must now be added the social entrepreneurs, fin-tech (finance technology) start-ups, and ‘innovators’ who derive dubious means and transient currency out of it.
For this reason I have in a number of articles, papers and writings such as this one sought to describe ways in which the circumstances of the food grower should be, and must be, seen – very often by using the public data and statistics freely available. Some of the indicators we need to have in the foreground – and these are very much more important than the area-produce-yield obsession of our agricultural science establishment and economics planners – are: how many rural households does it take to feed an urban household? Where are farmers, food growers and cultivators a large part of those who work? What role do the smallest urban settlements (census towns) have in the growing and consuming of food?

This is the result of a very small attempt, using Census 2011, to answer such questions.
1. There are 152 districts in which the ratio of the number of rural households to urban households is 8 and above. This means that in 152 districts, rural households outnumber urban households by a factor of at least 8. In 102 of these districts, the ratio is 10 and above, in 45 of these districts the ratio is 15 and above, and in 24 districts the ratio is at least 20.
Among districts which have a high ratio are Ramban in Jammu and Kashmir has a ratio of 24.7 to 1, Sheohar in Bihar has a ratio of 24.6 to 1, West District of Sikkim has a ratio of 23.7 to 1, Anjaw in Arunachal Pradesh has a ratio of 23.7 to 1, Bhabua in Bihar has a ratio of 23.6 to 1 and Baudh in Odisha has a ratio of 22.5 to 1. Whereas Bhabua has some 2.4 lakh rural households, West District has only about 27,000 rural households.
2. There are 174 districts in which the rural farming population, that is, the number of working adults who are engaged in cultivation of their plots or as agricultural labour, is 80% and more of the total rural working population of that district. In 90 of these districts the percentage is 85% and above, in 25 districts it is 90% and above.
Among districts which have a high percentage of cultivators and agricultural labour in their rural working population are Washim and Nandurbar in Maharashtra (90.7% and 90.5%), Dhar, Khandwa and Khargone in Madhya Pradesh (90.6%, 90.5% and 90.5%), and Jashpur and Surguja in Chhattisgarh (both 90.4%).
3. There are 211 districts in which the number of rural households is 3 lakh and above. Of these in 161 districts the number of rural households is 3.5 lakh and above, and in 129 districts the number of rural households is 4 lakh and above. From among these 129, there are 29 in Uttar Pradesh, 19 in Bihar, 15 in West Bengal, 15 in Maharashtra and 13 in Andhra Pradesh.
Among districts with large numbers of rural households are Krishna in Andhra Pradesh with about 7.53 lakh households, Mahbubnagar in Telengana with 7.43 lakh households, Ahmednagar in Maharashtra with 7.39 lakh households, Malda in West Bengal with 7.34 lakh households, Darbhanga in Bihar with 7.29 lakh households, Allahabad in Uttar Pradesh with 7.21 lakh households and Belgaum in Karnataka with 7.19 lakh households.

4. There are 202 districts in which the farming population both rural and urban, that is, the number of working adults who are engaged in cultivation of their plots or as agricultural labour, is 70% or more of the total working population of that district. In 116 of these districts the percentage is 75% and above, in 58 of these districts it is 80% and above.
Among districts with a high combined percentage of rural and urban households engaged in agriculture are Pratapgarh in Rajasthan (83.8%), Mahasamund in Chhattisgarh (83.6%), Mandla in Madhya Pradesh (83.6%), Katihar in Bihar (83%), Khunti in Jharkhand (83%), Uttar Bastar Kanker in Chhattisgarh (83%), Malkangiri in Odisha (82.9%) and Dohad in Gujarat (82.8%).
Food, climate, culture, crops and government

The weekly standardised precipitation index of the India Meteorological Department (IMD) which is a running four-week average. This series shows the advancing dryness of districts in south India.
In November 2015, the Departmentally Related Standing Committee on Agriculture of the Lok Sabha, Parliament of India, invited suggestions and submissions on the subject “Comprehensive Agriculture Research based on Geographical Condition and Impact of Climatic Changes to ensure Food Security in the Country”.
The Committee called for inputs on issues such as the need to evolve new varieties of crops which can withstand climatic fluctuation; requirement to evolve improved methods of irrigation; the need to popularise consumption of crops/fruits which can provide better nutrition; the need to develop indigenous varieties of cattle that can withstand extreme climatic stress; the need to develop a system for precision horticulture and protected cultivation; diversification of species of fish to enhance production from the fisheries sector; the need to strengthen the agriculture extension system; and means to focus on agriculture education.
I prepared a submission as my outline response, titled “Aspects of cultivation, provision of food, and use of land in Bharat today and a generation hence”. The outline I provided includes several issues of current urgency and connects them to scenarios that are very likely to emerge within a generation. My intention is to signal the kinds of pathways to preparation that government (central and state) may consider. It is also meant to flag important cultural and social considerations that lie before us, and to emphasise that economic and quantitative measurements alone are not equipped to provide us holistic guidance.
The outline comprises three sections.
(A) The economic framework of the agriculture and food sector and its imperatives.
(B) The social, ecological, and resource nature of crop cultivation, considering factors that influence it.
(C) Methods, pathways and alternatives possible to adopt with a view to being inter-generationally responsible.
In view of the current climatic conditions – heat waves in the central and eastern regions of the country, stored water in our major reservoirs which are at or near ten-year lows – I reproduce here the section on the economic framework of the agriculture and food sector and its imperatives. The full submission can be found here [pdf, 125kb].
This framework considers the agriculture and food sector, including primary agricultural production recorded, the inputs and products of industry based on agricultural raw material (primary crop whether foodgrain, horticulture, spices, plantation, ruminants and marine, oilseeds, fibres), agribusiness (processing in all its forms), supply chains connecting farmers and farmer producer organisations to primary crop aggregators, buyers, merchants, stockists, traders, consumers, as well as associated service providers. This approach is based on the connection between agricultural production and demand from buyers, processers and consumers along what is called the supply chain.

Water storage quantities in the 91 major reservoirs in the first week of April 2016. Blue bars are each reservoir’s full storage capacity (in billion cubic metres, bcm) and orange bars are the current storage at the time. Data from the Central Water Commission, Government of India.
If this framework is considered as existing in Bharat to a significant degree which influences crop cultivation choices, the income of cultivating household, the employment generation potential of associated service providers, then several sets of questions require answers:
* Concerning economic well-being and poverty reduction: what role does agricultural development need to play in promoting economic stability in rural (and peri-urban) regions thereby contributing to poverty reduction and how can the agrifood sector best contribute to jobs and higher incomes for the rural poor?
* Concerning food security: what role can agricultural and agro-industry development play in ensuring rural and urban communities have reliable access to sufficient, culturally appropriate and safe food?
* Concerning the sustainability of food producing systems: how should agriculture and agro-industry be regulated in a participatory manner so as to ensure that methods of production do not overshoot or endanger in any way (ecological or social) conservative carrying capacity thresholds especially in the contexts of climate change and resource scarcity?
When viewed according to the administrative and policy view that has prevailed in Bharat over the last two generations, there is a correlation between agricultural productivity growth and poverty reduction and this is the relationship the macro- economic and policy calculations have been based upon. Our central annual agricultural (and allied services) annual and five-year plan budget and state annual and five-year plan budgets have employed such calculations since the 1950s, when central planning began.
However the choices that remain open to us are considerably fewer now than was the case two generations (and more) ago when the conventional economic framework of the agriculture and food sector took shape.
How a district employs land and crop

A plotting of the cropland size categories with the number of holdings for the district of Hingoli in Maharashtra. The central group of rectangles displays the distribution, relative to each other, of the size categories of holdings (in hectares, ha.). The blue squares, also relative to each other, displays the number of holdings for each farm size category. The data source is the Agricultural Census 2010-11.
In the district of Hingoli, Maharashtra, the allocation of cultivated land between food crops and non-food crops is somewhat in favour of non-food crops. That is, for every hectare planted with a food crop 1.3 hectares is planted with a non-food crop. The broad categories we have under food crops are: cereals, pulses, vegetables and fruit. Under non-food crops there are: oilseeds, sugarcane, fibres, spices and fodder.

Where Hingoli district is in Maharashtra state.
The Agricultural Census 2010-11 detailed data for Hingoli shows that at the time of the survey 493,927 hectares were under cultivation for all kinds of crops, both food and non-food. As this is a count of how much land was under cultivation by crop, the total land under cultivation for all crops taken together is more than the total land under cultivation when measured according to land use. This is so because of crop rotation during the same agricultural year, inter-cropping and mixed cropping – for a plot, the same land may raise two kinds of crops in a year.
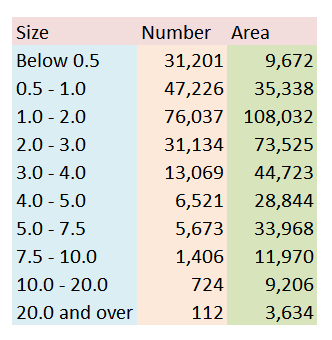
Size categories of farm holdings, with number of holdings and total area under each category for Hingoli district, Maharashtra.
The 493,927 hectares under cultivation in Hingoli are divided under 213,286 hectares for food crops and 280,640 hectares under non-food crops. This gives us the overall picture that the farming households of Hingoli choose to give more land for crop types under the ‘non-food’ category. As the settlement pattern of Hingoli is very largely rural – that means, few towns and these are the district headquarters and two more taluka centres – do the farming households of Hingoli grow enough to feed themselves comfortably? Do the farming households have the labour needed to continue cultivating so that they can feed themselves and their village communities? How are choices relating to land use and crop made?
Using the publicly available information from a variety of government sources, we are able to find parts of answers. The Agricultural Census 2010-11 is one such source, the Census of India 2011 is another, so are the tables provided by the Department of Economics and Statistics of the Ministry of Agriculture. The graphical representation I have prepared here helps provide the land use basis upon which to layer the district information from other sources.
Why did food need cities at all?

Cities may grow a few of their vegetables, but from where else can the cereal staples come if not the rural fields? Photo: Rahul Goswami, 2015
The industrialisation of the transfer of food produce from a food producing region to a net food consuming one is in my view the cause for what we have grown used to calling the rural-urban divide or difference. It is artificial and unfortunately this artifice is the basis for a number of untruths – such as ‘cities are the engines of growth / innovation / education’ and so on (arguments that have been spread vigorously by the globalisers, such as the World Economic Forum, most central banks, the commodity markets, and the international trading system).
From accounts about what we today call south and south-east Asia, the difference between a crop-producing region (managed by a group of villages) and a net food-consuming centre lay mainly in what that centre did for the villages. Markets for the sale and exchange of produce and livestock usually led to one village (with more political power than others) hosting the market, the associated food trading infrastructure, the finance needs (simple as they were, such as credit and insurance for the next season), the transport. These became the first urban centres – but it is important to recall that they existed as adjuncts to crop-growing regions, even when host to the apparatus of ruling regimes and (just as often) faith-based and spiritual enclaves.

In the Western Ghats, a termite mound next to a shrine is also venerated. Photo: Rahul Goswami 2014
There are examples that show how the balance of power was maintained – and corrected when necessary – between such centres on the one hand, and the needs of crop-growing communities supported by temple domains, on the other. Studies of the Hoysala period of southern India (1000-1350 CE) have explained how the ‘agraharas‘ – temple complexes to which belong villages and agricultural lands – were centres of crop collection, redistribution, storage and trade. Were these ‘agraharas‘ ‘urban’ in the sense we use the term today? To some extent, insofar as the priestly class and administrators did not actively cultivate crop staples. But there is another group which did not – the soldiery, and a standing army not only did not lend its labour for use in the fields, it also demanded a large amount of food. And so we have in our annals accounts of how the ‘agraharas‘ of southern India on occasion refused to continue feeding an enlarged standing army at the cost of what we today call the food security of the peasants. Naturally, the ruler had to comply.
I think this illustrates the ties between the cultivators of food staples and the consumers of produce. The trouble is that if in Hoysala times the adjustment was made by an ‘agrahara‘ (which embodied the religious aspect, devotional food, equitable distribution, and so on) in today’s scenario there is no such studied altruism. The market thinks short-term, uses financialisation as a means to yoke people to consumerism and has in many countries exploited the historical connection between food producer and consumer to boost, through the application of technology and the artifice of ‘retail’, GDP.
Six out of 10 are farm households in rural India
An agricultural year begins at the beginning of July and ends on the last day of June the following year. What we know now, thanks to the data provided by the Situation Assessment Survey of Agricultural Households, carried out by the National Sample Survey Office (NSSO) of the Ministry of Statistics and Programme Implementation (MoSPI) is that in the agricultural year 2012-13, rural India had an estimated total of 90.2 million agricultural households.
 These agricultural households were about 57.8% of the total estimated rural households. Uttar Pradesh, with an estimate of 18.05 million agricultural households, accounted for about 20% of all agricultural households in the country. Among the major states, Rajasthan had the highest percentage of agricultural households (78.4%) among its rural households followed by Uttar Pradesh (74.8%) and Madhya Pradesh (70.8%). Kerala had the least percentage share of agricultural households (27.3%) in its rural households preceded by other southern states like Tamil Nadu (34.7%) and Andhra Pradesh (41.5%).
The NSSO’s previous such survey (the ‘Situation Assessment Survey of Farmers’) was conducted in 2003. The differences between the two, a decade apart, have been explained by the NSSO. First, such surveys aim to gather an assessment of the situation of our farmers and farming households.
 This assessment determines a standard of living as measured by consumer expenditure, income and productive assets, the indebtedness of farmers and farming households, farming practices and preferences, what resources are available to them, their awareness of technological developments and access to such technologies. The survey for the 2012-13 agricultural year also collected information on crop loss, crop insurance and awareness about the Minimum Support Price (MSP).
Second, the big difference between the two surveys is that the new survey has dropped the criterion of land possession for considering a household agricultural. “Recognising the fact that significant agricultural activity can be conducted without possessing any land, the definition of ‘farmer’ and ‘farmer household’ followed in NSS 59th Round was critically reviewed and the land possession as an eligibility criterion was dispensed with, replacing it with the concept of ‘agricultural production unit’ as one which produces field crops, horticultural crops, livestock and the products of any of the other specified agricultural activities,” is how the new survey (called the 70th Round) has explained its decision.
 I find this puzzling and an aspect that needs careful probing. We know, from a close scrutiny of the Census 2011 data at the district level, that the number of people and households engaged in cultivation and farming has dropped when compared to the last census, in 2001, and the previous census, in 1991 (as a percentage of the rural working population but in several cases as absolute population numbers too).
What reason could the NSSO have had to amend the definition it used ten years earlier? “With a view to keep the large number of households with insignificant agricultural activities out of survey coverage, it was decided to have a minimum value of agricultural produce for a household to qualify as an ‘agricultural production unit’,” the NSSO has explained. I cannot follow this reasoning. Are urban households which make negligible contributions to the local gross domestic product to be kept out of surveys that ought to assess their conditions – such as those with pensioners and informally employed people who get by on job work?
 If this is the basis for exclusion, what qualifies a household for inclusion in the survey? The NSSO has considered average Monthly Household Consumer Expenditure (MHCE) for “home grown consumption of some specific items” and adopted a cut-off value amount of 3,000 rupees worth of annual agricultural produce. The activities which provided such value are given as “cultivation of field crops, horticultural crops, fodder crops, plantation, animal husbandry, poultry, fishery, piggery, bee-keeping, vermiculture, sericulture etc” with such a household “having at least one member self-employed in agriculture either in the principal status or in subsidiary status during last 365 days”.
This cut-off value amount needs investigation. So does the idea of an ‘agricultural production unit’. And the NSSO for this survey has also excluded households which are entirely agricultural labour households, those households receiving income entirely from coastal fishing, as also the activity of “rural artisans and agricultural services”. Nonetheless, these data are important and useful for our understanding of the changes that have taken place in the food and agriculture domain.
In Europe, a vote for the right to keep GM out

The ‘no’ vote has given the European Parliament an excellent chance to improve EU legislation and give member states genuine tools to protect the environment and promote genuinely sustainable farming. Image: Friends of the Earth Europe
Members of the European Parliament have defeated a European Commission proposal to prevent member states from banning genetically modified crops on health and/or environmental grounds. The result of this vote means that national bans on GM crops, for environmental or health reasons, are allowed even if the EU approves genetically modified (GM) crops for cultivation.
The European Food and Safety Authority had approved GM for use in the EU, but a number of countries opposed to GM (like France) demanded the right to block crops under a principle known as ‘subsidiarity’, or devolution to individual countries.
The Greens/European Free Alliance has said that the vote by Members of the European Parliament (MEPs) strengthens the grounds on which EU member countries could opt out from GMO authorisations under the proposed new system.
In a statement the Greens/European Free Alliance said: “No must mean no: countries wanting to opt out of GM authorisations must have a totally legally watertight framework for doing so. MEPs have also voted for the inclusion of mandatory measures to prevent the contamination of non-GM crops, with the myriad of issues this raises. The committee also rejected a proposal from EU governments, which would have obliged member states to directly request that corporations take them out of the scope of their GMO applications, before being allowed to opt out.”
However, the Greens are still very concerned that the new opt out scheme is a slippery slope for easing EU GMO authorisations and does not fundamentally change the flawed EU approval process in itself. Organisations, scientists, academics, political fronts and citizens’ alliances who do not want GM crop or food in their regions and countries nonetheless see an urgent need to reform the EU’s GMO authorisation process. On 03 November 2014, signatures from more than 160,000 European citizens were presented to the vice-chair of the Environment Committee calling on him to close these loopholes.
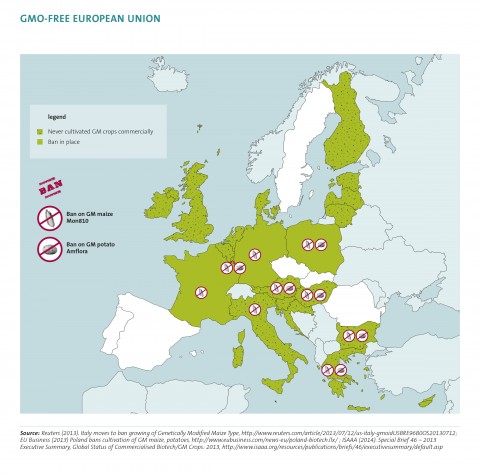
Eight EU countries have banned the cultivation of GM crops (others have not commercially grown such crops). The only crop permitted, Monsanto’s GM maize, is restricted to some areas of Spain and four other countries. Image: Friends of the Earth Europe
Currently, authorisations proceed in spite of flawed risk assessments and the consistent opposition of a majority of EU member states in Council and, importantly, a clear majority of EU citizens. They have warned against a trade-off of easier EU authorisations against easier national bans. For the EU, the next step must be an EU-wide total ban and total rejection of GM crop, food, seed and technology in all its forms, otherwise the new proposal for EU GMO approvals is a Trojan horse which risks finally opening the door to GMOs despite citizens’ opposition, and which will keep open the route for GM/biotech companies to appeal against such bans (a route that European Greens and the many groups that have rejected GM want to shut once and for all).
Such a next step – which is the logical and moral next step for the European Parliament to take – is necessary to overturn completely the current arrangement which treats biotech companies and corporations at the same level as governments. Under the arrangement that existed till now (the ramifications of this week’s ‘no’ vote must still be examined) an EU member country which does not want GMO to be grown on its territory must request the biotech company (through the European Commission) that its territory be excluded from the geographical scope of the EU authorisation. Only if the country has applied for a ‘territorial exemption’ and been refused by the company is the country allowed to then implement a ban on GMO on its territory.
How utterly contemptuous of a country’s sovereign rights this arrangement was, and how it found its way into procedure illustrates dramatically the power and influence that the GM and biotech industry has come to wield in the EU – the decision of the geographical scope of an EU authorisation gave more weight to biotech/GM companies than to governments!
In the debate about GM crops, the argument that the biotech industry and their supporters always fall back on is that whether we like it or not, we are going to need them to feed the world. Genetic modification has, they assure us, the potential to produce crops with all sorts of wonderful traits: tolerance of drought, cold, salinity and flooding, resistance to insect pests, extra nutritional value, and more.
“But for the last 20 years, GM has singularly failed to convert that potential into reality,” the Institute for Science in Society has explained. “Almost all the GM crops grown have been modified to have one of two traits: tolerance of glyphosate-based herbicides and the ability to produce a Bt-toxin that can kill corn- and cotton pests. In the meantime, conventional breeding, often employing modern techniques such as marker-assisted breeding, has continued to deliver the goods. If our real goal is to feed the world, we should be taking resources away from GM and devoting them to other agricultural research that is less glamorous-sounding but more effective.”
