Posts Tagged ‘district’
Masses of cotton but mere scraps of vegetables

The sizes of the coloured crop rectangles are relative to each other based on thousand hectare measures. The four pie charts describe the distribution of the main crops amongst the main farm sizes.
For a cultivating household, do the profits – if there are any – from the sale of a commercial crop both enable the household to buy food to fit a well-balanced vegetarian diet, and have enough left over to bear the costs of its commercial crop, apart from saving? Is this possible for smallholder and marginal kisans? Are there districts and talukas in which crop cultivation choices are made by first considering household, panchayat and taluka food needs?
Considering the district of Yavatmal, in the cotton-growing region of Maharashtra, helps point to the answers for some of these questions. Yavatmal has 838,000 hectares of cultivated land distributed over 378,000 holdings and of this total cultivable area, the 2010-11 Agriculture Census showed that 787,000 hectares were sown with crops.
Small holdings, between 1 and 2 hectares, account for the largest number of farm holdings and this category also has the most cultivated area: 260,000 hectares. Next is farms of 2 to 3 hectares which occupy 178,000 hectares, followed by those of 3 to 4 hectares which occupy 92,000 hectares.
The district’s kisans allocate their cultivable land to food and non-food crops both, with cereals and pulses being the most common food crops, and cotton (fibre crop) and oilseeds being the non-food (or commercial) crops.
How do they make their crop choices? From the agriculture census data, a few matters immediately stand out, which are illustrated by the graphic provided. First, a unit of land is sown 1.5 times in the district or, put another way, is sown with one-and-a-half crops. This means crop rotation during the agricultural year (July to June) is practiced but – with Yavatmal being in the hot semi-arid agri-ecoregion of the Deccan plateau with moderately deep black soil – water is scarce and drought-like conditions constrain rotation.
Second, land given to the cultivation of non-food crops is 1.6 times the area of land given to the cultivation of food crops (including the crop rotation factor), a ratio that is made abundantly clear by the graphic. This tells us that the food required by the district’s households (about 647,000 of which about 516,000 are rural) cannot be supplied by Yavatmal’s own kisans.
The vegetables required by the populations of Yavatmal’s 16 talukas (Ner, Babulgaon, Kalamb, Yavatmal, Darwha, Digras, Pusad, Umarkhed, Mahagaon, Arni, Ghatanji, Kelapur, Ralegaon, Maregaon, Zari-Jamani, Wani) can in no way be supplied by the surprisingly tiny acreage of land allocated to their cultivation. Nor do they fare better for fruit, which has even less land (although this is a more complex calculation for fruit trees, less so for vine fruits).
Third, 125,000 hectares to wheat and 71,000 hectares to jowar makes up almost the entire cereals cultivation. Likewise 126,000 hectares to tur (or arhar) and 94,000 hectares to gram accounts for most of the land allocated to pulses. Thus while Yavatmal’s talukas are well supplied with wheat, jowar, gram and tur dal, its households must depend on neighbouring (or not so neighbouring) districts for vegetables, as a minimum of 280,000 tons per year is to be supplied to meet each household’s recommended dietary needs.
What the graphic helps us ask is the size of the costs associated with crop cultivation choices in Yavatmal. The cultivation of hybrid cotton in India’s major cotton growing regions (several districts each in Maharashtra, Andhra Pradesh and Gujarat) is associated with heavy chemical fertiliser and pesticides use. Whether the soil on which cotton has grown can be sown again with a food crop is not clear from the available data but if so such a crop would be saturated with a vicious mix of chemicals that include nitrates and phosphates.
The health of the soil in Yavatmal’s 16 talukas is probably amongst the most fragile in Deccan Maharashtra, and after years of coaxing a false ‘productivity’ out of the ground for cotton, it would be best for the district’s 516,000 rural households to take a cotton ‘holiday’ for three to four years and revert to the mixed and integrated cropping of their forefathers (small millets). But the grip of the financiers and the textiles intermediaries is strong.
Seeing the growers of our food and where they are
Where the food that we eat is grown, who the growers of our food are, these are the sort of questions that independent Bharat ought very early to have made central to our understanding of the growing of food crops and the uses to which harvested food crops are put. Instead, we have an administrative understanding, weighed down completely by the bits and pieces of method left by an imperial British administration – whose interests were exploitative and fully colonial.
And assisting this anachronistic administrative view of food and agriculture is a more recent ‘market’ view. This is even more distanced from the farming household and the consuming household than the colonial view was, because its engine is constructed according to the blueprints drawn by a western macro-economics which has served neither the populations of the western countries nor the post-colonial populations of former colonies. The ‘market’ view survives till today only because of the continuous creation of new consumers for food ‘products’ – which is quite different from the seasonal consumption of raw food staples provided by local cultivators.

For these and allied reasons the ability of the central government administration of Bharat – from the time of the First Five Year Plan of 1951-56 – to consider agriculture and food as something other than a ‘sector’, a contributor to gross domestic product (GDP), as an activity through which employment could be supported and poverty kept at bay, has been crippled. There is no reason for it to continue being crippled today. It has continued only because of the legions of planners, advisers, economists and econometricians, academics and researchers, bankers and financiers, and to which assembly must now be added the social entrepreneurs, fin-tech (finance technology) start-ups, and ‘innovators’ who derive dubious means and transient currency out of it.
For this reason I have in a number of articles, papers and writings such as this one sought to describe ways in which the circumstances of the food grower should be, and must be, seen – very often by using the public data and statistics freely available. Some of the indicators we need to have in the foreground – and these are very much more important than the area-produce-yield obsession of our agricultural science establishment and economics planners – are: how many rural households does it take to feed an urban household? Where are farmers, food growers and cultivators a large part of those who work? What role do the smallest urban settlements (census towns) have in the growing and consuming of food?

This is the result of a very small attempt, using Census 2011, to answer such questions.
1. There are 152 districts in which the ratio of the number of rural households to urban households is 8 and above. This means that in 152 districts, rural households outnumber urban households by a factor of at least 8. In 102 of these districts, the ratio is 10 and above, in 45 of these districts the ratio is 15 and above, and in 24 districts the ratio is at least 20.
Among districts which have a high ratio are Ramban in Jammu and Kashmir has a ratio of 24.7 to 1, Sheohar in Bihar has a ratio of 24.6 to 1, West District of Sikkim has a ratio of 23.7 to 1, Anjaw in Arunachal Pradesh has a ratio of 23.7 to 1, Bhabua in Bihar has a ratio of 23.6 to 1 and Baudh in Odisha has a ratio of 22.5 to 1. Whereas Bhabua has some 2.4 lakh rural households, West District has only about 27,000 rural households.
2. There are 174 districts in which the rural farming population, that is, the number of working adults who are engaged in cultivation of their plots or as agricultural labour, is 80% and more of the total rural working population of that district. In 90 of these districts the percentage is 85% and above, in 25 districts it is 90% and above.
Among districts which have a high percentage of cultivators and agricultural labour in their rural working population are Washim and Nandurbar in Maharashtra (90.7% and 90.5%), Dhar, Khandwa and Khargone in Madhya Pradesh (90.6%, 90.5% and 90.5%), and Jashpur and Surguja in Chhattisgarh (both 90.4%).
3. There are 211 districts in which the number of rural households is 3 lakh and above. Of these in 161 districts the number of rural households is 3.5 lakh and above, and in 129 districts the number of rural households is 4 lakh and above. From among these 129, there are 29 in Uttar Pradesh, 19 in Bihar, 15 in West Bengal, 15 in Maharashtra and 13 in Andhra Pradesh.
Among districts with large numbers of rural households are Krishna in Andhra Pradesh with about 7.53 lakh households, Mahbubnagar in Telengana with 7.43 lakh households, Ahmednagar in Maharashtra with 7.39 lakh households, Malda in West Bengal with 7.34 lakh households, Darbhanga in Bihar with 7.29 lakh households, Allahabad in Uttar Pradesh with 7.21 lakh households and Belgaum in Karnataka with 7.19 lakh households.

4. There are 202 districts in which the farming population both rural and urban, that is, the number of working adults who are engaged in cultivation of their plots or as agricultural labour, is 70% or more of the total working population of that district. In 116 of these districts the percentage is 75% and above, in 58 of these districts it is 80% and above.
Among districts with a high combined percentage of rural and urban households engaged in agriculture are Pratapgarh in Rajasthan (83.8%), Mahasamund in Chhattisgarh (83.6%), Mandla in Madhya Pradesh (83.6%), Katihar in Bihar (83%), Khunti in Jharkhand (83%), Uttar Bastar Kanker in Chhattisgarh (83%), Malkangiri in Odisha (82.9%) and Dohad in Gujarat (82.8%).
Villages in their splendid talukas

As part of my continuing and long term study on the relation between populations both rural and urban, the land base upon which they depend for the growing of food, and the socio-economic changes taking place in our districts, I have begin an examination of how households are distributed in administrative regions, that is, districts and talukas. This graphed plot describes one kind of finding. (Click here for a full size plot that lets you explore each data point.)
 States are administratively divided into districts (earlier the concept of a ‘division’, which was a group of districts, was more common – the ‘division’ is still used, for revenue determination but also for home affairs) and these are divided into talukas. How many talukas does the typical district have? Some have four, others as many as 12. There are talukas whose households are entirely rural as there is not a single census town, let alone a municipal council, within its precincts. The taluka contains villages and these can be numerous. Some talukas may have 50-60 villages whereas others may have 200 and more.
It is always an interesting matter to ponder. How did households in a small sub-region – at the confluence of a stream and a river for example or at the edge of a plain and at the margins of hills – become villages and what determined the distribution of such hamlets in a very local habitat? The factors were always environmental and there was often a strong cultural reason, such as proximity to a sacred site, a mandir or a venerated shrine, historical sites (such as those mentioned in the Ramayana and documented in detail thereafter in numerous local commentaries).
From the set of districts analysed so far a few guiding figures have emerged. The number of rural households in a taluka varies from 7,200 to 96,800; the number of villages in a taluka varies from 28 to 338; the average number of households in a village is 330; there is one urban household for every 3 rural households.
Where the agro-ecological conditions are favourable, there is to be found a denser gathering of villages and these will have larger populations. This can easily be understood. It is less clear how the toil of the households accommodated in a large number of villages are required to maintain, in many ways, urban households which are now clustered in a town or two of the same taluka. This dependence is what a study of not only the rural-urban population, but also how it is distributed within agro-ecological boundaries, can help uncover. The graphed plot included here is one step towards that understanding.
What works, and doesn’t, in Maharashtra’s districts
In an exercise to help determine how reports of the MGNREGA (Mahatma Gandhi National Rural Employment Guarantee Act or Nrega) can inform us, I have used the records of what the programme calls ‘outcomes’ in the form of ‘physical assets’ created for the community (or conditional use by groups of individuals, depending on the kind of asset) over a financial year.
 The year is 2015-16 and the districts are those of Maharashtra (34, Mumbai excluded). There are at present 17 categories of physical assets and these are: rural connectivity, flood control and protection, water conservation and water harvesting, drought proofing, micro irrigation works, provision of irrigation, renovation of traditional water bodies, land development, any other activity approved, sewa kendra, coastal areas, rural drinking water, fisheries, rural sanitation, anganwadi, playground, food grain.
 ‘Works’ are recorded under each kind of physical asset, with these classified as having been ‘approved’, ‘taken up’ and ‘completed’ (with ‘taken up’ presumably meaning commenced but incomplete at the end of the financial year). What matters therefore is to study those that have been completed, as the kind of community asset created and certified as being completed would serve to indicate what the community has decided it needs as a priority.
 When so filtered, the number of completed physical assets in the 34 districts of Maharashtra for the year 2015-16 totalled 71,554 – a large number that helps describe why the Nrega records are so very voluminous: 1,376 ‘works’ completed every week in 34 districts, with tens of thousands of Nrega beneficiary individuals and households working to build, repair, revive, create them, and with a complex inventory of raw materials being required to be transported and paid for so that these works may take shape.
 What the list of completed works – type and number – describe is very instructive. Of the 17 categories, four (fisheries, anganwadi, playground and food grain) were recorded with not a single instance of having become a ‘work completed’ in any district. On the other hand, four kinds of physical assets accounted for a full 85% of the 71,554 works completed in Maharashtra’s 34 districts for 2015-16 and these were, in ascending order: drought proofing (8,110 and 11% of the total works), rural sanitation (12,234 and 17%), water conservation and water harvesting (14,384 and 20%), and provision of irrigation (26,496 and 37%).
 The popularity of the latter four can be well understood, as much for how they are all linked as for the precarious living conditions that every taluka in Maharashtra’s semi-arid districts face when the winter months end. These biases towards certain works but not others still do however need to be read with conditions, and keeping in mind that these are the works for but one financial year out of the last ten (albeit the definition of what constitutes an asset under Nrega has been altered and added to several times).
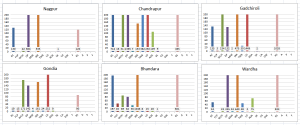
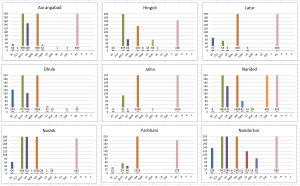
 The question that remains is: Maharashtra’s districts and blocks and villages occupy varying agro-ecological, hydrological and meteorological regions. Do their geographic and environmental circumstances not have a role to play in the decisions taken about what Nrega works should be taken up (and completed) as a priority over other kinds?
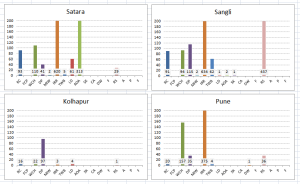
The charts presented here in groups of districts arranged according to their location amongst the six agro-ecological regions that Maharashtra occupies, indicate whether the Nrega ‘works’ process takes cognisance of the fundamental environmental factors upon which the village (and so panchayat, taluka, district) rest. The charts have been constrained to 200 on the vertical axis in order to preserve readability – values are given for each ‘work’ recorded by each district. The abbreviations for the ‘works’ (horizontal axis) are for the full forms found in the second paragraph.
Where the farmers are in Bharat
The Census 2011 helps us understand where the great farming populations are: Nashik, Paschim Medinipur, Ahmadnagar, Guntur, Mahbubnagar, Purba Champaran, Belgaum, Kurnool, Madhubani, Jalgaon and 90 other districts are found in this chart, which shows the relationship between the populations of farmers and the total working populations of these districts.
Many of the districts in this chart, represented by the circles (click for full resolution version), lie between the population markers of 750,000 and 1.1 million. They also lie within the percentage band of 60% to about 85%. This shows how important agriculture is – and will continue to be as long as annual budgets and five-year plans support it – for the districts that give us our staple foods.
Between Berar and Nizam, a taluka in Maharashtra

This is a small taluka in Vidarbha, Maharashtra. To the north, not far away, and visible on the horizon, is the line of hills called the Sahyadriparbat, which is also called the Ajanta range after the site with the remarkable frescoes.
Also due north is the city of Akola, and a little farther away north-east is Amravati, named after Amba whose ancient temple the old city, with more than 900 years of recorded history, is built around. To the west, in a nearly direct line west, is Aurangabad. To the south had stretched, not all that long ago, the dominions of the Nizam of Hyderabad, to which this little taluka had once belonged.
 Sengaon is the name of this taluka (an administrative unit unimaginatively called a ‘block’ by the administrative services, elsewhere a tehsil or a mandal) and today it is one of five talukas of the district of Hingoli, which itself is only very recent, for before 1999 it was a part of the district of Parbhani. But Hingoli town is an old one – its cantonment (old bungalows, large compounds) was where the defenders of this part of the Nizam’s northern dominions resided (over the frontier had been Berar), and there was a large and thriving market yard here, as much for the cotton as for the jowar.
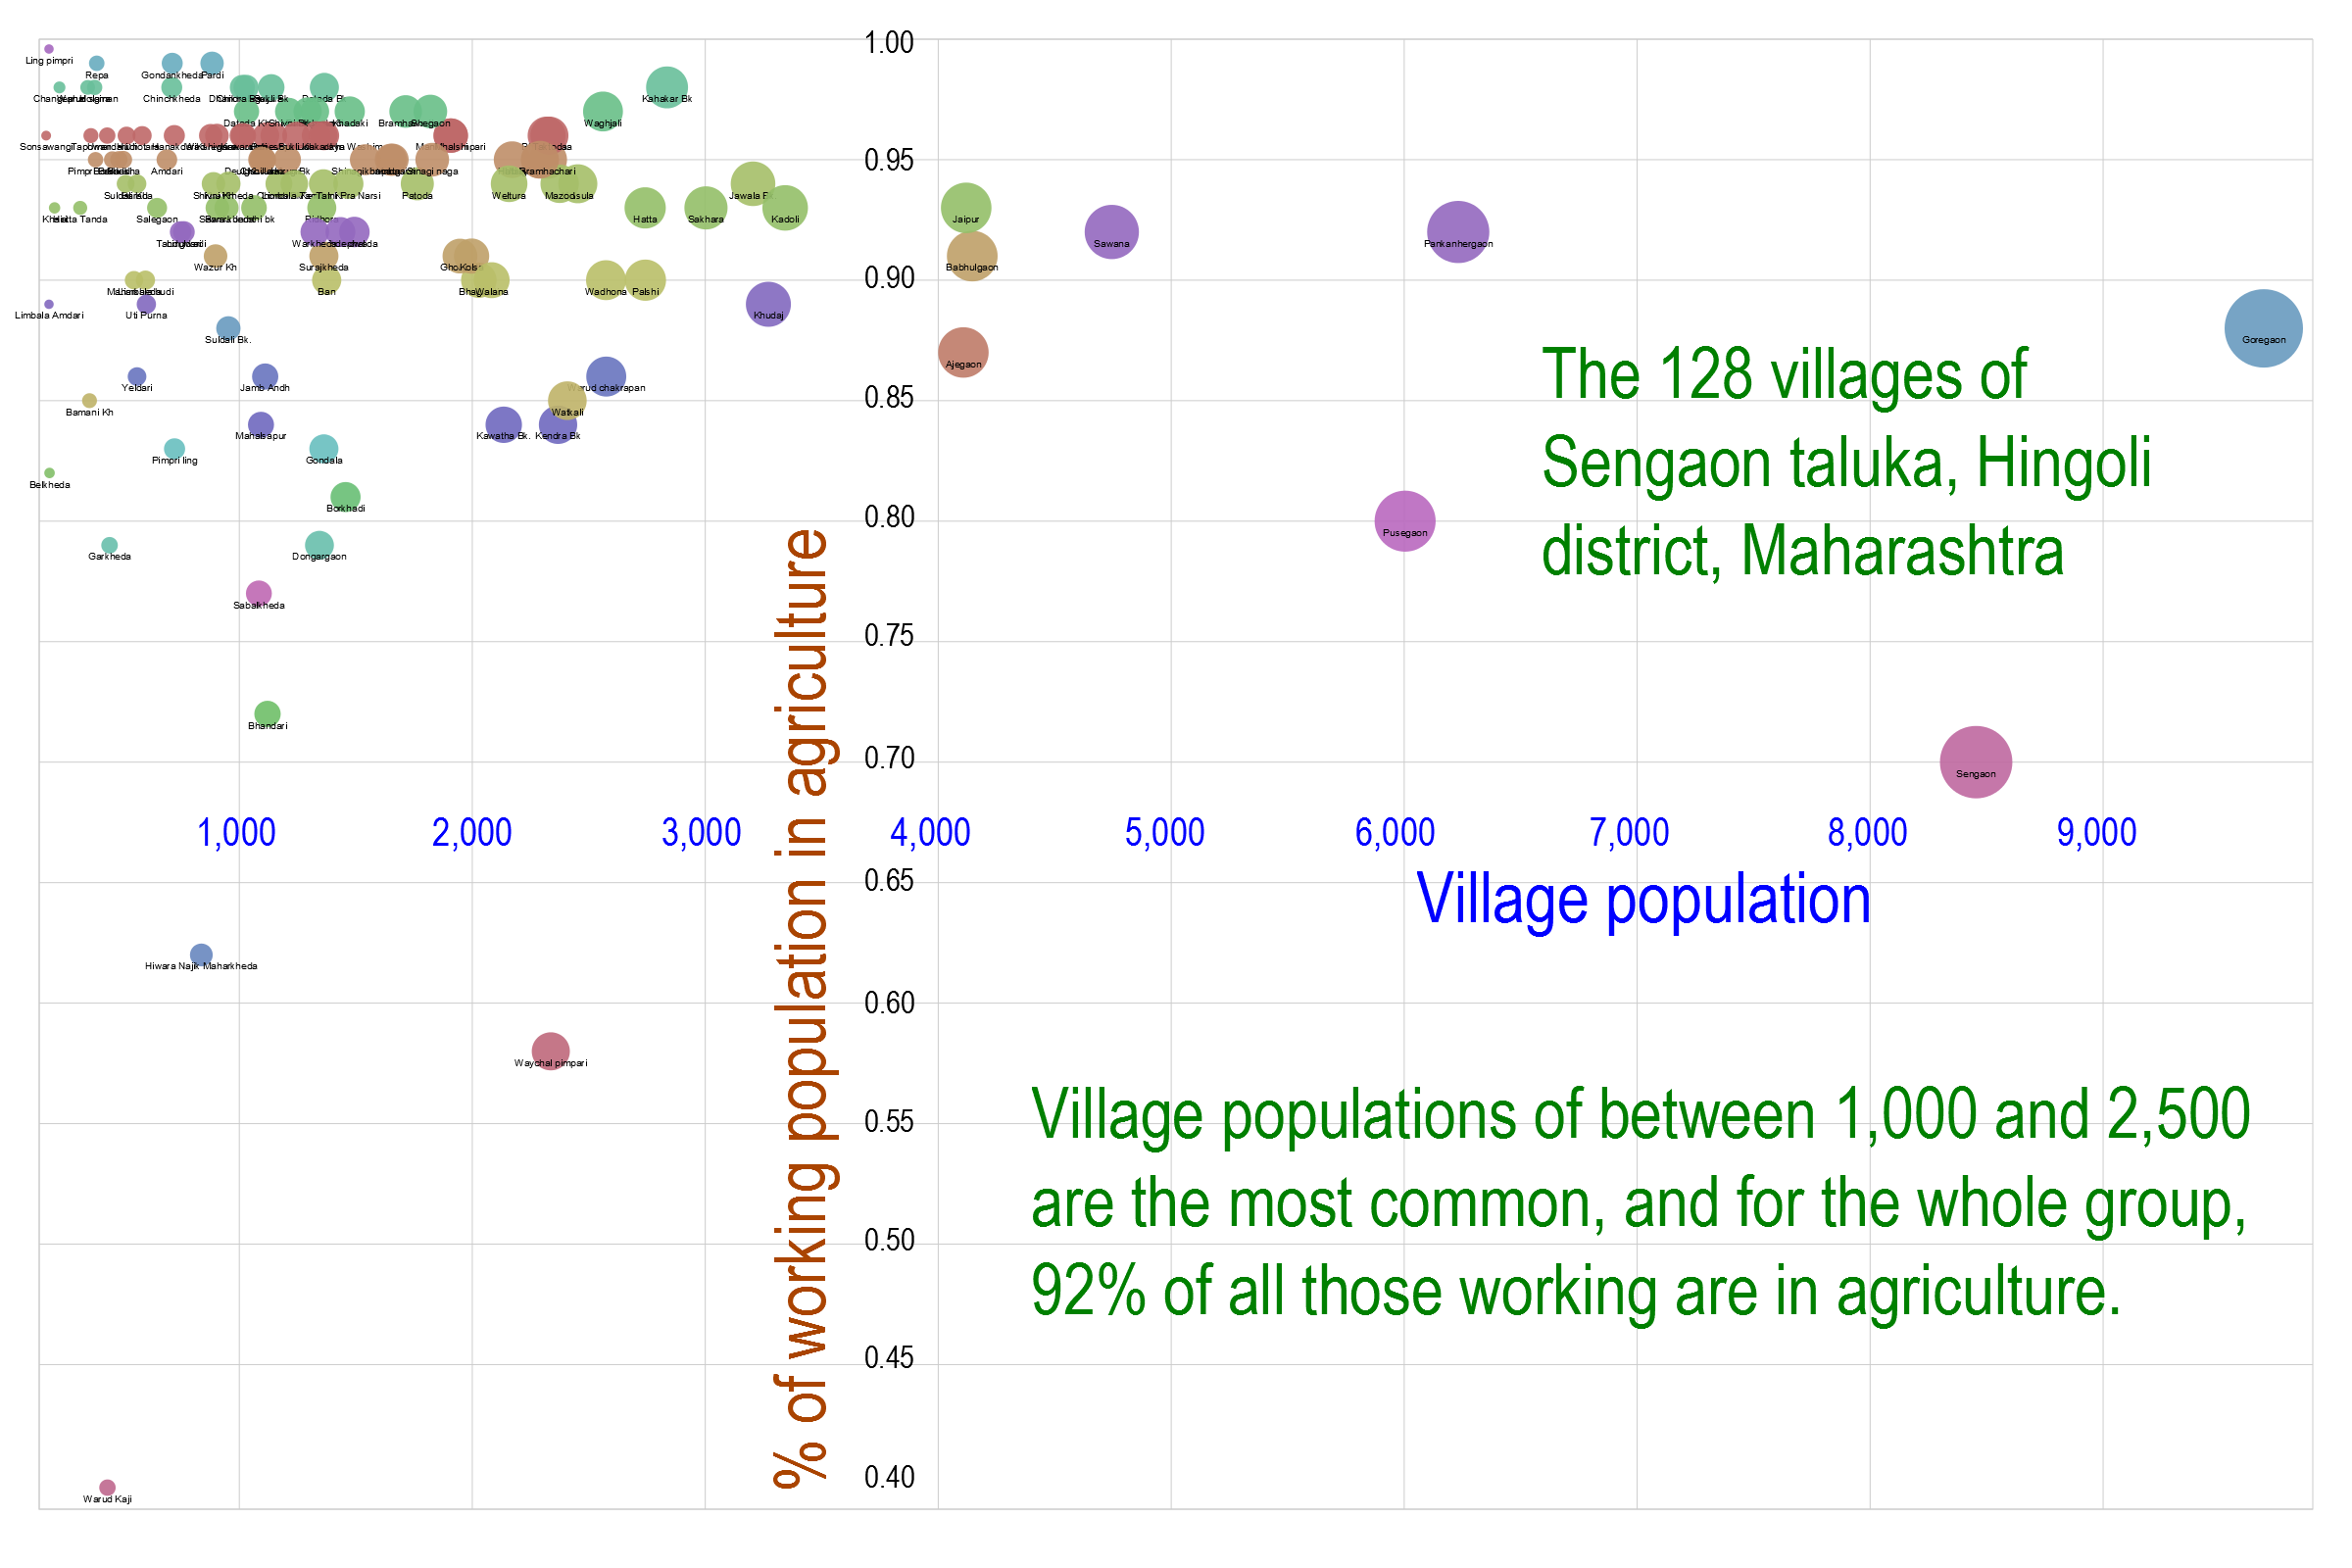
The villages of Sengaon are mostly small and agricultural, which is how the entire district was described in the district gazetteer of the 1960s. There are today 128 inhabited villages in this little taluka, and this chart (click it for a full size version, data from Census 2011) shows how their populations depend almost entirely on agriculture – for the group of villages, 92% of all those working do so in the fields, whether their village is as small as Borkhadi or Hudi, or as large as Sakhara or Palshi.
There were Bhois here (and still are), the fishermen and one-time litter-bearers, there are ‘deshastha‘ Maratha Brahmins, there are ‘Karhada‘ who take their name from Karhad, the sacred junction of the Koyna and the Krishna in Satara district, there are the former leather-workers and rope-makers called the ‘Kambhar‘, there are the weavers who are the ‘Devang‘ (with their four sub-divisions, and themselves a division of the great Dhangars or shepherds), there are the ‘Virasaiva‘ or the ‘Shivabhakta‘ or the ‘Shivachar‘ (all Lingayats) who have for generations been traders and agriculturists.
 There are the ‘Pata Jangam‘ still who must lead a celibate life and could be distinguished by the long loose roseate shirts they wore and who spent their days in meditation and prayer, there were the ‘Mali‘ the fruit and vegetable growers the gardeners and cultivators (and in times past their society was divided according to what they grew so the ‘phool Mali‘ for flower the ‘jire Mali‘ for cumin seed and the ‘halade Mali‘ for turmeric), and there are the Maratha – the chief warriors, land owners and cultivators – and the 96 families to which they belong, there are Maheshvari Marwaris, the ‘suryavanshi‘ or ‘chandravanshi‘ Rajputs, the Lambadi who at one time were grain and* salt carriers but also cattle breeders and graziers, and the ‘Vadar‘ or stone and earth workers.
This is who they are and were in the taluka of Sengaon, beyond and away from the dry and terse descriptions contained on government beneficiaries lists and drought relief programmes. They know well their trees in the expansive grasslands of the north Deccan – the Indian bael, the ‘daura‘ or ‘dhamora‘ tree, the ‘saalayi‘ whose bark and gum resin treats all sorts of ailments, the ‘madhuca‘ or mahua, the amalaki – and do their best to protect them; the twigs and sticks that fuel their ‘chulhas’ are those which fall to the earth.
It is a small taluka but old, like the others in the ancient north Deccan, and in Marathi, some of the elders of the villages here explain, with great embellishment and pomp, how the Brihat Samhita contains detailed instructions of what to plant on the embankments of a water tank, especially the madhuca, which they will add could be found in villages whose names they all know well: Pardi, Shivni, Karegaon, Barda, Sawarkheda, Suldali, Kawardadi, Datada, Jamthi, Sabalkheda …
Cities by numbers, a count of our cities
 The 27 cities shown on this map are no different from many others like them in India today, and the selection of these 27 is based solely on a single numerical milestone which I am fairly sure few of each city’s citizens (or administrations for that matter) will have marked.
On some day during the months since March 2011, the population of each of these 27 cities has crossed 150,000 – this is the criterion. March 2011 is the month to which the Census 2011 has fixed its population count, for the country, for a state, a district, a town.
And so these 27 cities share one criterion – which they be quite unaware of – which is that when their inhabitants were enumerated for the 2011 census, their populations were under 150,000 whereas in the four years since that mark has been crossed.
Any population mark is as arbitrary as any other. What such an exercise does help with is that the spotlight of awareness about our living spaces can once more shine on that factor which stands above all others: our numbers. It is these numbers that dictate our impacts, as individuals and as householders, on the environment and its gifts.
 That’s why it is of scant interest to us that the city of Palanpur in the district of Banas Kantha (Gujarat) would have crossed the 150,000 mark only very recently, perhaps one or two months ago, just like the city of Beed in the district of the same name (Maharashtra).
It is also of scant interest that whereas the city of Barabanki (district Barabanki in Uttar Pradesh), crossed the mark within a year after March 2011, it was in 2013 that Kaithal (district Kaithal, Haryana) crossed the same mark (as did Sasaram, in the district of Rohtas, Bihar).
On this map, some of the increments seem small – look at Damoh in Madhya Pradesh and Tiruvannamalai in Tamil Nadu. What is of interest to us the cumulative impact of these small increments over time.
When the great enumeration of 2011 fixed their populations, these 27 cities taken together were home to 3.88 million people. In 2015 September about 4.3 million people live in the same 27. The difference between the two totals – about 405,000 people – is more than the population of any two on this short list together!
This is but the briefest outline for 27 cities only. Using a conservative estimate for the annual population growth rate there are in 2015 September 238 cities (including these) whose populations are between 100,000 and 200,000 – Nabadwip in Nadia district (West Bengal), Neyveli in Cuddalore district (Tamil Nadu) and Rae Bareli (Rae Bareli district, Uttar Pradesh) have all just crossed the 200,000 population mark.
So many households, some in slums (pucca and ‘regularised’, or with blue plastic sheets for a roof and water mafias in control) and some in tenements, some owning a car and two-wheeler both and others reliant on public transport and the kindness of neighbours, very very few with electricity around the clock and every one of those that can afford it with an inverter or UPS. All, humble or well-to-do, with a monthly food budget and all, humble or well-to-do, with dreams and hopes.
Water and a district in Maharashtra

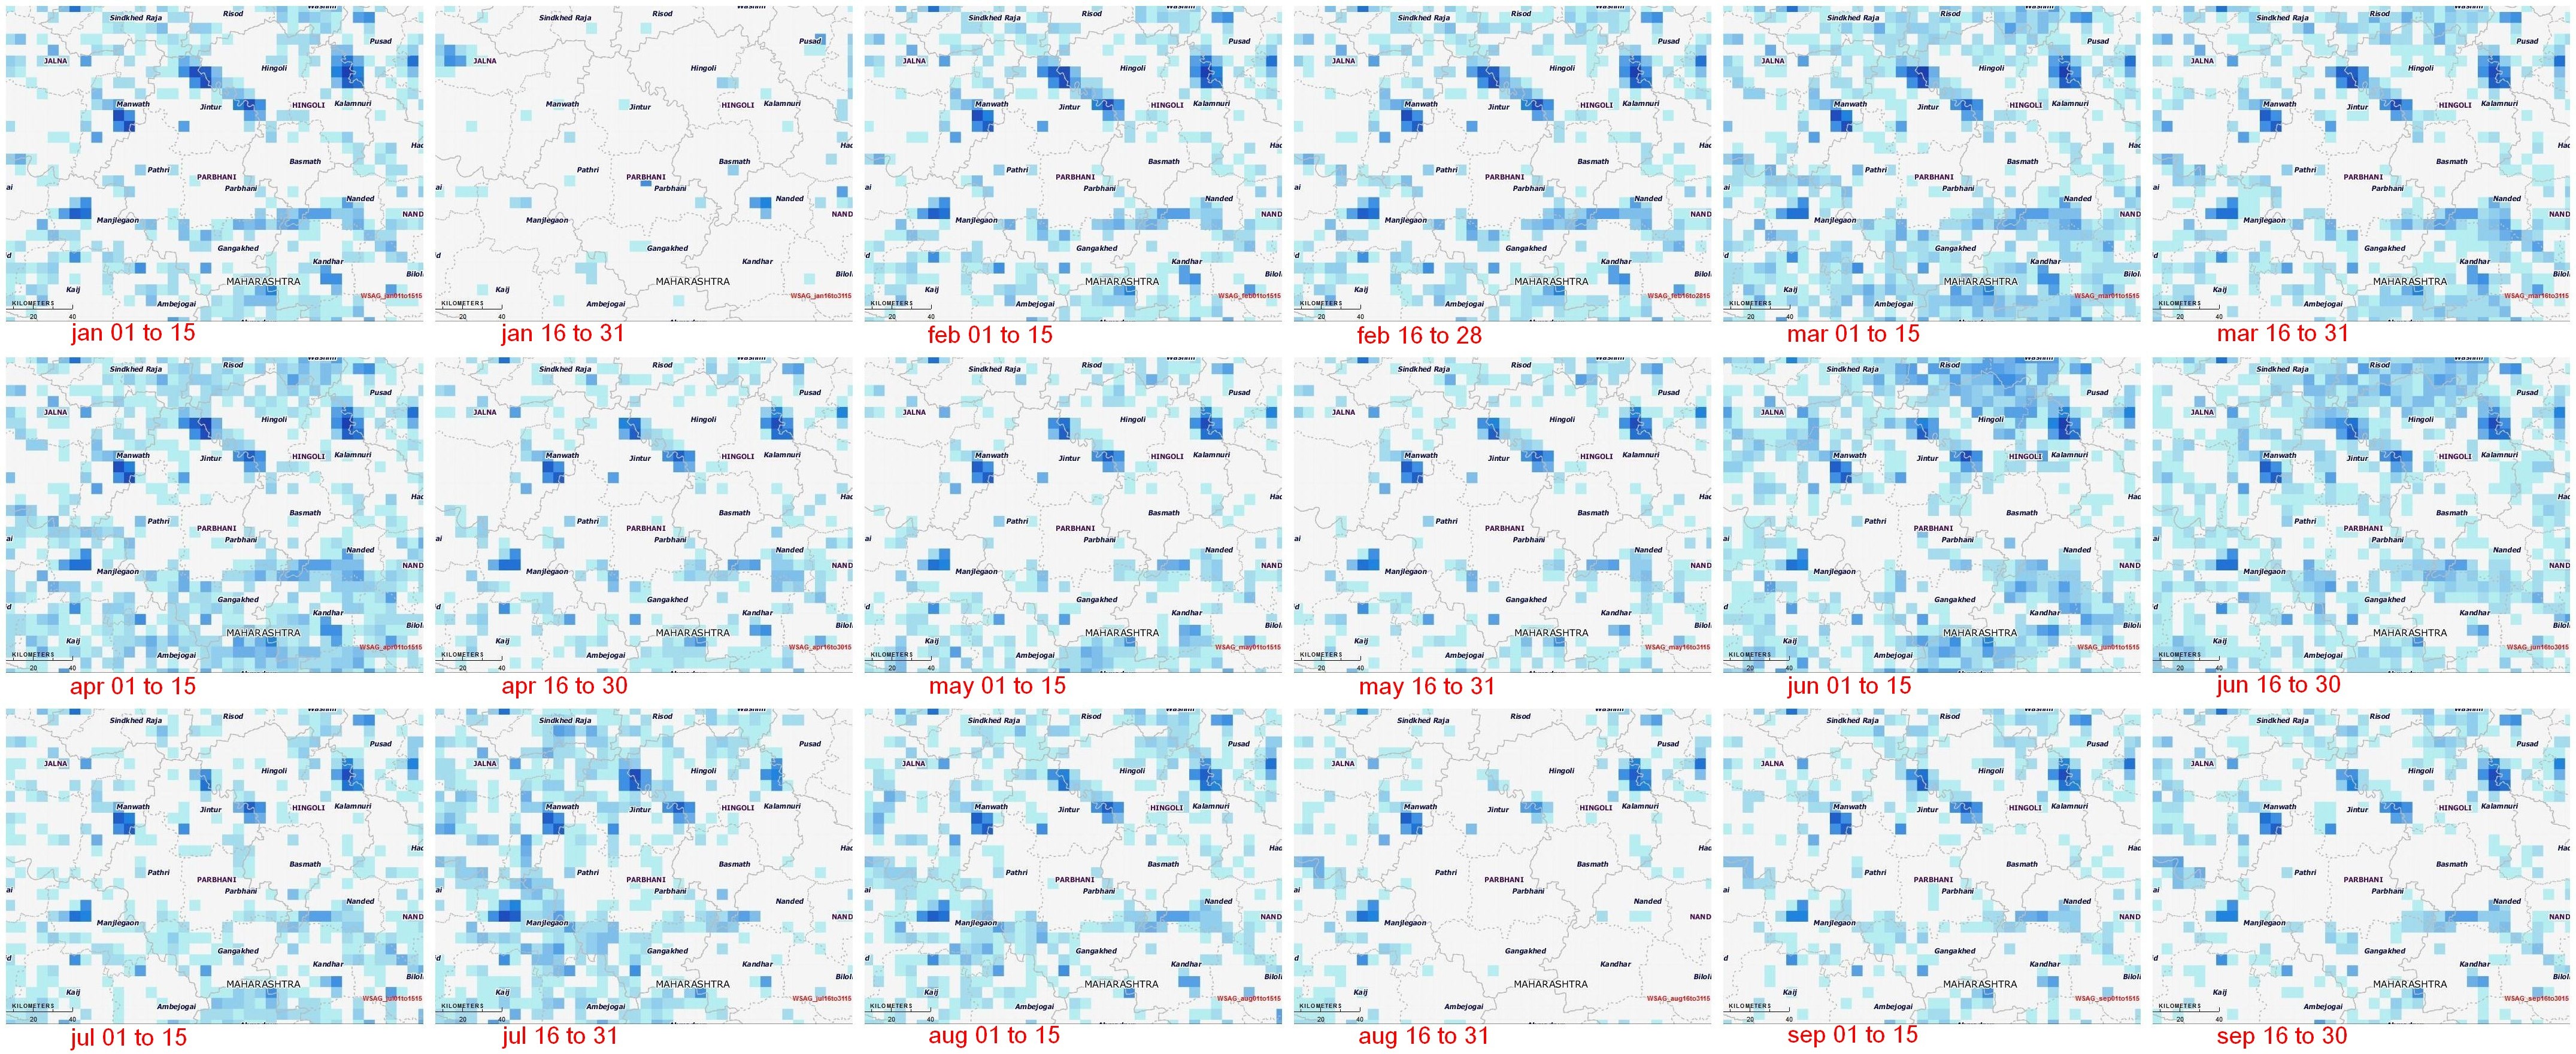
In this panel of maps the relationship between the district of Parbhani (in the Marathwada region of Maharashtra) and water is graphically depicted over time. The blue squares are water bodies, as seen by a satellite equipped to do so. The intensity of the blue colour denotes how much water is standing in that coloured square by volume – the deeper the blue, the more the water.
Water bodies consist of all surface water bodies and these are: reservoirs, irrigation tanks, lakes, ponds, and rivers or streams. There will be variation in the spatial dimensions of these water bodies depending on how much rainfall the district has recorded, and how the collected water has been used during the season and year. In addition to these surface water bodies, there are other areas representing water surface that may appear, such as due to flood inundations, depressions in flood plains, standing water in rice crop areas during transplantation stages. Other than medium and large reservoirs, these water features are treated as seasonal and some may exist for only a few weeks.
Click on this detail for a full size image (1.7MB) of the panel of fortnightly maps.
The importance of monitoring water collection and use at this scale can be illustrated through a very brief outline of Parbhani. The district has 830 inhabited villages distributed through nine tehsils that together occupy 6,214 square kilometres, eight towns, 359,784 households in which a population of 1.83 million live (1.26 rural and 0.56 million urban). This population includes 317,000 agricultural labourers and 295,000 cultivators – thus water use and rainfall is of very great importance for this district, and indeed for the many like it all over India.
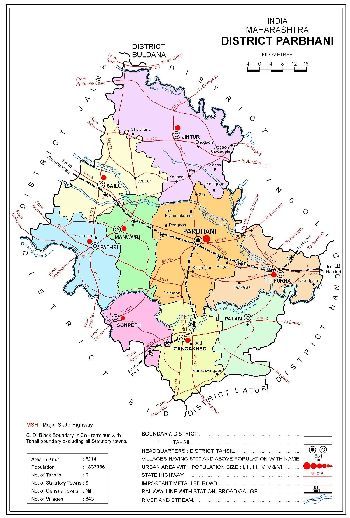
The map of Parbhani district and its talukas, from the Census 2011 District Census Handbook.
This water bodies map for Parbhani district is composed of 18 panels that are identical spatially – that is, centred on the district – and display the chronological progression of water accumulation or withdrawal. Each panel is a 15-day period, and the series of mapped fortnights begins on 1 January 2015.
The panels tell us that there are periods before the typical monsoon season (1 June to 30 September) when the accumulation of water in surface water bodies has been more than those 15-day periods found during the monsoon season. See in particular the first and second fortnights of March, and the first fortnight of April. [Here is a good quality image of the census map, 968KB.]
During the monsoon months, it is only the two fortnights of June in which the accumulation of water in the surface water bodies of Parbhani district can be seen. The first half of July and the second half of August in particular have been recorded as relatively dry.
This small demonstration of the value of such information, provided at no cost and placed in the public domain, is based on the programme ‘Satellite derived Information on Water Bodies Area (WBA) and Water Bodies Fraction (WBF)’ which is provided by the National Remote Sensing Centre (NRSC), Indian Space Research Organisation (ISRO), Department of Space, Government of India.
For any of our districts, such continuous monitoring is an invaluable aid to: facilitate the study of water surface dynamics in river basins and watersheds; analyse the relationships between regional rainfall scenarios and the collection and utilisation of water in major, medium reservoirs and irrigation tanks and ponds; inventory, map and administer the use of surface water area at frequent intervals, especially during the crop calendar applicable to district and agro-ecological zones. [Also posted on India Climate Portal.]
Lessons of monsoon 2015 for district India
 With two weeks of the June to September monsoon remaining in 2015, one of the end-of-season conclusions that the India Meteorological Department (IMD) has spoken of is that four out of ten districts in the country has had less rainfall than normal.
This overview is by itself alarming, but does not aid state governments and especially line ministries plan for coming months, particularly for agriculture and cultivation needs, water use, the mobilisation of resources for contingency measures, and to review the short- and medium-term objectives of development programmes. [See ‘A method for a post-carbon monsoon’ for a recent discussion.]
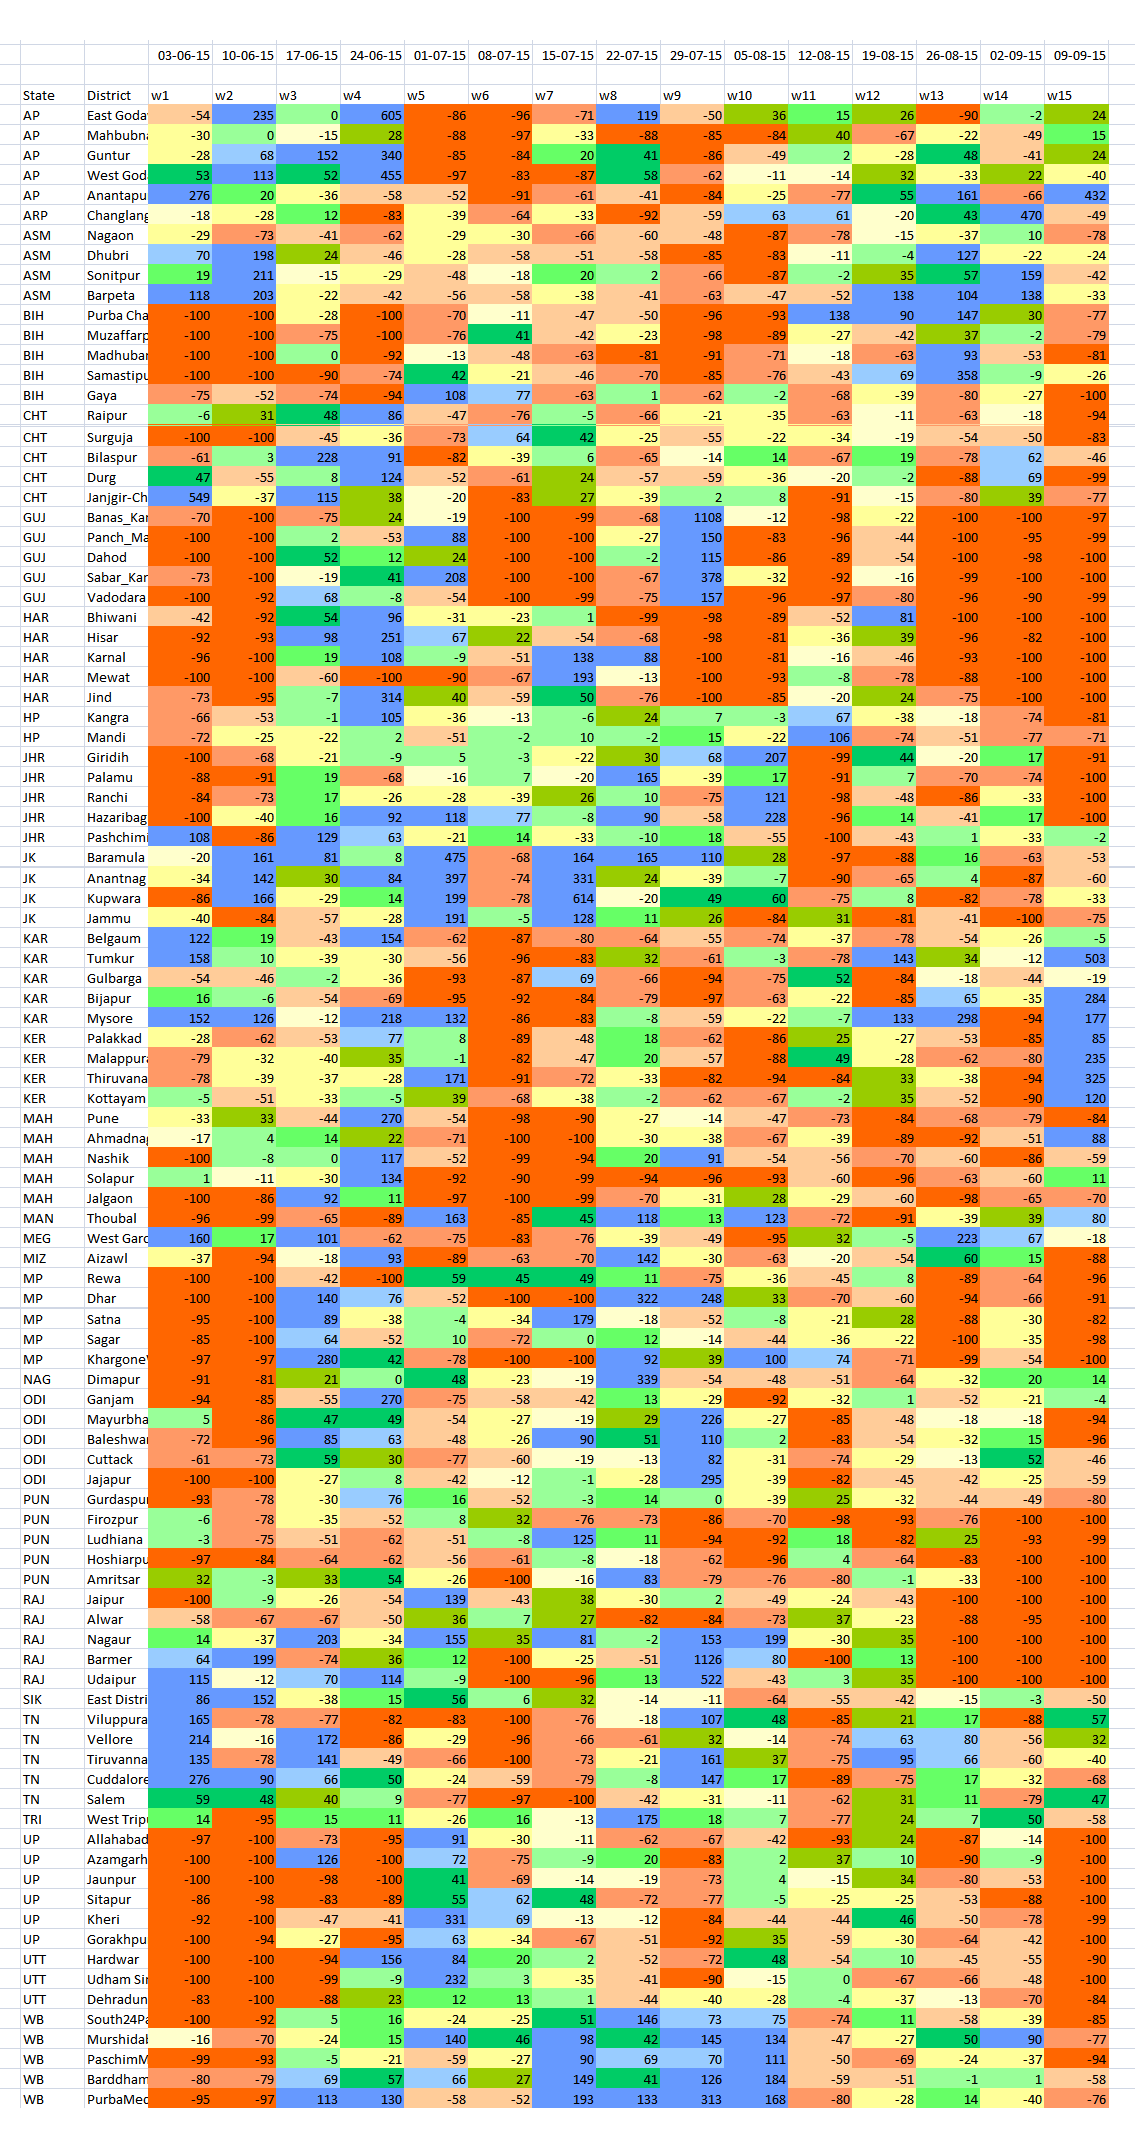 The detailed tabulation (done for 15 weeks) is meant to provide guidance of where this may be done immediately – in the next two to four weeks – and how this can be done in future. The districts are chosen on the basis of the size of their rural populations (calculated for 2015). Thus Purba Champaran in Bihar, Bhiwani in Haryana, Rewa in Madhya Pradesh and Viluppuram in Tamil Nadu are the districts in those states with the largest rural populations.
In this way, the effect of rainfall variability, from Week 1 (which ended on 3 June) to Week 15 (which ended on 9 September), in the districts with the largest rural populations can be analysed. Because a large rural population is also a large agricultural population, the overall seasonal impact on that district’s agricultural output can also be inferred.
The distribution of the districts is: six from Uttar Pradesh; five each from Andhra Pradesh, Bihar, Chhattisgarh, Gujarat, Haryana, Jharkhand, Karnataka, Maharashtra, Madhya Pradesh, Odisha, Punjab, Rajasthan, Tamil Nadu and West Bengal; four each from Assam, Jammu and Kashmir, and Kerala; three from Uttarakhand; two from Himachal Pradesh; one each from Arunachal Pradesh, Manipur, Meghalaya, Mizoram, Nagaland, Sikkim and Tripura.
Using the new 11-grade rainfall categorisation, a normal rainweek is one in which the rainfall is between +10% more and -10% less for that week. The overview for this group of 100 districts, only 11 have had five or more normal weeks of rain out of 15 weeks. In alarming contrast, there are 77 districts which have had three or fewer normal weeks of rain – that is, more than three-fourths of these most populous districts. Half the number (51 districts) have had two, one or no normal weeks of rain. And 22 of these districts have had only one or no normal weeks of rain.
From this group of 100 most populous (rural population) districts Gorakhpur in Uttar Pradesh and Nagaon in Assam have had the most deficit rainweeks, tallying 13, out of the 15 tabulated so far. There are ten districts which have had 12 deficit rainweeks out of 15 and they are (in decreasing order of rural population): Muzaffarpur (Bihar), Pune and Jalgaon (Maharashtra), Surguja (Chhattisgarh), Panch Mahals and Vadodara (Gujarat), Firozpur (Punjab), Thiruvananthapuram (Kerala), Hoshiarpur (Punjab) and Mewat (Haryana).
[Also posted by India Climate Portal as ‘Where they waited for rain in 2015’.]
A method for a post-carbon monsoon

The uses to which we have put available climatic observations no longer suit an India which is learning to identify the impacts of climate change. Until 2002, the monsoon season was June to September, there was an assessment in May of how well (or not) the monsoon could turn out, and short-term forecasts of one to three days were available only for the major metros and occasionally a state that was in the path of a cyclone. But 2002 saw the first of the four El Niño spells that have occurred since 2000, and the effects on our Indian summer monsoon began to be felt and understood.
The India Meteorology Department (which has become an everyday abbreviation of IMD for farmers and traders alike) has added computational and analytical resources furiously over the last decade. The new research and observational depth is complemented by the efforts of a Ministry of Earth Sciences which has channelled the copious output from our weather satellites, under the Indian Space Research Organisation (ISRO), and which is interpreted by the National Remote Sensing Centre (NRSC), to serve meteorological needs.
The IMD, with 559 surface observatories, 100 Insat satellite-based data collection platforms, an ‘integrated agro-advisory service of India’ which has provided district-level forecasts since 2008, a High Performance Computing System commissioned in 2010 (whose servers run at Pune, Kolkata, Chennai, Mumbai, Guwahati, Nagpur, Ahmedabad, Bengaluru, Chandigarh, Bhubaneswar, Hyderabad and New Delhi) ploughs through an astonishing amount of numerical data every hour. Over the last four years, more ‘products’ (as the IMD system calls them) based on this data and its interpretation have been released via the internet into the public domain. These are reliable, timely (some observation series have three-hour intervals), and valuable for citizen and administrator alike.

The new 11-grade indicator for assessing weekly rainfall departures in districts. Same data, but dramatically more useful guidance.
Even so, the IMD’s framing of how its most popular measures are categorised is no longer capable of describing what rain – or the absence of rain – affects our districts. These popular measures are distributed every day, weekly and monthly in the form of ‘departures from normal’ tables, charts and maps. The rain adequacy categories are meant to guide alerts and advisories. There are four: ‘normal’ is rainfall up to +19% above a given period’s average and also down to -19% from that same average, ‘excess’ is +20% rain and more, ‘deficient’ is -20% to -59% and ‘scanty’ is -60% to -99%. These categories can mislead a great deal more than they inform, for the difference between an excess of +21% and an excess of +41% can be the difference between water enough to puddle rice fields and a river breaking its banks to ruin those fields.
In today’s concerns that have to do with the impacts of climate change, with the increasing variability of the monsoon season, and especially with the production of food crops, the IMD’s stock measurement ‘product’ is no longer viable. It ought to have been replaced at least a decade ago, for the IMD’s Hydromet Division maintains weekly data by meteorological sub-division and by district. This series of running records compares any given monsoon week’s rainfall, in a district, with the long period average (a 50-year period). Such fineness of detail must be matched by a measuring range-finder with appropriate interpretive indicators. That is why the ‘no rain’, ‘scanty’, ‘deficient’, ‘normal’ or ‘excess’ group of legacy measures must now be discarded.
In its place an indicator of eleven grades translates the numeric density of IMD’s district-level rainfall data into a much more meaningful code. Using this code we can immediately see the following from the chart ‘Gauging ten weeks of rain in the districts’:
1. That districts which have experienced weeks of ‘-81% and less’ and ‘-61% to -80%’ rain – that is, very much less rain than they should have had – form the largest set of segments in the indicator bars.
2. That districts which have experienced weeks of ‘+81% and over’ rain – that is, very much more rain than they should have had – form the next largest set of segments in the indicator bars.
3. That the indicator bars for ‘+10% to -10%’, ‘-11% to -20%’ and ‘+11% to +20%’ are, even together, considerably smaller than the segments that show degrees of excess rain and degrees of deficient rain.

Far too many districts registering rainfall departures in the categories that collect extremes of readings. This is the detailed reading required to alert state administrations to drought, drought-like and potential flood conditions.
Each bar corresponds to a week of district rainfall readings, and that week of readings is split into eleven grades. In this way, the tendency for administrations, citizens, the media and all those who must manage natural resources (particularly our farmers), to think in terms of an overall ‘deficit’ or an overall ‘surplus’ is nullified. Demands for water are not cumulative – they are made several times a day, and become more or less intense according to a cropping calendar, which in turn is influenced by the characteristics of a river basin and of an agro-ecological zone.
The advantages of the modified approach (which adapts the Food and Agriculture Organisation’s ‘Global Information and Early Warning System’ categorisation, designed to alert country food and agriculture administrators to impending food insecurity conditions) can be seen by comparing the single-most significant finding of the IMD’s normal method, with the finding of the new method, for the same point during the monsoon season.
By 12 August 2015 the Hydromet Division’s weekly report card found that 15% of the districts had recorded cumulative rainfall of ‘normal’ and 16% has recorded cumulative rainfall of ‘deficient’. There are similar tallies concerning rainfall distribution – by region and temporally – for the meteorological sub-divisions and for states. In contrast the new eleven-grade measure showed that in seven out of 10 weeks, the ‘+81% and over’ category was the most frequent or next-most frequent, and that likewise, the ‘-81% and less’ category was also the most frequent or next-most frequent in seven out of 10 weeks. This finding alone demonstrates the ability of the new methodology to provide early warnings of climatic trauma in districts, which state administrations can respond to in a targeted manner.
