Posts Tagged ‘tehsil’
Water and a district in Maharashtra

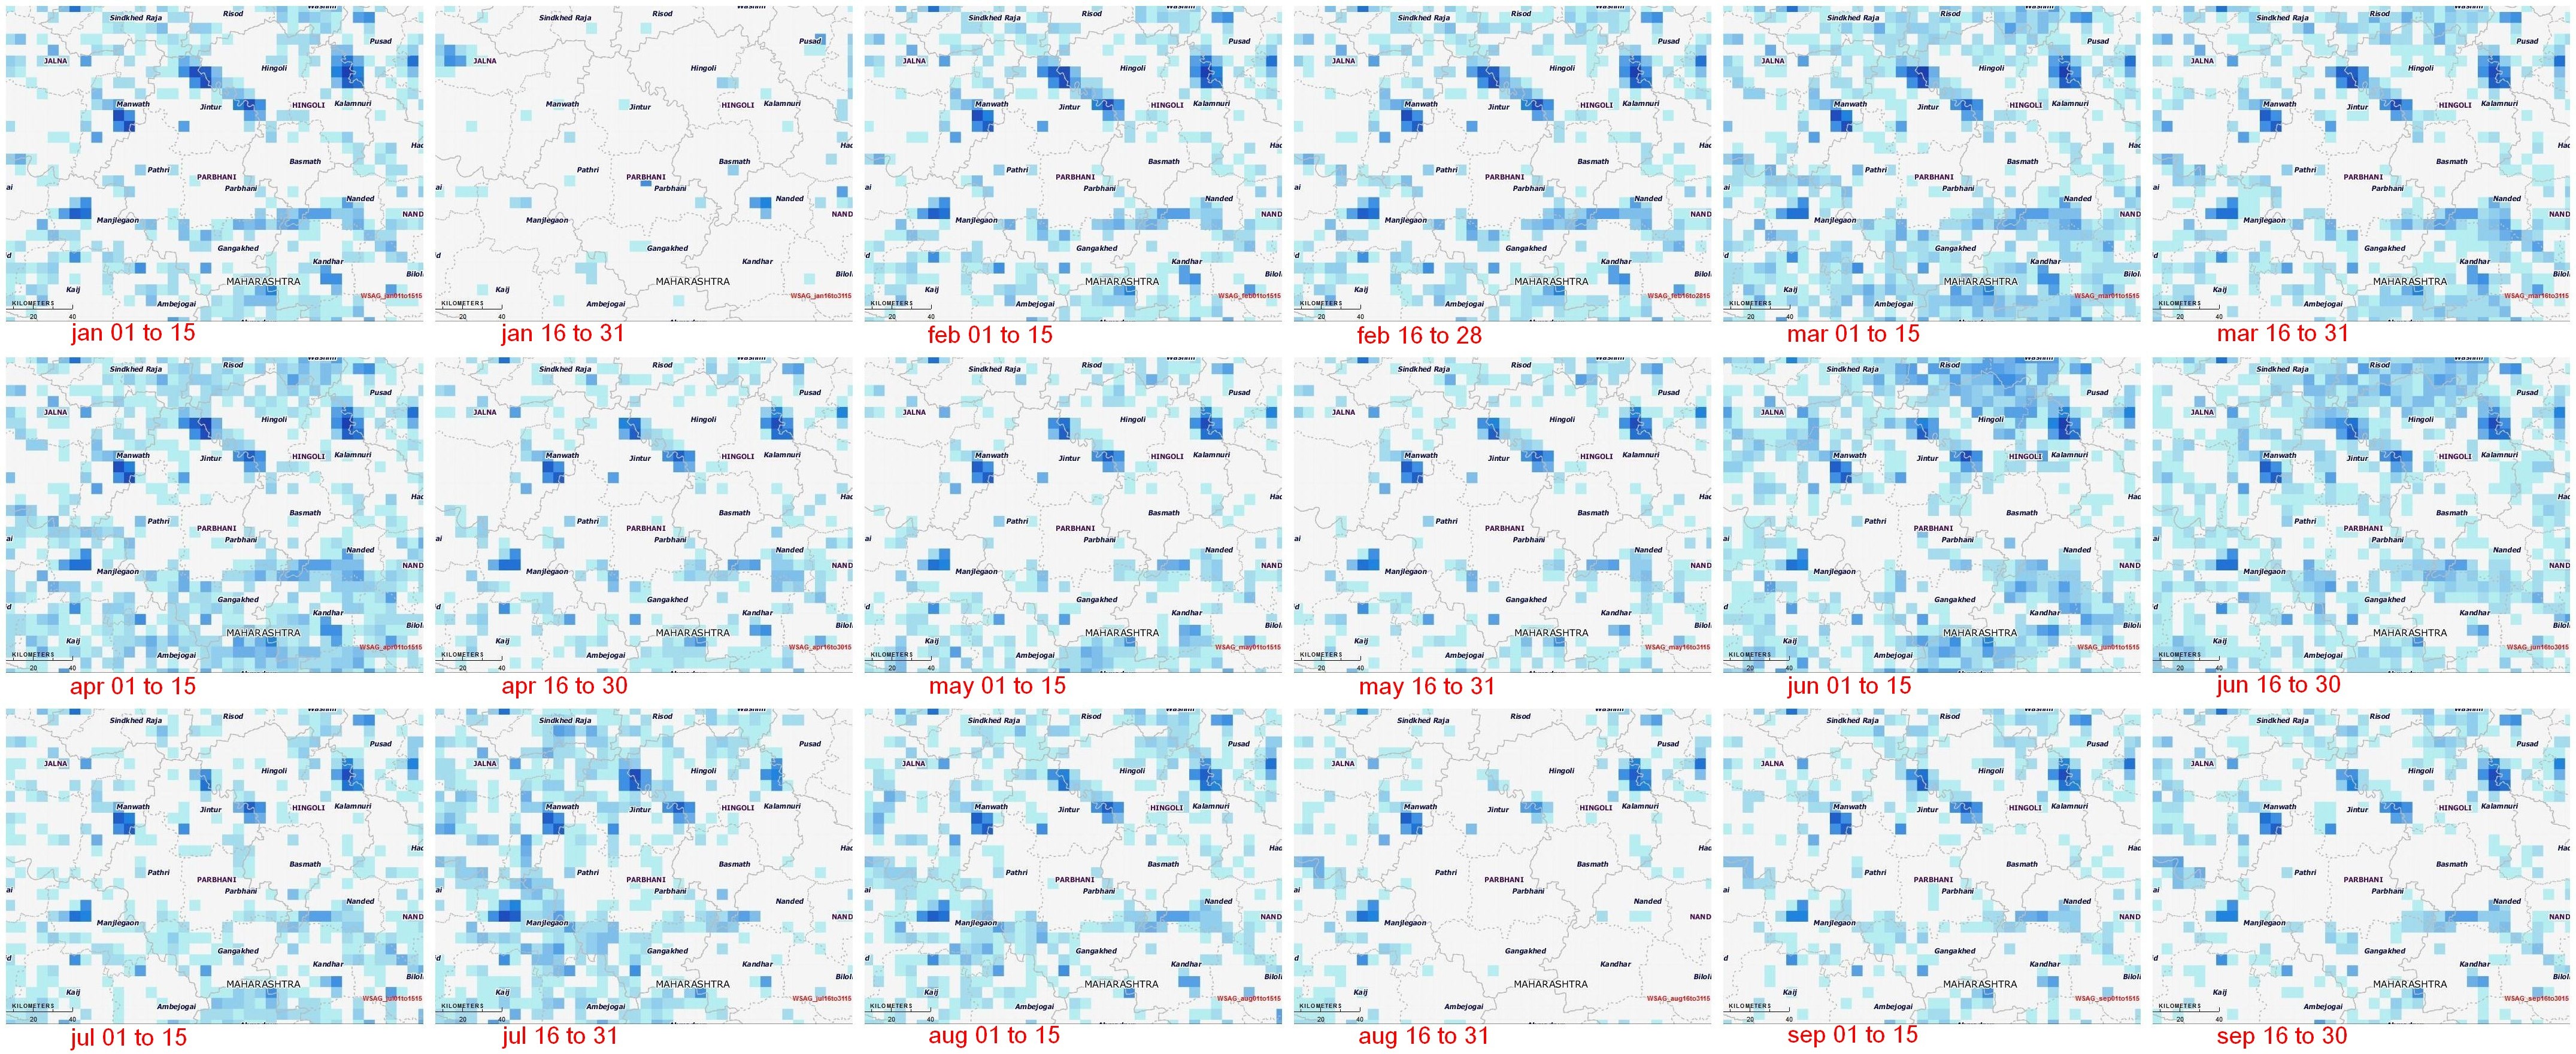
In this panel of maps the relationship between the district of Parbhani (in the Marathwada region of Maharashtra) and water is graphically depicted over time. The blue squares are water bodies, as seen by a satellite equipped to do so. The intensity of the blue colour denotes how much water is standing in that coloured square by volume – the deeper the blue, the more the water.
Water bodies consist of all surface water bodies and these are: reservoirs, irrigation tanks, lakes, ponds, and rivers or streams. There will be variation in the spatial dimensions of these water bodies depending on how much rainfall the district has recorded, and how the collected water has been used during the season and year. In addition to these surface water bodies, there are other areas representing water surface that may appear, such as due to flood inundations, depressions in flood plains, standing water in rice crop areas during transplantation stages. Other than medium and large reservoirs, these water features are treated as seasonal and some may exist for only a few weeks.
Click on this detail for a full size image (1.7MB) of the panel of fortnightly maps.
The importance of monitoring water collection and use at this scale can be illustrated through a very brief outline of Parbhani. The district has 830 inhabited villages distributed through nine tehsils that together occupy 6,214 square kilometres, eight towns, 359,784 households in which a population of 1.83 million live (1.26 rural and 0.56 million urban). This population includes 317,000 agricultural labourers and 295,000 cultivators – thus water use and rainfall is of very great importance for this district, and indeed for the many like it all over India.
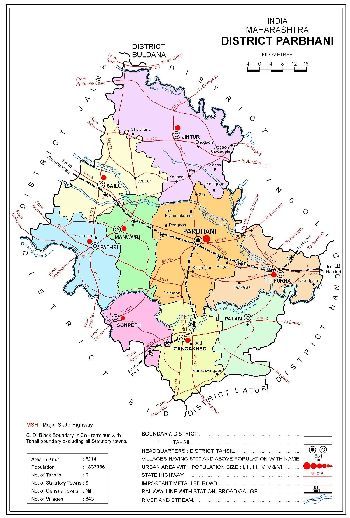
The map of Parbhani district and its talukas, from the Census 2011 District Census Handbook.
This water bodies map for Parbhani district is composed of 18 panels that are identical spatially – that is, centred on the district – and display the chronological progression of water accumulation or withdrawal. Each panel is a 15-day period, and the series of mapped fortnights begins on 1 January 2015.
The panels tell us that there are periods before the typical monsoon season (1 June to 30 September) when the accumulation of water in surface water bodies has been more than those 15-day periods found during the monsoon season. See in particular the first and second fortnights of March, and the first fortnight of April. [Here is a good quality image of the census map, 968KB.]
During the monsoon months, it is only the two fortnights of June in which the accumulation of water in the surface water bodies of Parbhani district can be seen. The first half of July and the second half of August in particular have been recorded as relatively dry.
This small demonstration of the value of such information, provided at no cost and placed in the public domain, is based on the programme ‘Satellite derived Information on Water Bodies Area (WBA) and Water Bodies Fraction (WBF)’ which is provided by the National Remote Sensing Centre (NRSC), Indian Space Research Organisation (ISRO), Department of Space, Government of India.
For any of our districts, such continuous monitoring is an invaluable aid to: facilitate the study of water surface dynamics in river basins and watersheds; analyse the relationships between regional rainfall scenarios and the collection and utilisation of water in major, medium reservoirs and irrigation tanks and ponds; inventory, map and administer the use of surface water area at frequent intervals, especially during the crop calendar applicable to district and agro-ecological zones. [Also posted on India Climate Portal.]
The slow counting of village India

On old maps and in dusty histories, our villages have formed the reliable background against which to describe empire and freedom. Many of the names in the humblest level of description found in Census 2011 can be traced back over generations.
M N Srinivas, the eminent sociologist who died in 1999, once wrote that a sociological study of Indian sociologists would yield interesting results. Over a century’s worth of rural enquiry, we have found that sociologists and anthropologists have been preoccupied with their discrete interests. The former consider urban planning, labour, housing, slum and informal economies, social vices, demography. The latter carefully study tribal cultures, ethnography, acculturation and cultural dynamics, evolution and ethnology.

A descriptive table from the excellent ‘Rural Profiles’, which appeared in the ‘Eastern Anthropologist’, Volume VIII, edited by D N Majumdar, 1955
But it is the macro-economists who have meanwhile perfected their techniques (however questionable, and most are) and who have begun to use quantitative data to understand and interpret the socio-economic problems of rural life. These problems have been studied with little or no attention paid to the cultural background, so that the inter-relations that exist between different sets of social phenomena have to a large extent been ignored (they can hardly be included in a computable general equilibrium model, can they?). From the time Srinivas’s work was charting new directions in the 1940s and 1950s, the call has been made over and again for a holistic approach, in which inter-disciplinary participation would be needed. But the macro-economic disequilibrists have thus far had the upper hand.
 And so to the numbers. There are 43,264 in Rajasthan, there are 25,372 in Assam and there are 40,959 in Maharashtra. That’s the village count in these states and this count (and the way villages are dispersed in the districts based on the size of their populations) is the focus of the latest data release from Census 2011.
Acknowledging the concern of the socio-economists, can there be an ‘average’ count for district? Yes there can, but finding one has little real use especially for the district concerned. Even so, to help us better understand the way a district is (and has for most of our recorded history) been organised I have used the data to find such an ‘average’. From the set of 631 districts that have villages (the others have none, being fully urban in character) I extracted the middle 505 districts (their villages count was from 138 to 1,817) and the median is 817 – that is, 817 villages in an ‘average’ district.
Where can we find such districts? Here are twelve: Garhwa in Jharkhand with 844, Rajkot in Gujarat with 833, Parbhani in Maharashtra with 830, Barpeta in Assam with 825, Mainpuri in Uttar Pradesh with 820, Ashoknagar in Madhya Pradesh with 818, Rangareddy in Andhra Pradesh with 817, Raichur in Karnataka with 815, Sitamarhi in Bihar with 808, Kota in Rajasthan with 805, Cuddalore in Tamil Nadu with 799 and Una in Himachal Pradesh with 790.

The richness of detail in careful village study. This too is from ‘Rural Profiles’, which appeared in the ‘Eastern Anthropologist’, Volume VIII, edited by D N Majumdar, 1955
Although the variation in the villages count is relatively small amongst these ‘average’ twelve (the least has under 10% less than the most) the rural populations in these districts vary widely. Una has a population of 476.000 and Ashoknagar has 691,000 whereas Rajkot has 1,590,000 and Sitamarhi has 3,233,000! In the same way, there are considerable differences in the areas cultivated, the forest cover, the sort of crops cultivated, and the available agricultural labour and cultivators who bring forth the crop from the soil. As I expand on the meaning of these new figures and draw some corelations with other aspects of our district enquiry – 1,670 is the ‘average’ population of a village, for example – we will venture a little closer to the sort of holistic study that Srinivas and his colleagues had called for about six decades ago.
[The new set of data released by Census 2011 has: (1) a note on villages by population, (2) tables by district and by taluka / tahsil / block (excel file), (3) percentage of population living in villages of various population size with reference to the total rural population in 2011, (4) percentage of villages and population by class of villages in 2001 and 2011, (5) the number of villages whose populations are 10,000 and above, 2001-2011, (6) distribution of 10,000 villages of each class, all-India, and 10,000 population in each class of villages, all-India, among states and union territories.]
India’s 2011 Census, a population turning point

With most of the final data tables now available, I am now (2015 November) consolidating and reorganising this extensive article about the Census of India 2011. This will take the following forms: (1) links to and explanations about the main data categories, (2) links to the sections containing detailed tables, forms, past censuses, geographical codes and administrative maps, (3) listings by state and union territory of the tables available in the main data categories, (4) analytical matter about demographics and trends.
1.1 Main categories – Primary Census Abstract data
Please now refer to these links. Sections that will shortly be added here are: Villages By Population, Age Data, Data on Disability, Data on Education, Data on Religion, Data on Scheduled Castes, Data on Scheduled Tribes, Household Series, Data on workers, Data On Marital Status, Fertility Data, Post Enumeration Survey, Miscellaneous Tables.

1.2 Household series data
The household tables and the primary census abstract tables will shortly be cross-referenced with states and union territories. This will make it easier to find and get directly the spreadsheets with district-level data.

1.3 Workers (main, marginal, education, activity, gender)

1.4 Education (7 and above, 15 and above, by institution, gender)
The older material is appended below and continues to serve as a useful guide to the many aspects of the Census of India 2011, the world’s largest and most detailed population enumeration, which informs us about the people of Bharat from the largest metropolis to the smallest rural hamlet.

Major update, 2014 November – It has been three years since regular releases of data from Census 2011 began. As the major data sets have been placed in the public domain, the Census of India website has changed to accommodate the new demands.
Here are the new links for final population totals, and for the major tables in the census:
Primary Census Abstract Data for Houseless (India & States/UTs – District Level, Excel)
Primary Census Abstract Data for Scheduled Tribes (SC) (India & States/UTs – District Level, Excel)
Primary Census Abstract Data for Scheduled Tribes (ST) (India & States/UTs – District Level, Excel)
Primary Census Abstract Data for Slum (India & States/UTs – Town Level, Excel)
Primary Census Abstract Data Highlights – 2011 (new page for India and States/UTs)
Primary Census Abstract Data Tables (new page for India and States/UTs – District Level, Excel)
Primary Census Abstract Data Tables (new page for India and States/UTs – Town/Village/Ward Level)
Primary Census Abstract Data for Others (India & States/UTs, Excel)
Brief Introduction to Primary Census Abstract Data for Others (pdf)
Decadal Variation In Population Since 1901 (new page)
Brief Introduction to A-2 Decadal Variation In Population Since 1901 (pdf)
Individual Scheduled Caste Primary Census Abstract Data and its Appendix (new page)
Individual Scheduled Tribe Primary Census Abstract Data and its Appendix (new page)
Brief Introduction to Individual SC / ST Primary Census Abstract Data and its appendix (pdf)
20140304 – Major update – Extensive new data tables have been made available for public use by the Census of India. These include: (1) Primary Census Abstract tables to the village and ward level, (2) consolidated top level datasheets for Population Enumeration Data, population living in villages, age data, and data on disability.
Here they are:
[Set 1] Primary Census Abstract Data (Final Population); Primary Census Abstract Data for Houseless (India & States/UTs – District Level) ; Primary Census Abstract Data for Scheduled Castes (SC) (India & States/UTs – District Level) ; Primary Census Abstract Data for Scheduled Tribes (ST) (India & States/UTs – District Level) ; Primary Census Abstract Data for Slum (India & States/UTs – Town Level) ; Primary Census Abstract Data Highlights – 2011 (India & States/UTs) ; Primary Census Abstract Data Tables (India & States/UTs – District Level) ; Primary Census Abstract Data Tables (India & States/UTs – Town/Village/Ward Level).
[Set 2] Villages By Population ; Village population Tables ; Percentage of population living in villages of various population size with reference to the total rural population: 2011 ; Percentage of villages and population by class of villages in 2001 and 2011 ; Statement showing the number of Villages of population 10,000 and above with their population: 2001-2011 ; Distribution of 10,000 villages of each class in All India and 10,000 population in each class of villages All India among the States and Union Territories.
[Set 3] Single Year Age Data – (India/States/UTs) ; Single Year Age Data for Scheduled Castes (SC) ; Single Year Age Data for Scheduled Tribes (ST) ; Five Year Age Group Data ; Five Year Age Data for Scheduled Castes (SC) ; Five Year Age Data for Scheduled Castes (ST).
[Set 4] Disabled Population by type of Disability, Age and Sex (India & States/UTs – District Level) ; Disabled Population by type of Disability, Age and Sex For Scheduled Castes (India & States/UTs – District Level) ; Disabled Population by type of Disability, Age and Sex For Scheduled Tribes (India & States/UTs – District Level).
20131213 – Major update – And so to the numbers.
On old maps and dusty histories, our villages have formed the reliable background against which to describe empire and freedom. Many of the names in the humblest level of description found in Census 2011 can be traced back over generations.
There are 43,264 in Rajasthan, there are 25,372 in Assam and there are 40,959 in Maharashtra. That’s the village count in these states and this count (and the way villages are dispersed in the districts based on the size of their populations) is the focus of the latest data release from Census 2011.
Can there be an ‘average’ count for district? Yes there can, but finding one has little real use especially for the district concerned. Even so, to help us better understand the way a district is (and has for most of our recorded history) been organised I have used the data to find such an ‘average’. From the set of 631 districts that have villages (the others have none, being fully urban in character) I extracted the middle 505 districts (their villages count was from 138 to 1,817) and the median is 817 – that is, 817 villages in an ‘average’ district.
Where can we find such districts? Here are twelve: Garhwa in Jharkhand with 844, Rajkot in Gujarat with 833, Parbhani in Maharashtra with 830, Barpeta in Assam with 825, Mainpuri in Uttar Pradesh with 820, Ashoknagar in Madhya Pradesh with 818, Rangareddy in Andhra Pradesh with 817, Raichur in Karnataka with 815, Sitamarhi in Bihar with 808, Kota in Rajasthan with 805, Cuddalore in Tamil Nadu with 799 and Una in Himachal Pradesh with 790.
The new set of data released by Census 2011 has: (1) a note on villages by population, (2) tables by district and by taluka / tahsil / block (excel file), (3) percentage of population living in villages of various population size with reference to the total rural population in 2011, (4) percentage of villages and population by class of villages in 2001 and 2011, (5) the number of villages whose populations are 10,000 and above, 2001-2011, (6) distribution of 10,000 villages of each class, all-India, and 10,000 population in each class of villages, all-India, among states and union territories.
20130903 – Major update – The ‘primary census abstract’ is the most important record for a settlement, whether a rural hamlet or an urban town ward. This contains the population, gender ratio, literacy rate, proportion of children, the numbers of scheduled tribe and caste members, and also contains the four-fold break-up of the working population. Please see ‘The data vault of the 2011 Indian Census‘ for full and comprehensive data sheets.
20130501 – Very major update – The Census of India has released the first data batch of the primary census abstract. This release of the PCA is detailed down to district level and you will find more information, and individual data for states and union territories here.
20120229 – Info update – A documentary film on the Census of India 2011 has been released. The shorter version of the film is available on YouTube and is worth watching also for its scenes of contemporary village and urban India – lots of ethnic diversity and very colourful. The film was produced by the National Film Development Corporation and documents the Census process.
20111021 – Major update – The urban-rural population data release.
 This is an extremely important data set for planners and administrators in the major ministries and of course for all those in social sector fields. The new group of data files lists all the districts, their total population with rural and urban components, the population of the 0-to-six years age group and the population of literates, in all cases by male and female.
The text that follows is taken from the ‘data highlights’ file which provides a very good overview of the scope of this data release. You will also find a set of links to the pdf and xls files released by the Census 2011.
Census 2011 lists 7,935 towns in India. The number of towns has increased by 2,774 since the last Census (2001). Many of these towns are part of urban agglomerations and the rest are independent towns. The total number of urban agglomerations/towns, which constitutes the urban frame, is 6,166 in all states and union territories.
Population of UAs/Towns:
1. The total urban population in the country as per Census 2011 is more than 377 million constituting 31.16% of the total population.
2. Class I UAs/Towns: The UAs/Towns are grouped on the basis their population in Census. The UAs/Towns which have at least 1,00,000 persons as population are categorised as Class I UA/Town. At the Census 2011, there are 468 such UAs/Towns. The corresponding number in Census 2001 was 394.
 3. 264.9 million persons, constituting 70% of the total urban population, live in these Class I UAs/Towns. The proportion has increased considerable over the last Census. In the remaining classes of towns the growth has been nominal.
4. Million Plus UAs/Towns: Out of 468 UAs/Towns belonging to Class I category, 53 UAs/Towns each has a population of one million or above each. Known as Million Plus UAs/Cities, these are the major urban centres in the country. 160.7 million persons (or 42.6% of the urban population) live in these Million Plus UAs/Cities.18 new UAs/Towns have been added to this list since the last Census.
5. Mega Cities: Among the Million Plus UAs/Cities, there are three very large UAs with more than 10 million persons in the country, known as Mega Cities. These are Greater Mumbai UA (18.4 million), Delhi UA (16.3 million) and Kolkata UA (14.1 million). The largest UA in the country is Greater Mumbai UA followed by Delhi UA. Kolkata UA which held the second rank in Census 2001 has been replaced by Delhi UA. The growth in population in the Mega Cities has slowed down considerably during the last decade. Greater Mumbai UA, which had witnessed 30.47% growth in population during 1991-2001 has recorded 12.05% during 2001-2011. Similarly Delhi UA (from 52.24% to 26.69% in 2001-2011) and Kolkata UA (from 19.60% to 6.87% in 2001-2011) have also slowed down considerably.
 Child Population (0-6 years):
6. Population of children in the age group is 158.8 million in Census 2011. In the urban areas there are 41.2 million children in this age group. In comparison to Census 2001, the number of children (0-6) in urban areas has increased (by 10.32%), while in the rural areas it has decreased by 7.04%.
7. Of the 41.2 million children (0-6) in the urban areas in the country, the population in Class I UAs/Cities is 27.9 million, which is about 67.8% of the total Urban child population. In Million Plus UAs/Cities the Child Population (0-6) is 16.6 million constituting about 40 % of the total urban child (0-6) population of the country.
8. Among the 53 Million Plus UAs/Cities 16.6 million are children (0-6), of which 52.7% are boys and 47.3% are girls, showing a preponderance of male children in these large cities.
9. Malappuram UA has the highest proportion of Children (0-6) (13.57%) in the Million Plus category, followed by Ghaziabad (13.09%). Kolkata UA has the lowest proportion at 7.54%.
The data files:
Data Highlights [pdf, 32 kb]
Population by gender and residence, Census 2011 [pdf, 412 kb] [xls, 319 kb]
Cities with population 100,000 and above [pdf, 152 kb] [xls, 190 kb]
Urban agglomerations/cities with population 100,000 and above [pdf, 138 kb] [xls, 179 kb]
Urban agglomerations/cities with population 1 million and above [pdf, 20 kb] [xls, 35 kb]
Constituents of urban agglomerations with population 100,000 and above, Census 2011 [pdf, 162 kb] [xls, 251 kb]
Urban agglomerations spread over more than one district [pdf, 10 kb] [xls, 24kb]
Abbreviations [pdf, 7 kb] [xls, 28 kb]
 Gender Ratio:
10. Gender ratio, the number of females per thousand males, in urban areas in India is 926 in Census 2011. It has registered an increase of 26 points over the Gender ratio in 2001 Census.
11. Gender ratio in Class I UAs/Cities (population of 100,000 and above) is 921, which is 5 points lower than the total urban gender ratio in the country.
12. Among the Million Plus UAs/Cities the Gender Ratio stands at 912. The UAs, where population of females exceeds the total male population in this group are Kannur UA (Kerala) at the top with 1168. Surat UA (Gujarat) is at the bottom of the list with Gender Ratio at 754 where males outnumber females.
13. In the two of the three mega cities there is predominance of male population as they have returned low Gender Ratio (e.g., Greater Mumbai UA – 861, Delhi UA – 867). Kolkata UA has returned a better gender ratio at 928.
 Child gender Ratio (0-6 years):
14. The Child gender Ratio in the country has declined from 927 to 914 in Census 2011. This decline is more pronounced in rural areas than in urban areas of the country, where the decline is by 4 points from 906 to 902 in Census 2011.
15. The Child gender Ratio in UAs/Cities with 100,000 persons and above is 899 which is marginally lower than the national average for urban areas.
16. The combined Child gender Ratio in Million Plus UAs/Cities is 898. Thiruananthapuram UA (Kerala) has returned the highest Child gender Ratio (971) in this group. The lowest slot is occupied by Agra UA (780).
17. Child gender Ratio in the three Mega Cities are 946 (Kolkata UA), 900 (Greater Mumbai UA) and the lowest in 868 (Delhi UA).
 Literacy Rate:
18. The literacy rates among both males and females have shown improvement in Census 2011 compared to the last Census. The literacy rate in the country as a whole is 74.04%. In the rural and the urban areas the literacy rates are 68.9% and 84.9% respectively.
19. The female literacy rate in rural and urban areas shows wide variation. In the urban areas of the country the female literacy rate is 79.92% in the rural areas it is only 58.75%.
20. In the 468 UAs/Towns the progress in literacy has been quite encouraging. In 89 UAs/Cities the total Literacy Rate has crossed the 90% mark. The corresponding number of UAs/Cities in Census 2001 was only 23 in Census 2011. In another 288 UAs/Cities, the Literacy rate ranges between 80% to 90%, improving from 197 in Census 2001.
21. The total Literacy Rate in Greater Mumbai UA is 90.78%, the highest among the mega cities. The Literacy Rate in Delhi and Kolkata are 86.43% and 88.33% respectively. The female literacy rate is also the highest in Greater Mumbai UA (87.19) the top three megacities.
20110926 – Major update – In the Paper 2 series 12 more states and union territories have been added.
 In the ‘Provisional Population Totals Paper 2 of 2011′ series you will find most of the new data concerns administrative divisions in the state (or UT), several ‘At a Glance’ compilations of data and charts, decadal growth rates for populations and the percentage shares (under various categories) of populations.
There are also gender ratios by residence, child population (with associated decadal growth characteristics, gender ratios and percentages), literates and literacy rates (also by residence).
The new entrants follow below. One state only remains and that is Jammu and Kashmir – perhaps by this week the paper 2 series will also be complete. I will post the details here as soon as that happens.
Arunachal Pradesh, Assam
Bihar, Chhattisgarh
Jharkhand, Lakshadweep
Maharashtra, Manipur
Meghalaya, Mizoram
Tripura, Uttarakhand
 20110822 – Major update – The Census of India has begun releasing – as part of its Paper 2 series – the state and union territory results for rural-urban populations, literacy, child gender ratios and administrative units maps. I am listing the state/UT releases issued so far, followed by the major new data files for those states/UTs:
Andaman & Nicobar Islands
Andhra Pradesh
Gujarat
Haryana
Himachal Pradesh
Karnataka
 Kerala
NCT of Delhi
Orissa
Tamil Nadu
Chandigarh
Dadra and Nagar Haveli
Daman and Diu
Goa
 Madhya Pradesh
Nagaland
Puducherry
Punjab
Rajasthan
Sikkim
Uttar Pradesh
West Bengal
Andaman & Nicobar Islands
Provisional Population Totals (pdf, 1.52 MB)
Andhra Pradesh
Percentage of Urban Population (Map)(pdf, 233 kB) ; Figures at a Glance (pdf, 351 kB) ; Population, Decadal growth Rate, sex ratio by residence (pdf, 5.17 MB) ; Child population, Decadal growth, child sex ratio by residence (pdf, 6.97 MB) ; Literates, Literacy rate by residence, Literacy rate by gender (pdf, 6.24 MB)
 NCT of Delhi
Provisional Population Totals (pdf, 8.04 MB)
Gujarat
Figures at a Glance (pdf, 77 kB) ; Population, Decadal Growth Rate, Sex Ratio by Residence (pdf, 2.62 MB) ; Child Population, Decadal Growth, Child Sex Ratio by Residence (pdf, 1.15 MB) ; Literates and Literacy Rate By Residence (pdf, 1.70 MB)
Haryana
Figures at a Glance (pdf, 144 kB) ; Highlights of Haryana (pdf, 185 kB) ; Percentage of Urban Population to Total (Map)(pdf, 208 kB) ; Percentage Decadal Growth Rate of Urban Population 2001-2011 (Map)(pdf, 203 kB) ; Population, Decadal Growth Rate, Sex Ratio by Residence (pdf, 876 kB) ; Child Polulation, Decadal Growth, Child Sex Ratio By Residence (pdf, 1.24 MB) ; Literates and Literacy Rate by Residence (pdf, 916 kB)
20110725 – Major update – The Census of India has released its Paper 2 of the 2011 Census. This provides the national and state-level data for urban and rural populations and their growth rates. The summary of the update follows:

Administrative Units: Census 2011 covered 35 States/Union Territories, 640 districts, 5,924 sub-districts, 7,935 Towns and 6,40,867 Villages. In Census 2001, the corresponding figures were 593 Districts, 5,463 sub-Districts, 5,161 Towns and 6,38,588 Villages. There is an increase of 47 Districts, 461 Sub Districts, 2774 Towns (242 Statutory and 2532 Census Towns) and 2279 Villages in Census 2011 as compared to Census 2001.
Population: As per the Provisional Population Totals of Census 2011, the total population of India was 1210.2 million. Of this, the rural population stands at 833.1 million and the urban population 377.1 million. In absolute numbers, the rural population has increased by 90.47 million and the urban population by 91.00 million in the last decade. Uttar Pradesh has the largest rural population of 155.11 million (18.62% of the country’s rural population) whereas Maharashtra has the highest urban population of 50.83 million (13.48% of country’s urban population) in the country.
Growth Rate: The growth rate of population for India in the last decade was 17.64%. The growth rate of population in rural and urban areas was 12.18% and 31.80% respectively. Bihar (23.90%) exhibited the highest decadal growth rate in rural population.

Urban population percentages for states, 2011
Proportion of Population: In percentage terms, the rural population formed 68.84% of the total population with the urban population constituting 31.16% (increase of 3.35%). Himachal Pradesh (89.96%) has the largest proportion of rural population, while Delhi (97.50%) has the highest proportion of urban population. The EAG States have a lower percentage of urban population (21.13%) in comparison to non EAG States (39.66%).
Sex Ratio: The Sex Ratio in the country which was 933 in 2001 has risen by 7 points to 940 in 2011. The increase in rural areas has been 1 point from 946 to 947. The same in urban areas has been 26 points from 900 to 926. Kerala has the highest sex ratio in total (1084), rural (1077) and urban (1091). In rural, Chandigarh (691) and in urban, Daman & Diu (550) show the lowest sex ratio in the country respectively. Eight states namely Jammu & Kashmir, Himachal Pradesh, Uttarakhand, Bihar, Jharkhand, Chhattisgarh, Maharashtra, Karnataka and 1 UT Lakshadweep show fall in the sex ratio in rural area and 2 Union Territories, Daman & Diu and Dadra & Nagar Haveli, in urban areas.
Child Population (0-6 years): Out of the child population of 158.8 million in the age group of 0-6 in the country the rural child population stands at 117.6 million and urban at 41.2 million in 2011. The Child population has declined by 5.0 million in the country – decline of 8.9 million in rural areas and increase of 3.9 million in urban areas. The Country has observed a decline in the percentage of child population in the age group 0-6 years by about 3 percentage points over the decade – rural areas show a decline of about 3 % and urban a decline of 2%. The growth rate of Child population has been -3.08% in the last decade (Rural- (-)7.04%; Urban- (+)10.32%).
Child Sex Ratio (0-6 years): Census 2011 marks a considerable fall in child sex ratio in the age group of 0-6 years and has reached an all time low of 914 since 1961. The fall has been 13 points (927-914) for the country during 2001-2011. In rural areas, the fall is significant – 15 points (934-919) and in urban areas it has been 4 points (906-902) over the decade 2001-2011. Delhi (809) has recorded the lowest and Andaman & Nicobar Islands (975) the highest child sex ratio in rural areas. Haryana (829) has recorded the lowest and Nagaland (979) the highest child sex ratio in urban areas.

Urban population percentages for states, 2001
Number of Literates: As per the Provisional Population Totals of Census 2011, the number of literates in India was 778.5 million. Of this, 493.0 million literates were in rural areas and 285.4 million literates in urban areas. Out of an increase of 217.8 million literates over the decade 2001-2011, rural areas accounted for 131.1 million and urban areas 86.6 million. The highest number of rural literates has been recorded in Uttar Pradesh (88.4 million). Maharashtra (40.8 million) has recorded the highest number of literates in urban areas.
Literacy Rate: The Literacy Rate of India as per the Provisional Population Totals of Census 2011 is 74.04. In rural areas the Literacy Rate is 68.91 and in urban areas it is 84.98. The decadal change works out to 9.21 points – 10.17 points in rural areas and 5.06 points in urban areas respectively. The male Literacy Rate which is 82.14 (Rural- 78.57; Urban-89.67) is higher than the female Literacy Rate of 65.46 (Rural- 58.75; Urban-79.92). The increase in female literacy rate is significantly higher in all areas i.e. total (11.79 points), rural (12.62 points) and urban (7.06 points) in comparison to corresponding male literacy rates – total (6.88 points), rural (7.87) and urban (3.40 points) over the decade. It is significant to note that the gap in literacy rate among males and females has reduced to 16.68 in the country. The gap is 19.82 points in rural areas and 9.75 points in urban areas.
Kerala (92.92) ranks first in rural areas whereas Mizoram (98.1) ranks first in urban areas. As far as Male literacy rate is concerned, Kerala (95.29) ranks first in rural areas whereas Mizoram (98.67) ranks first in urban areas. Rajasthan (46.25) has recorded lowest female literacy rate in rural areas, whereas, Jammu & Kashmir (70.19) has the lowest female literacy rate in urban areas. Lowest male literacy rate in rural areas has been recorded in Arunachal Pradesh (68.79) and in urban areasin Uttar Pradesh (81.75).
[The full contents of Paper 2 of the 2011 Census can be found here.] Paper 2 sections and data links are:
India at a Glance by Rural, Urban Distribution [pdf, 1.1 MB]
Rural Urban Distribution of Total Population [pdf, 22.5 MB]
Rural Urban Distribution of Child Population [pdf, 18.0 MB]
Rural Urban Distribution of Literacy [pdf, 17.5 MB]
Administrative Units [pdf, 1.5 MB]
General Notes [pdf, 1.2 MB]
Rural-Urban Data Sheets [pdf, 7.9 MB]
Rural Urban distribution of population and proportion of Rural and Urban population [xls, 15kb]
Population and Sex ratio by residence [xls, 18kb]
Population, decadal variation and percentage share of population by residence [xls, 16kb]
Child population in the age group 0-6 years, percentage and sex ratio (0-6) by residence [xls, 15kb]
Number of literates and Literacy Rate by sex and residence [xls, 16kb]
A presentation on Rural-Urban distribution of Population [pdf, 2.5 MB]
Executive Summary [pdf, 62kb]
20110628 – The India Census 2011 page has been updated with the full text of Chapter 8 of the first official paper on the census. This deals with population projections.
20110523 – Major addition – Datasheets are now listed and linked for 21 of the major states. The states are: Andhra Pradesh, Assam, Bihar, Chhattisgarh, Delhi, Gujarat, Haryana, Himachal Pradesh, Jammu and Kashmir, Jharkhand, Karnataka, Kerala, Madhya Pradesh, Maharashtra, Odisha/Orissa, Punjab, Rajasthan, Tamil Nadu, Uttar Pradesh, Uttarakhand, West Bengal
20110515

The enumerator, India’s 2011 census illustration icon, representing the 2.7 million enumerators and supervisors, “the heroines and heroes of Census 2011”.
The first set of detailed state-level data is almost complete as a release from the Census of India, 2011 Census. In the post titled ‘India’s 2011 Census – the states and their prime numbers’ I am providing the data types for each state and the links to the Census documents. So far, data sheets for 12 states are listed and linked. These are Andhra Pradesh, Assam, Bihar, Chhattisgarh, Delhi, Gujarat, Haryana, Himachal Pradesh, Jammu & Kashmir, Jharkhand, Karnataka and Kerala.
20110414
Exactly half of the twenty most populous states, each with a population of ten million or more, have added lesser persons in the decade 2001-2011 compared to the previous one. Had these ten states added the same number of persons during 2001-2011 as they did in the previous decade, everything else remaining the same, India would have added another 9.7 million more persons during this decade. [Text from the introductory note of Paper 1 on the Census.]
The phenomenon of low growth have started to spread beyond the boundaries of the Southern states during 2001-11, where in addition to Andhra Pradesh, Tamil Nadu and Karnataka in the South, Himachal Pradesh and Punjab in the North, West Bengal and Orissa in the East, and Maharashtra in the West have registered a growth rate between eleven to sixteen percent in 2001-2011 over the previous decade.
The Provisional Population Totals of Census 2001 predicted this: “It is also obvious that in the contiguous four major South Indian states fertility decline appears to have well established, stretching to neighbouring Maharashtra on the west and Orissa and West Bengal in the east, whereas in other regions it is rather scattered.”
Among the smaller states and Union Territories, Dadra and Nagar Haveli and Daman and Diu registered very high growth rates of more than fifty three percentage points. In contrast, Lakshadweep, Andaman & Nicobar Islands and Goa have registered single digit decadal growth. Nagaland is the only State which has registered a small negative growth during 2001-2011 after very high growths in all the previous decades.
It took four decades for Kerala to reach a decadal growth of less than ten percent from a high growth rate of 26.29 percent during 1961-71 to 9.43 during 1991-2001. Although Kerala has continued with this impressive show to register a growth rate of just above 4.9 percent during 2001-2011, the decadal growth rates in Bihar, Chhattisgarh, Jharkhand, Rajasthan, Uttar Pradesh and Madhya Pradesh are still above 20 percent, a level where Kerala and Tamil Nadu were forty years ago. However, the International experience is (European Fertility Project) that once the fertility transition had been established in a linguistic or cultural area, it spread rapidly and independently of socio-economic level achieved.
Perhaps the policy measures taken in the decade have prepared the basic ground for a similar situation in India and, one may expect a faster rate of fall in growth rates in the remaining states and Union Territories with increase in literacy and child care facilities and a reduction in poverty. The road to a stationary population before 2060 is long and arduous and would require intense efforts.
20110401
 The long-awaited first set of provisional totals and demographic data have been released. This is a big moment. India’s is after all the biggest population enumeration exercise in the world – yes China’s population is greater, but the evidence of census operations in the twentieth century suggests that India’s census (not number of people) is the most complex and data-intensive in the world. It is also the longest running series – Census 2011 is the fifteenth census from 1872!
In a country like India, with multiethnic, multilingual, multicultural and multilevel society, the Census is much more than a mere head count of the population. It gives a snapshot of not only the demographic but also the economic, social and cultural profile of the country at a particular point of time. More often than not, it is the only available source of primary data at the level of the village and town (ward). It provides valuable information for planning and formulation of policies by the Government and is also used widely by national and international agencies, scholars, and many more.
In addition, the Census provides a basic frame for conduct of other surveys in the country. Any informed decision making that is based on empirical data is dependent on the Census. Democratic processes like the delimitation of electoral constituencies and affirmative action like reservation are also based on the basic data sets of the Census. It has indeed come a long way from what was described as “the idle curiosity of an eccentric sirkar”. So said J Chartres Molony, Superintendent of Census, Madras, 1911: “The Village Officer, source of all Indian information, is the recorder of his village, and it well may be that amid the toils of keeping accounts and collecting mamuls, he pays scant heed to what he and his friends consider the idle curiosity of an eccentric sirkar”.
 The earliest references of Census taking in India can be traced back to the Mauryan period in Kautilaya’s ‘Arthashastra’ (321-296 BC) and later during the Mughal period in the writings of Abul Fazl (1595-96) in the ‘Ain-e-Akbari’. Records have it that in 1687, during the Governorship of Elihu Yale in Madras Presidency, the King of England desired that a count of the inhabitants of Fort St George be taken. This however was not followed up until 1872. A count was also taken up in 1853 in the North Western Frontier, which was followed by a series of Census like enumerations. However these “were not censuses but simple head counts”. Dr. W.R.Cornish, Superintendent of Census Operations, Madras, 1871: “The estimates of population of Madras previous to 1867 had been so various and the direct censuses of 1822 and 1863 were so untrustworthy that it had been found utterly impossible to arrive at any satisfactory conclusion as to the actual number of people…”. Rev C.W.Ranson: “…for the period prior to 1871, we are dependent for our knowledge of the growth of population of Madras upon estimates which at their best represent only informed guesswork and at their worst wildest conjecture”.
A systematic and modern population Census, in its present scientific form was conducted non synchronously between 1865 and 1872 in different parts of the country. This effort culminating in 1872 has been popularly labelled as the first population Census of India (the first synchronous Census in India was however conducted in 1881). Christophe Guilmoto: “1871 is probably the turning point of the statistical history of India owing to the inception of a century long tradition of decennial censuses which in turn triggered a new development in the monitoring of socio demographic phenomena like famines, epidemiology or the natural increase of population.”
 The Indian Census has a long tradition of releasing the population data on a provisional basis within a short time after the completion of the Population Enumeration. The population totals are built up by each Enumerator right from the page totals of a few data items for each page of the Household Schedule, which are then consolidated at the Enumerator’s Block level. The totals at various Administrative levels the Tahsil/Taluk/Community Development Block etc., the Town, the District and the State are consolidated through a process of successive aggregation. The entire exercise of aggregation right from the Enumerator’s Block level to the State level is completed within a short span.
Dr C Chandramouli, the Registrar General and Census Commissioner of India, has cautioned that “the first flush of Census 2011 results, ‘The Provisional Population Totals’, is rather raw and not subjected to the intensive checks and cross checks as the usual final Census data is. Further, the numbers given are somewhat tentative and the final figures are found to be a bit different. Some caution is therefore needed while interpreting the results. The intelligent data user will definitely keep these limitations at the back of his mind but still use the data provided here to pick up some early demographic trends. The ‘Final Population Totals’ will be released after the scanning and the processing of information collected in the Household Schedule are completed.” (Data sheets, tables and explanatory material can be found on the Census of India website.)
The population of India, at the turn of the twentieth century, was only around 238.4 million. This has increased by more than four times in a period of 110 years to reach 1210 million in 2011. Interestingly, the population of India grew by one and half times in the first half of the twentieth century, while in the later half it recorded a phenomenal three-fold increase.
 One of the important features of the present decade is that, 2001-2011 is the first decade (with the exception of 1911-1921) which has actually added lesser population compared to the previous decade. This implies that as a result of the combination of population momentum and somewhat impeded fertility, although India continues to grow in size, its pace of net addition is on the decrease.
In absolute terms, the population of India has increased by about 181 million during the decade 2001-2011. Although, the net addition in population during each decade has increased consistently, the changes in net addition has shown a steady declining trend over the decades starting from 1961. While 27.9 million more people were added between the decade 1981-1991 than between 1971-1981, this number declined to 19.2 million for the decades between 1981-1991 and 1991-2001. The provisional results of 2011 shows that between 2001 and 2011, the net addition is less than that of the previous decade by 0.86 million.
Population Growth Rates – It is significant that the percentage decadal growth during 2001-2011 has registered the sharpest decline since independence. It declined from 23. 87 percent for 1981-1991 to 21.54 percent for the period 1991-2001, a decrease of 2.33 percentage point. For 2001-2011, this decadal growth has become 17.64 percent, a further decrease of 3.90 percentage points.
 The provisional population totals of Census 2011 brings a ray of hope with definite signs that the growth rate of population is tapering off especially in areas where it had been stagnant for several decades. There is also a marked decline in fertility as evidenced by the declining proportion of child population in the age group of 0-6 years. Independent India, urged by the First Census Commissioner R A Gopalaswami, who referred to “improvident maternity” as the primary cause of the population problem became the first country in 1952 to establish a policy for population control. For the world as a whole, demographers are generally confident that by the second half of this century we will be ending one unique era in history – the population explosion – and entering another, in which population will level out or even fall. Population pessimists have warned the congenital optimists, not to believe that humanity will find ways to cope and even improve its lot. Still, Malthus noted: “The exertions that men find it necessary to make, in order to support themselves or families, frequently awaken faculties that might otherwise have lain for ever dormant, and it has been commonly remarked that new and extraordinary situations generally create minds adequate to grapple with the difficulties in which they are involved”.
A feature of both mortality and fertility transitions has been their increasingly faster tempo. Targeted programmes like those on female literacy, improving general health care, improving female employment rates, minimum years of schooling, advocacy through village groups, etc. is slowly redefining motherhood from childbearing to child rearing. Census 2011 is perhaps an indication that the country has reached a point of inflexion. [Dr Chandramouli’s excellent opening essay, from which these extracts have been taken, is dated Chaitra, Ekadashi,Vikram Samvat 2067 (30th March 2011).]
This is the second of my entries on the 2011 Census of India (see the posts ‘One frozen moment in 1911’ and ‘British Bombay’s furious 1911 growth rate’). These will continue to appear as more data and analysis are released. A page will appear soon to contain all the entries, arranged chronologically, and which will link to data sets. The first group of tables I have now posted. These are:
Table_1-Distribution of population, sex ratio, density and decadal growth rate of population
Table_2.3-Literates and literacy rates by sex
Table_2.2-Population aged 7 years and above by sex
Table_2.1-Child population in the age group 0-6 by sex
Table_3-Sex Ratio of Total population and child population in the age group 0-6 and 7+ years-2001 and 2011
