Archive for January 2014
Ten reliable rice years

The AMIS prices panel as we find it in 2014 January. Weekly international rice prices (top) are for Thai rice, which have been on a plateau from 2012 Jan to around 2013 April, after which they declined. Rice futures prices (60-day average) have also been on a very gentle upward slope (middle) since 2012 Jan after pronounced swings to that point from 2010 Jan. Rice price volatility was dampened during the last quarter of 2011 until third quarter 2013 (compared to the previous two years) and has moved slowly lower over three years (bottom). Charts: FAO-AMIS
International grains traders rarely consider the historicity of what they deal with day in and day out. Wheat up today, maize down tomorrow, soy futures worth considering for next month, milk powder positions to be liquidated, and so on. Hold what you can profit from only so long as there is profit to be made, and futures are nothing but bets you’ve studied carefully.
But even for the hard-boiled traders, the last decade of rice has made them turn to look back and consider the curiosities of the market. Inventories of rice, all over the world, have been growing slowly and steadily for close to a decade. Now that trend, which since 2003 has been one of the longest unbroken trends in world agriculture, is ending. The change is being attributed, in the commodity exchanges and grain trading floors, to what is called a ‘downgrade’ of supplies of rice in India by the International Grains Council.
The first such forecast decline in world rice stocks, of about one million tons, means that the IGC is estimating world rice inventories at the close of 2013-14 to be 108 million tons. The curious aspect is that India is expecting a bumper rice harvest for 2013-14, and although IGC says world inventories will drop slightly (the end of the trend), there is also a reduced estimate for world consumption of rice, which is another curiosity.
According to the traders Thailand, the top rice exporter for years, has been stockpiling rice “at prices some 40%-50% above the market” and thereby prompting credit rating agencies like Moody’s to claim that the cost of the Thai programme was “threatening the country’s sovereign debt rating”.
This is plain rubbish. Traders and commodity exchanges do not grow rice to feed their families and sell if there is a small surplus to sell. The finance bots in predatory agencies like Standard and Poor’s, Moody’s and Fitch – considered the three largest by the scale of their work – don’t know the difference between a cauliflower and millet and can grow neither. Thai, Indian and African small farmers could not care less whether credit rating agencies exist and our governments should learn what true sovereignty means from our small farmers.

The FAO and IGC food price indexes and their sub-indices. For FAO the chart shows the FAO Food price Index and the cereals, oils and fats and dairy sub-indices over the last five years. For IGC the lower chart shows the IGC Grains and Oilseeds Index, also over the last five years, with the wheat, maize and rice sub-indices. The IGC rice sub-index has also recorded a plateau from 2012 January onwards with a more pronounced decline setting in from 2013 August. Charts: FAO-AMIS
The odd tale of rice was given a late twist by two cyclones. One is Cyclone Phailin which struck the eastern Indian coast in the first week of October 2013. And he other is Typhoon Haiyan, which struck the Philippines in early November 2013. Vietnam is to supply 500,000 tons of rice to the Philippines, which has sought the supplies to boost state reserves depleted by the relief operations after Typhoon Haiyan.
The FAO’s Rice Market Monitor for 2013 November said: “Although accounting for much of the worsening in the global outlook, Asia is still expected to sustain growth in world rice production in 2013. According to the latest forecasts, the region is to harvest 672.7 million tonnes (448.6 million tonnes, milled), 1.2% more than in 2012. Foremost among countries responsible for the increase are India, Indonesia, Thailand, Myanmar and Bangladesh. By contrast, drought in China’s central and eastern provinces exacted a heavy toll on the intermediate and late rice crops, which may bring about the first production decline in the country since 2003.”
I find the FAO Rice Market Monitor more detailed than what the IGC puts out (although IGC’s public offerings are but a distillation of what subscribers to the information service obtain). The FAO Monitor has also added that given a poor delivery record so far, Thailand appears unlikely to boost its exports beyond the relatively low level of last year. And that expectations have improved for India, which may replicate the 2012 record performance, with Australia, Cambodia, China (Mainland), Egypt, Pakistan, Paraguay and the USA also forecast to export more.
Stop selling your nuclear monster to India, Mr Abe

How green do our becquerels glow. Shinzo Abe and Manmohan Singh in New Delhi, 2014 January. Photo: Press Information Bureau, Government of India
The Japanese salesman has come and gone, leaving behind him not the whiff of cherry blossoms but the stench of radiation. Shinzo Abe the prime minister of Japan, sipped tea with his host and counterpart in India, Manmohan Singh, as they watched the Republic Day parade together. The future of republics (indeed of democratic principles) must have been a distant matter for these two prime ministers, both glowing with a renewed nuclear fervour.
For, although the long history of accidents at nuclear facilities is painfully evident to all those of us who have lived through an era that included Three Mile Island, Chernobyl and Fukushima, Prime Ministers Abe and Singh promised to “make our nuclear power generation increasingly safe” and to “ensure that the safety and livelihoods of people are not jeopardised in our pursuit of nuclear power”. Who is the “our”, we ask. And because neither can answer, Abe’s visit was met with widespread protests.
In his letter, made public, eminent Gandhian Narayan Desai wrote to Abe: “People of India have learnt from the experience of nuclear power over the last six decades. Local communities have overwhelmingly opposed nuclear projects despite persistent government propaganda … Developing closer relations between our two countries is a desirable goal. However, for this to happen on a healthy durable basis, it is necessary that people’s wishes are listened to and their long term interests protected. Selling nuclear components to help facilitate setting up of nuclear power plants is not the way. This is doubly so, when India has not signed the Nuclear Non-proliferation Treaty and is actively engaged in the production of nuclear weapons. The well-being of future generations should not be sacrificed for short term commercial gains.”

In the ‘Jaitapur Times’, a resistance newspaper in Marathi printed in the district where the Jaitapur nuclear power plant is being opposed, a protest banner is reproduced.
More comprehensively, in ‘Resisting Abe’s Sales Pitch’, M V Ramana (Programme on Science and Global Security, Woodrow Wilson School of Public and International Affairs, Princeton University and author of ‘The Power of Promise: Examining Nuclear Energy in India‘ (Penguin 2012)) has said that “Abe’s democratic credentials are evident from his various attempts at peddling reactors despite this overwhelming opposition. One outcome of Abe’s globe-trotting atomic roadshow was an agreement with Turkey’s Recep Tayyip Erdogan, another head of state who doesn’t seem to be particularly concerned about democratic sentiment, to sell two nuclear reactors. The majority of the Turkish public too opposes the construction of nuclear power plants.”
Abe must have warmly appreciated the technique of Prime Minister Manmohan Singh (ably abetted by a ministers’ cabinet intent on gutting the country of its natural resources, witness the triumphant pronouncements by Veerappa Moily, the Minister for the Destruction of the Environment who is also the Minister of Petroleum and Natural Gas) who is skilled at replacing one bland statement with another opaque one and in this case he said, “Our negotiations towards an agreement for cooperation in the peaceful uses of nuclear energy have gained momentum in the last few months”.
But apart from the boring boilerplate statements, Manmohan Singh has presented himself as the South Asian buyer of what the then Japanese Prime Minister Naoto Kan called “a mutually satisfactory agreement for civil nuclear cooperation at an early date”. That the Japanese chair is filled by someone else now is of little consequence, for the position of Japan’s PM is to be an enthusiastic salesman for the country’s biggest businesses – high-speed rail, nuclear power and water-related infrastructure systems. [See the whole gamut of scary capitalist high-technology and anti-democratic partnership-mongering outlined here.]

The front page of the ‘Jaitapur Times’, a resistance newspaper in Marathi printed in the district where the Jaitapur nuclear power plant is being opposed.
The slow-motion nuclear meltdown that is taking place at Fukushima Daichi had prompted Kan to say that Japan should aim to be “a society without nuclear power”. But in India, inconveniently for a Japanese salesman PM and our own salesman PM, there is now significant opposition to nuclear power, especially at all the sites that have been selected for installing reactors imported from companies like Westinghouse, General Electric and Areva.
We have been educated by honest truth from within Japan itself, like the testimony of a Japanese engineer who helped build reactor 4 at the Fukushima No. 1 nuclear plant and who said such plants are inherently unstable, urging Taiwan to ditch atomic energy for renewable resources. Our public opposition knows well that the primary motivation for a nuclear agreement between Japan and India dates back to the US-India nuclear deal. M V Ramana has reminded us that in 2008, William Burns, a senior American diplomat, told the Senate of his country that as its part of the bargain, the Manmohan Singh (UPA) government had “provided the United States with a strong Letter of Intent, stating its intention to purchase reactors with at least 10,000 megawatts (MW) worth of new power generation capacity from U.S. firms [and] has committed to devote at least two sites to U.S. firms”.
These are the deals struck in secret – whose grossly anti-democratic nature Abe and Singh were upholding as they watched soldiers from India’s most decorated regiments march down Rajpath – and here was a salesman who only a few months earlier had midwived a secrecy act that would make unlawful the release of information about the situation at Fukushima. In Japan itself, some of its most famous scientists, including Nobel laureates Toshihide Maskawa and Hideki Shirakawa, have led the opposition against this new state secrecy legislation with 3,000 academics signing a public letter of protest. These scientists and academics declared the government’s secrecy law a threat to “the pacifist principles and fundamental human rights established by the constitution and should be rejected immediately”.
The sites promised to American firms, said Ramana, are Mithi Virdi in Gujarat and Kovvada in Andhra Pradesh. We also know thanks to Wikileaks that in 2007, former Chairman of the Atomic Energy Commission, Anil Kakodkar told a nuclear trade delegation from the US-India Business Council that “the Jaitapur site in southern Maharashtra would go to the French”. Now, the salient point is that all of these reactors need key components produced in Japan and the Japanese government has to formally allow these exports.
Abe’s Republic Day sales trip has come soon after the Tokyo Electric Power Company (TEPCO) acknowledged (was forced to, and did so, shamelessly and for the first time, nearly three years after
the accident started), that water was leaking from the reactor containment vessel in Unit 3 of the Fukushima Daiichi Nuclear Plant. According to Tatsujiro Suzuki the vice chairman of the Japan Atomic Energy Commission (JAEC), “the leakage is a significant finding [and] could indicate that the Unit 3 containment vessel has significant damage”. Barely a fortnight ago, Japan’s Asahi Shimbun reported that TEPCO has withheld 140 measurements of radioactive strontium levels taken in groundwater and the port of the Fukushima No. 1 nuclear plant between June and November last year. But Prime Merchant Manmohan Singh and his colleagues are intent on completing the US-Japan-India trimurti while the ordinary folk of India are demanding anumukti.
A 65th Republic Day tally for India

Decorated regiments march down the Rajpath in New Delhi, as they have done for as long as I can remember, to celebrate the day the Constitution came into force. Far too few have read, or do read, that grounding document of India and fewer still abide by the principles it contains. Photo: Press Information Bureau, Government of India, Ministry of Defence
More than 100 registered and over 1,500 unrecognised political parties, with an electorate of about 750 million and about 3.2 million elected representatives, the biggest democracy in the world.
The number of millionaires in Indian legislatures has been increasing rapidly. In the 15th Lok Sabha
about 58% of the members are millionaires, but over three-fourths of our population is poor and vulnerable. The average women representation in the Lok Sabha – from 1952 until now – is 6@ and in the Rajya Sabha it is 9%.
The outlay in the Union Budget for social sectors rose from 1.2% of GDP in 2004–05 to 2% of GDP in 2008–09. This proportion has stayed the same until 2011–12 when it declined. India ranked 136 among 187 countries evaluated for the human development index (HDI).
In South Asia, the poorer economy of Bangladesh has overtaken India on many social indicators (including life expectancy, immunisation of children, infant mortality, child undernourishment and girls’ schooling). Even Nepal has been catching up – many of its social indicators are similar to those recorded in India despite a per capita GDP that only a third that of its neighbour.
Workers in their districts
What has changed in the numbers of Maharashtra’s workers over ten years, over the period marked by the recordings of two censuses, 2001 and 2011?
This experimental chart shows us the flow and accumulation in Maharashtra of what the Census calls ‘total workers’, and by this the Census enumerators mean those who said they have employment (or have worked for themselves) for more than six months, and those who have had work (or wages) for less than six months. These two divisions are called ‘main’ and ‘marginal’.
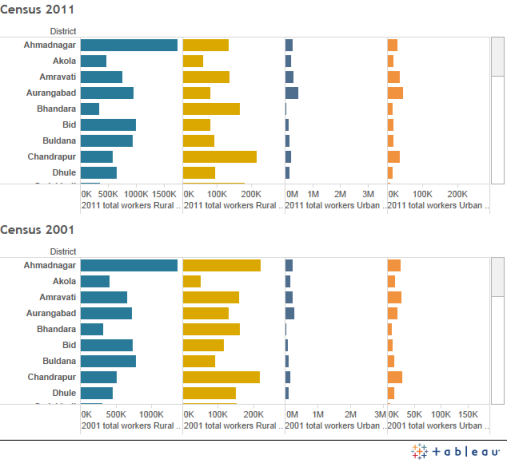
Click for an interactive chart
The difference between these two descriptors of working status may be more grey than black-and-white, for the Census records how much time is spent working and not how much is earned (and saved and spent) as payment for that time spent. Hence, a ‘main’ worker who has been employed for 7 to 8 months of the year may have earned through wages, salaries or commissions just as much as a ‘marginal’ worker did by working for 5 months.
This is only to show that ‘workers’ as counted by a Census can be interpreted in a variety of ways, and for those wanting to get a fuller and richer view of the matter, it is best to read the Census data as a layer above or below one or two other sources of data, such as the NSSO and the results of a field study for example in a district.
What then do the districts of Maharashtra tell us? First, that the number of workers increased between 2001 and 2011 in most but not all districts, and that those districts with the largest increases in numbers were Thane (1.312 million more, 41.28% more), Pune (1.094 million more, 37.05% more), Mumbai Suburban (0.582 million more, 18.48% more), Nashik (0.577 million more, 26.43% more), and Aurangabad (0.398 million more, 33.84% more). There are also Beed with 31.12% more workers and Jalna with 29.85% more workers.
Next, that Mumbai and Mumbai Suburban, together with Thane and Pune, have 13.56 million total workers which is 27% of all Maharashtra’s workers! That is a concentration of numbers, but it tells us nothing about the conditions they work in, whether they are paid adequately to support a family and household (the major unions have been asking for a national minimum floor wage of Rs 10,000 for two years now) and whether these earners receive as is their right workers’ benefits. That is why we try as much as is possible to read the invaluable account of India and its districts and villages as described by the Census together with other sources and studies.
Still too few jobs, still paltry wages, says ILO
 Although the Global Employment Trends 2014 report has adopted a mild turn of phrase to describe the vicious and sustained attack on workers and labour around the world, the message from one of the key reports from the International Labour Organisation is that economic ‘recovery’ has done nothing to create jobs, in fact the reverse.
The report has called for “an urgent switch to more employment-friendly policies” – that is, in contrast to the policies that encourage criminalising workers who organise themselves, and policies that drive – in a race to the deadly bottom – wages ever lower in the face of rampaging inflation. The weak global economic recovery has “failed to lead to an improvement in global labour markets”, the ILO report has said, with global unemployment in 2013 reaching almost 202 million.
While this is a very large number, we should remember that the ILO, a United Nations agency, relies on official statistics given it by the countries themselves. Even with allowances made for the true nature and scale of unemployment and under-employment, recommended to the ILO by trade unionists and researchers who study labour trends and conditions, the numbers available in the report will be a fairly large under-estimate of actual conditions.
 Nonetheless, the Global Employment Trends 2014 report said that employment growth remains weak, unemployment continues to rise as a trend in all the world’s geographic regions, and especially amongst young people, and that large numbers of discouraged potential workers are still outside the labour market. The report has also bluntly said that “profits are being made in many sectors, but those are mainly going into asset markets and not the real economy, damaging long-term employment prospects”.
In developing countries, informal employment remains widespread, and the pace of improvements in job quality is slowing down, the report said. That means fewer people are moving out of ‘working poverty’ – that is, those who have some work but that work is not enough to keep their households consistently above a given income and food calories poverty line. In 2013, the number of workers in extreme poverty – living on less than the (widely-criticised and altogether meaningless World Bank) US$ 1.25 a day – declined by only 2.7% globally, which is one of the lowest rates over the past decade, with the exception of the immediate crisis years.
Periods of unemployment for job seekers and those laid off have lengthened considerably, the report said; in some countries such as Spain and Greece, job seekers need twice as much time before landing a new job than before the crisis (with no assurance that the pay they will receive for the new job matching their last drawn salaries or wages). More and more of those potential workers are discouraged and remain outside the labour force, “leading to skills degradation and obsolescence, and rising long-term unemployment”.
Expanding India’s WPI, neglecting its CPI

There are some 130 food items in the proposed WPI whereas the retail price collection basket with the most items has only 46.
The Planning Commission is to agree by the end of 2014 March on the composition of an expanded set of items for the wholesale price index. The expanded index – with a few new categories and some reclassifications – is a proposal, formally, by the Office of the Economic Adviser, Ministry of Commerce and Industry.
But there are retail wheels within wholesale ones, and there are indications provided by the financial and business press that it is the Prime Minister’s Office that is backing the revision – which will also allow the Reserve Bank of India to make decisions about interest rates that could benefit industry.
My interest was drawn to the several additions that have been made to the category of ‘food articles’ (some of which has been covered by media reportage, which quite typically has ignored the changes proposed in the rest of the categories). More important than these few changes to the components of wholesale food price are the additions made under the ‘manufactured products – food products’ category.
This is a greater expansion of items (although the weightages for the new items have not yet been made public) and reflects the shift in what is being purchased by households – more packaged and processed food in place of raw cereals, pulses, fruit and vegetables. The expanded list also signals the dietary shift – a nutritional time-bomb whose effects can already be seen in the rising rates of youth becoming overweight – towards processed cereals, sugary drinks, edible oils, and snack foods.
The tall and narrow chart you see here shows the difference between the sets of items covered by the proposed new WPI and the current sets of items that are monitored for consumer retail prices. The three sets that do this are from: (1) the Ministry of Agriculture, Directorate of Economics and Statistics, (2) Ministry of Labour and Employment, Labour Bureau, and (3) Ministry of Consumer Affairs, Food and Public Distribution, Department of Consumer Affairs.
This is the second expansion in the number of items that make up the WPI in the last three years, whereas the relatively much smaller list of items that are used to monitor the prices of food for consumers has remained the same over the same period (the last revision was about five years ago in the Ministry of CAF&PD system).
As usual, there is little or no public discussion on the additions to the WPI and the continuing neglect of the items that are used to compute the consumer price index – some of those collection systems are 30 years old. The proposed expansion of the WPI food and food-related items will deepen the already very serious lack of correspondence between the WPI and CPI.
More troubling is the deepening meaninglessness of the CPI numbers – rural and urban for major states doesn’t help one bit if the list of items is not expanded to reflect more accurately what households actually buy, rather than ignore the growing list of items they do. Continuing to ignore this long overdue need for correction will short-change India’s salaried workers and wage earners, and very seriously under-report true inflation especially for food.
World heritage and the agrarian trilogy
 Agricultural landscapes have been honoured in the quarterly journal published by Unesco, ‘World Heritage’, which has dwelt (issue number 69) on the agro-pastoral landscapes created by human activity and serves to explain the major sites of this type now inscribed on the World Heritage List. The number has said: “The most impressive of these sites are perhaps the terraced fields found around the world, in the Far East, Africa, the Andes and all around the Mediterranean basin, with rice paddies and various wine-growing areas, some of which are also listed as World Heritage cultural landscapes.”

Stari Grad plain – ancient Greek farming in the Adriatic. The farming land is divided into regular sized parcels known as chora (Greek for landscape or countryside), bounded by drystone walls. All this, together with the cisterns and the little beehive-shaped toolsheds was first measured and marked out some 2,400 years ago and they have remained unaltered in their layout and in continuous use since the ancient Greeks created them. Photo: UNESCO World Heritage / Mark Gillespie
The introductory note has said that human civilisation, throughout its history, “has applied certain principles of adaptation to the environment that are sufficiently resilient to drive nature’s inherent and inexhaustible dynamism by adding a cultural dimension that endows it with uniqueness”. Culture and cultivation has become a reality in the agricultural landscapes, for their age and their continuous evolutionary aspect.
In these sites, the territories are structured by agro-pastoral practices known as the ‘agrarian trilogy’: the cultivation of fields – agriculture (from the Latin ager, fields); the cultivation of forests – silviculture (silva, forest); and husbandry – with the use of so-called uncultivated lands
such as sustenance pastures together with their pastoral routes, all of which, taken together, was termed saltus in Roman times.
The journal has found that most impressive of all these landscapes are those devoted to a single operation, “because the structure they impose upon the territory in terms of a single variable results in large expanses of land that are spectacularly homogenous”. This is seen in the various rice fields, in the impressive landscapes of Tequila (Mexico) where the blue agave is cultivated, and uniquely apparent in such vineyard landscapes as the Upper Middle Rhine Valley (Germany), Wachau (Austria), Saint Emilion (France), Tokaj (Hungary), Pico Island and Alto Douro (Portugal), and Lavaux (Switzerland).
The journal number also includes an interview with Parviz Koohafkan, the coordinator of the Globally Important Agricultural Heritage Systems (GIAHS) of the Food and Agriculture Organisation (FAO). In response to a question about the global evolution of this heritage category and recognition of the intrinsic interaction between people and nature, Koohafkhan replied that this category of World Heritage is gaining ground because of the importance of the landscape approach and the nature-culture relationship.

The area of the Konso, in Ethiopia, is characterised by extensive drystone agricultural terraces contouring the hills and giving the landscape its unique characteristics. After harvesting in September, the parallel lines of the terraces and their engineering and artistic workmanship can best be appreciated. Photo: UNESCO World Heritage / Vicki Brown (Solimar International)
“In addition, landscapes are evolving rapidly due to agricultural transformation and unless we plan and work with communities for the sustainability of their livelihoods, we will be unable to conserve this agriculture and landscape heritage. FAO, UNESCO and their partner organisations should set up further collaborative programmes to address issues of food and nutrition security within the context of the post-Rio sustainable development agenda and to recognise the important role of small-scale family farms and indigenous communities in providing multiple goods and services,” Koohafkhan has said.
The immense diversity of agricultural systems can be seen in the vegetable, animal and even mineral produce that they include, is a valuable point made in a short article from the International Scientific Committee on Cultural Landscapes (IFLA-ICOMOS). Discussing agricultural landscapes in a heritage context, the ingredients of the trilogy are well supplied: basic foods provided by cereals (wheat, rice, maize, etc.) or tubers (potatoes, manioc, taro, etc.), each of which forms the foundation of a major area of civilisation that subsequently spread around the world.
Then there are fruit-bearing plants (vines, olive and apple trees, citrus fruit, date and banana trees, etc.), the juice of which could be fermented (wine, cider, etc.); oleaginous plants (olives, sunflower, soya, colza, oil palms, coconut and argan trees, etc.), sugar-bearing plants (cane and beet); stimulant plants (coffee, tea, cocoa and tobacco, etc.), which produce alkaloids and undergo elaborate transformation (drying of leaves, roasting of grains, etc.); textile plants (flax, hemp, cotton, jute, etc.); ruminants, which provide milk, meat, wool and leather but are also used as beasts of burden in numerous agro-pastoral systems; equidae, camelids, pigs, poultry and so on.
The meat map of the world
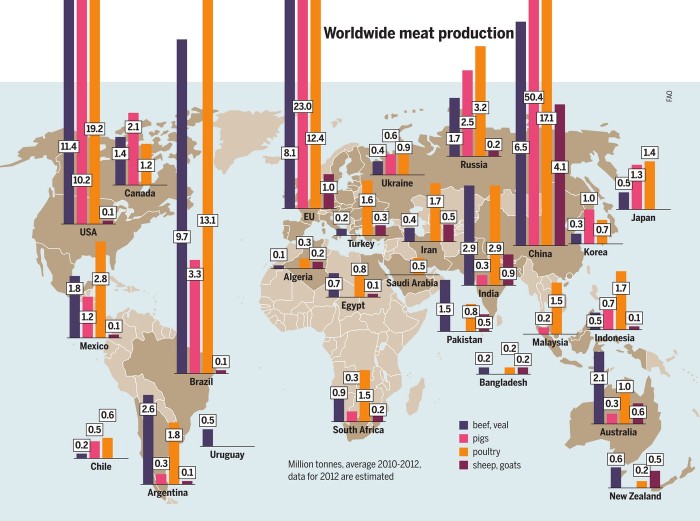
The economies in Asia and elsewhere will see around 80 percent of the growth in the meat sector by 2022. The biggest growth will be in China and India because of huge demand from their new middle classes. Chart: Meat Atlas
Industrial livestock production in Europe and the USA began when feed, energy and land were inexpensive, the ‘Meat Atlas’ has explained, which is published jointly by the Heinrich Böll Foundation and Friends of the Earth Europe.
Nowadays, feed, energy and land have all become scarce and costs have gone up. As a result, total meat production is growing less quickly than before. “The market is growing only for pigs and poultry. Both species utilise feed well and can be kept in a confined space. This means that they can be used to supply the insatiable demand for cheap meat,” the Meat Atlas has said.
By 2022, almost half the additional meat consumed will come from poultry. Beef production, on the other hand, is scarcely growing. The USA remains the world’s largest beef producer, but the meat industry describes the situation there as dramatic. For 2013, it expects a fall of 4-6 per cent compared to 2012 and predicts the decline to continue in 2014. In other traditional producing regions including Brazil, Canada and Europe, production is stagnating or falling.
 “The star of the day is India, thanks to its buffalo meat production, which nearly doubled between 2010 and 2013. India is forcing its way onto the world market, where 25 percent of the beef is in fact now buffalo meat from the subcontinent,” said the Atlas (see this news report from 2013 June).
According to the US Department of Agriculture, India became the world’s biggest exporter of beef in 2012 – going ahead of Brazil. Buffaloes are considered inexpensive to keep by the USDA (what benchmark do they use for husbandry I wonder). Thus the USDA considers buffalo meat a dollar a kilo cheaper than beef from Western cattle. In addition, the Meat Atlas has reminded us, the Indian government has invested heavily in abattoirs. Moreover, faced with the high price of feed, Brazilian cattle-raisers are switching to growing soybeans which has presented an opportunity for Indian buffalo-meat exporters.
China and India differ markedly in their food consumption patterns. In India, a vegetarian lifestyle has deep cultural and social roots. In surveys cited by the Atlas, a quarter or more of all Indians say they are vegetarian. “But the number of meat-eaters is growing. Since the economic boom (my note: usual dreadful mis-labelling here; it is no ‘boom’ but a slow destruction) in the early 1990s, a broad middle class that aspires to a Western lifestyle has emerged (true enough). This includes eating meat which has become a status symbol among parts of the population. Nevertheless, meat consumption in India is still small – per person it is less than one-tenth of the amount consumed in China.”
 The costs borne by the environment because of the world’s fondness for animal-origin protein are probably the biggest, but are still difficult to calculate despite some 30 years of following advances in environmental economics. This helps us estimate some damage to nature in monetary terms. It covers the costs of factory farming that do not appear on industry balance sheets, such as money saved by keeping the animals in appalling conditions. The burden upon nature also grows by over-fertilisation caused by spreading manure and slurry on the land and applying fertilisers to grow fodder maize and other crops.
How the geography of world obesity has shifted

(1) Obesity is on the rise globally: One in three adults in the world (1.46 billion) were overweight or obese in 2008, up by 23% since 1980. (2) Where overweight or obese people live is changing: North Africa and the Middle East, and Latin America now have almost the same percentage of overweight or obese people as Europe. Graphics: ODI
For the last few years, food scarcity and the effects of industrial food have co-existed, often within the same demographic circle and within countries. This is no contradiction (although it demands far more attentive food policy) because the in the world’s industrialised agriculture and processed food system, both must exist in order that profits are made, in order that ‘economic growth’ is fulfilled.
Now, the BBC has reported that the number of overweight and obese adults in the ‘developing world’ (an unnecessary hangover that label, which media organisations must outlaw) has almost quadrupled to around one billion since 1980. The BBC report is based on a study by Britain’s Overseas Development Institute, which has said that one in three people worldwide was now overweight – the study uses these findings to urge governments to do more to influence diets.

(1) Obesity is growing in the developing world: In the developing world, the number of overweight or obese adults more than tripled from 250 million in 1980 to 904 million. (2) Where overweight or obese people live is changing: More adults were overweight or obese in developing countries than in rich countries in 2008. Graphics: ODI
There has indeed been a dramatic increase in the numbers of overweight or obese people in the past 30 years, as anyone who has passed through public places is likely to have observed. Previously considered a problem in richer countries, the biggest rises are in what those familiar with ‘development economics’ (another term that means effectively nothing) call ‘middle income countries’ and the ‘developing world’.
The ODI study, called ‘Future Diets’, has traced how the changes in diet – more fat, more meat, more sugar and bigger portions (what the Americans loving call ‘supersize’) – have led to a health crisis. It also looks at how policy-makers have tried to curb these excesses, usually with little success.
[Use this calculator to check where you are on what the BBC calls ‘the global fat scale’]
The official line on the causes of obesity includes higher incomes. The rationale is that those households which earn more are now able to choose the kind of foods they want, and that they choose poorly. Changes in lifestyle are mentioned, as is the increasing availability of processed foods, the dreadful impact of advertising in and on every space discernible by our senses, and the co-option of media by the food industry (along with most other consumerist industries that require propaganda to ensure quarterly profit and expectations are met and that shareholder value is protected).

(1) Sugar and sweetener consumption is rising: An indicator of changing diets is the increasing consumption of sugar and sweeteners, which has risen by over 20% per person between 1961 and 2009. (2) Change is possible: South Koreans ate 300% more fruit and 10% more vegetables in 2009 compared to 1980 thanks to concerted government-led campaigns. Graphics: ODI
But this is the very alarming result. In what are also called ’emerging economies’, where a large middle class of people with rising incomes lives in urban centres and takes less physical exercise than their parents and grandparents did, there is “an explosion in overweight and obesity in the past 30 years” which of course will lead to serious implications for public health.
The consumption of fat, salt and sugar has increased globally according to the United Nations, and these increases are significant factors in the increase seen in cardiovascular disease, diabetes and some cancers. The study has recommended more concerted public health measures from governments, similar to those taken to limit smoking in developed countries, but of course, to really bring about a change in the way new entrants into the urban middle classes eat, there must be the admission that economic ‘growth’ should first stop, then reverse. How likely is that in the next generation?
Nammalvar, a pioneer of organic India
G Nammalvar, one of the most extraordinary and outstanding pioneers of the organic farming movement in India, passed away on 2013 December 30 near Pudukottai in Tamil Nadu.

Dr G Nammalvar
Dr Nammalvar was a founder member of the Organic Farming Association and later became its Advisor. He regularly attended meetings and conventions of the Association and large numbers of farmers always looked forward to learning the techniques of organic farming from him.
Claude Alvares, the Goa-based environmentalist and advocate of reform in the ideology of education, and who manages the Goa Foundation and the Other India Press, has said that Nammalvar “was a long-standing friend. We shared many meetings together. He was responsible for much of Tamil Nadu gradually shifting from chemicals to organic over the past 20 years”.
“He was not in the best of health in the past couple of years. He had two choices: either retire and look after his health which most people above the age of 60 are advised to do by their doctors; or carry on relentlessly with his task of promoting organic farming, fighting Monsanto and GM crops, and advising thousands of organic farmers on how they could improve their organic farming practice. We all know he chose the latter. He was happier that way.”
 “Now we will find it difficult to find another person like him, to do the things he did. Even an army of his followers may not be adequate. So at this period in the history of the organic farming movement in India, we too have two options. Either we simply mourn the passing of a truly inspiring leader who lived only to promote sustainable, ecological agriculture, and leave it at that. Or we renew fulsomely our commitment to ecological agriculture, listening all the while to what Nammalvar wrote and spoke about it. There is little doubt about which option would make Nammalvar happiest.”
In the Organic Farming Sourcebook (Other India Press, 2009 revised and updated edition), Alvares had interviewed Nammalvar (you can read the full interview in this extract [pdf 835 KB]). Asked by Alvares, “what is the motivator for farmers to switch to organic farming?” Nammalvar had replied:
“There are three main reasons. One is, farmers have realised that land and the natural environment cannot be sustained through chemical farming. All food is poisoned through modern farming. Second, the farmer finds that the cost and quantum of inputs are increasing day by day and so the farmer cannot pay back the loan. The result is that the small and marginal farmers are losing their lands, becoming landless or they are allowing the land to go fallow and migrating to the river belts for seasonal operations and other states and countries doing menial jobs for survival.”
“Third, the export market is facing a problem because the importers of food materials from USA and other European countries find that our foods contain too much of pesticides and insist that these have to be removed and that food has to be organic. So the pressure for changing over is coming from the export market also. Finally, techniques have so improved that a farmer can switch over to organic farming without losing too much income. But most of all, the farmers are interested in organic farming because chemical farming has become uneconomical, grain yield has started declining. These are the prime reasons.”
Amongst many other questions, Alvares had also asked Nammalvar about other obstacles for farmers to convert to organic farming, and the reply was:
“On economic plane many farmers think more of money and not of their home needs and families. On cultural plane they are also tied up with family pressures. Also the women are not involved in this. Secondly, the companies which manufacture and distribute chemicals, hybrid seeds and machineries and so called scientists in the universities deter the farmers from switching over to organic farming. The universities act against organic farming by teaching about and encouraging modern hybrid varieties, genetically manipulated seeds and precision farming. That is a major problem. However the farmers’ movements are giving support co the organic farming movement.”
