Archive for the ‘water’ Category
The greatness of water

“Venerated from a time before antiquity as life-giver, water has been held in the highest esteem in all cultures and eras. Water-related mythologies show as much the divine character associated with it, as its qualities that lie beyond the material. In our time, the intangible cultural heritage (ICH) and traditional knowledge that surround water still give us an entryway to a fuller understanding of the great life-giver.”
This is the introduction to my paper which has been published as a chapter in the book titled ‘Water: Interconnectivity between the Intangible Cultural Heritage and Science’, which is a joint publication by two centres, the International Information and Networking Centre for Intangible Cultural Heritage in the Asia-Pacific Region (ICHCAP) and the International Centre for Water Security and Sustainable Management (i-WSSM), both being UNESCO centres in the Asia-Pacific region and based in South Korea. The book is also part of the ‘Living Heritage Series’ published by ICHCAP.
My association with the ICHCAP centre goes back several years. As per the centre’s description of the book, it is meant to “promote the convergence of science and intangible cultural heritage (ICH) fields; to spread the value of the intangible cultural heritage of water. Nine stories on water management and water and culture were gathered in one place. It contains stories about water-related ICH elements, such as water management as the transmission of traditional knowledge and agriculture as water-related culture. Through this book, readers will be able to explore the value of water, which is an essential factor for humankind, from a cultural perspective.”
More from ‘With Okeanos and Ganga, the greatness of water’:

“But Ganga herself—for the great majority of the rivers in the Indian subcontinent are indeed feminine, a clear sign of the universal acknowledgment to be found among the very oldest cultures of the world that life-giving and life-sustaining waters are embodiments of the feminine force—has a mythic history.”
“Dispatched to the realms of man because of her transgressions in the heavenly realm, her descent to Earth would have been ruinous, an apocalypse, had she not been caught in the matted locks of the great god Shiva, the original yogi, who in so doing prevented all on Earth from being washed away by the force and volume of her waters. When set free, Ganga followed the course she currently occupies; in the mythic account it is said thereafter she descended further into the realm below that occupied by humans, and in this way Ganga watered all three worlds.”
“These accounts are very rich in allegorical symbolism, and it is the codes that have been included in the mythic retellings of the tale that signal the metaphysical consideration of the water element. These are the codes that—like so many concerning the stories of creation that abound in old cultures and within the unimaginably ancient seam of oral accounts told and retold by indigenous peoples—point to the true characteristics of what we have become used to calling the “elements,” such as water.”
“Similarly, in the ancient Greek cosmogony the Okeanos River was a great freshwater stream that encircled the flat disk of the Earth. It was considered in this cosmogony to be the source of all of the Earth’s fresh water, from the rivers and springs that drew their waters from it through subterranean aquifers, to the clouds that dipped below the horizon to collect their moisture from its stream. Okeanos also marked the outer boundary of the flat earth that it surrounded with a nine-fold stream. The Sun, Moon, and stars all rose from and set into its waters. At night the Sun god would sail around its northern reach in a golden boat to reach his rising place in the east from his setting point in the west. In a cosmological sense, the river symbolized the eternal flow of time.”
The paper can be read or downloaded from my section on Academia or on ResearchGate. The full publication can be found here.
Misreading monsoon

As usual in May, there is a welter of forecasts and opinions about the monsoon, the great majority of which are short on understanding and shorter on elementary science. The media – newspapers, television news channels, their websites – are to blame for spreading half-baked forecasts and wild prognoses. Not one of the numerous newspapers and TV channels, whatever the language they employ, bother to provide their reporters a basic grounding in the climatological system that gives us our monsoon.
In the first place, the India Meteorological Department (IMD) issues an operational forecast for the south-west monsoon season (June to September) rainfall for the country as a whole in two stages. The first stage forecast is issued in April and the second stage forecast is issued in June. These forecasts are prepared using state-of-the-art Statistical Ensemble Forecasting system (SEFS) and using the dynamical coupled Ocean-Atmosphere global Climate Forecasting System (CFS) model developed under Monsoon Mission of the Ministry of Earth Sciences.
On 15 April 2019 the IMD issued its first stage forecast. Based on our own in-field observations from the west coast, from the patterns of maximum termperature bands and variations in the lower and central peninsular region, from the sea surface temperatures in the Arabian Sea particular its southerly reaches and ditto for the Bay of Bengal, and from the wind patterns that can be experienced at various places in the peninsula and on the west coast, we find the IMD first stage forecast to be reliable.

It is the chronically ignorant media – which over the last few years has displayed a tendency to prefer some so-called private sector weather forecasters instead of what the Ministry of Earth Sciences provides – found irresponsibly claiming that the monsoon of 2019 will be ‘deficient’ and will also begin ‘late’. Neither of these terms is sensible in any way, and we take no satisfaction in noting that only a media that is insensible to planetary and mesoscale events like climate, will employ such insensible terms in reporting that is meant to educate and benefit the public.
IMD’s April forecast used the following five predictors: 1. the Sea Surface Temperature (SST) Gradient between North Atlantic and North Pacific (in December and January), 2. the Equatorial South Indian Ocean SST (in February), 3. the East Asia Mean Sea Level Pressure (in February and March), 4. North-west Europe Land Surface Air Temperature (in January), and 5. Equatorial Pacific Warm Water Volume (in February and March).
There are two forecasts the IMD makes. One is based on the Monsoon Mission CFS Model, which considers global atmospheric and oceanic initial conditions up to March 2019 and use 47 ensemble members (or kinds of data). The forecast based on the CFS model suggests that the monsoon rainfall during the 2019 monsoon season (June to September) averaged over the country as a whole is likely to be 94% ± 5% of the Long Period Average (LPA).
The second is the forecast based on the operational Statistical Ensemble Forecasting system (SEFS). This shows that quantitatively, the monsoon seasonal rainfall is likely to be 96% of the Long Period Average (LPA) with a model error of ± 5%. The SEFS comprises five category probability forecasts for the June to September rainfall over the country as a whole:

Overall therefore the IMD forecast is for the 2019 monsoon rainfall to be near normal. The IMD has already pointed out (which can be seen from the probabilities of the categories given in the table) that there is only a small chance for the monsoon rainfall to be above normal or excess. In view of the weather events and the climatological changes that we are seeing from day to day in May, ascribing a ‘lateness’ to the monsoon is absurd. Monsoon conditions already exist in and over the Indian land mass and in and over the great watery zones extending southwards from latitude 8 degrees North – and that is why we will find rain-bearing clouds crossing the south-western coastline in the first week of June 2019.
The weekly intelligencer

Indices, prices, data series, readings and jottings of note over the last week, fortnight and month, compiled for the week beginning 6 August 2017.
Quick Estimates of Index of Industrial Production (IIP) with base 2011-12 for the month of May 2017, released by the Ministry of Statistics and Programme Implementation, Central Statistics Office. The General Index for the month of May 2017 stands at 124.3, which is 1.7% higher as compared to the level in the month of May 2016.
India Meteorological Department, Hydromet Division. Until 2 August 2017, 67% of the districts have recorded cumulative rainfall of normal, excess or large excess and 33% of the districts have recorded cumulative rainfall of deficient or large deficient. This compares with 69% and 31% respectively at the same time last year.
Ministry Of Commerce and Industry, Office Of The Economic Adviser. The official Wholesale Price Index for All Commodities (Base: 2011-12=100) for the month of June 2017 declined by 0.1% to 112.7 (provisional) from 112.8 (provisional) for the previous month.
Ministry of Water Resources, Central Water Commission. As on 3 August 2017 the total live storage capacity of the 91 major reservoirs is 157.799 billion cubic metres (BCM) which is about 62% of the total estimated live storage capacity of 253.388 BCM. As per reservoir storage bulletin dated 03 August 2017, live storage available in these reservoirs is 67.683 BCM, which is 43% of total water storage capacity of these reservoirs. Last year the live storage in these reservoirs for the corresponding period was 65.109 BCM and the average of last 10 years was 69.510 BCM.
Reserve Bank Of India Bulletin, Weekly Statistical Supplement. 4 August 2017. Aggregate deposits Rs 106,254 billion. Bank credit Rs 76.888 billion. Money stock: Rs 14,689 billion currency with the public, Rs 101,600 billion time deposits with banks.
Ministry of Agriculture. The total sown area as on 4 August 2017 stands at 878.23 lakh hectare as compared to 855.85 lakh hectare at this time last year. Rice has been sown/transplanted in 280.03 lakh hectare, pulses in 121.28 lakh hectare, coarse cereals in 156.95 lakh hectare, oilseeds in 148.88 lakh hectare, sugarcane in 49.71 lakh hectare and cotton in 114.34 lakh hectare.
Ministry of Consumer Affairs, Food and Public Distribution, Price Monitoring Cell in the Department of Consumer Affairs. Maximum prices recorded (per kilo and per litre) amongst the set of 100 cities monitored during the week of 23-29 July: Rice 52, Wheat 45, Atta (Wheat) 50, Gram Dal 132, Tur/ Arhar Dal 132, Urad Dal 150, Moong Dal 140, Masoor Dal 110, Sugar 52, Milk 65, Groundnut Oil 180, Mustard Oil 170, Vanaspati 120, Soya Oil 110, Sunflower Oil 130, Palm Oil 110, Gur 68, Tea Loose 360, Salt Pack (Iodised) 22, Potato 35, Onion 45, Tomato 100.
The drying of the Deccan

This panel of 12 images shows the change that takes place in a region of the Deccan. Each image shows what is called a Normalised Difference Vegetation Index (NDVI) for the region. This is a rolling eight-day series computed daily using imagery from the Terra/MODIS system and viewed using the NASA Worldview website.
The colours (green and brown shades, whitish shades) show us the vegetation health with deep green being better than light green, dark brown being better than light brown. The index is also used to signal where areas are beginning to experience arid and water-scarce conditions.
 The region is the west-central Deccan – the Karnataka Plateau – corresponds to the Vijayapur (Bijapur) district of north Karnataka with parts of Bagalkot district and is part of the central Indian semi-arid bioclimatic zone.
The pictures in the panel show the vegetation extent and health (NDVI) calculated on that day for an eight-day period. Each picture is a fortnight apart, and this series starts on 4 November 2016 (bottom right) and ends on 7 April 2017 (top left). The retreat of the green is seen clearly from one fortnight to the next.
Of interest in this region is the Almatti dam and reservoir, in the Krishna river basin, which is visible in the lower centre of each picture. On 13 April there was no water in Almatti, which has a full capacity of 3.105 billion cubic metres (bcm). For the week ending 30 March it had 0.015 bcm of water, the week ending 6 April 0.001 bcm.
 For the week ending 3 November 2016, which is when the panel of pictures begins, Almatti had 2.588 bcm of water. The reservoir water runs a hydroelectric power plant, of 240 MW, and which needs flowing water to turn the turbines.
When the reservoir is full, the hydel plant produces about 175 million units of electricity. But on 13 March the Central Electricity Authority’s daily report showed that Almatti could produce only 3.02 million units. On 10 April, this had plunged to 0.04 million units, but the hydel plant had produced no power since 1 April.
Why our kisans must make sustainable crop choices
The 2015-16 fourth advance estimates for commercial crops, when compared with the annual averages for five year and ten year periods, visibly displays the need for more rational crop choices to be made at the level of district (and below), in agro-ecological regions and river sub-basins.
 For this rapid overview of the output of commercial crops for 2015-16 I have compared the Fourth Advance Estimates of agricultural production, which have just been released by the Ministry of Agriculture, with two other kinds of production figures. One is the five-year average until 2014-15 and the second is the ten-year average until 2014-15.
While a yearwise comparison is often used to show the variation in produced crops (which are affected by price changes, policies, adequacy of the monsoon and climatic conditions), it is important to compare a current year’s nearly final crop production estimate with longer term averages. Doing so allows us to smooth the effects of variations in individual years and so gauge the performance in the current year against a wider recent historical pattern. (See ‘How our kisans bested drought to give 252.2 mt’.)
The output of the nine oilseeds taken together is less than both the five-year and ten-year averages. Significant drops are seen in the production of soyabean, groundnut and mustard and rape – these three account for 88% of the quantity of the nine oilseeds (castorseed, sesamum, nigerseed, linseed, safflower and sunflower are the others). Between the fibre crops – cotton, and jute and mesta – the output of cotton is considerably under the five-year average, while that of jute and mesta is under both the five and ten year averages.
It is in the figures for sugarcane that the message lies. The 2015-16 output of sugarcane is marginally above the five-year average and handily above the ten-year average. This needs to be considered against the background of two drought years (2014 and 2015) and the drought-like conditions that were experienced in many parts of the country during March to May 2016.
As these are near-final estimates, this only means that the allocation of water for such a large crop quantity – 352 million tons of sugarcane is about 100 mt more than the foodgrains output of 252 mt – was assured even during times of severe shortage of water.
This is a comparison that needs urgent and serious study, not with a view to change overall policy but to decentralise how crop – and therefore inputs and water – choices are determined locally so that self-sufficiency in food staples and the sustainability of cash crops can be achieved. These are quantities only and do not tell us the burdens of inputs (chemical fertiliser, hazardous pesticides, malignant credit terms) or the risks (as cotton cultivators have experienced this year) but where these are known from past experience their effects can well be gauged.
What works, and doesn’t, in Maharashtra’s districts
In an exercise to help determine how reports of the MGNREGA (Mahatma Gandhi National Rural Employment Guarantee Act or Nrega) can inform us, I have used the records of what the programme calls ‘outcomes’ in the form of ‘physical assets’ created for the community (or conditional use by groups of individuals, depending on the kind of asset) over a financial year.
 The year is 2015-16 and the districts are those of Maharashtra (34, Mumbai excluded). There are at present 17 categories of physical assets and these are: rural connectivity, flood control and protection, water conservation and water harvesting, drought proofing, micro irrigation works, provision of irrigation, renovation of traditional water bodies, land development, any other activity approved, sewa kendra, coastal areas, rural drinking water, fisheries, rural sanitation, anganwadi, playground, food grain.
 ‘Works’ are recorded under each kind of physical asset, with these classified as having been ‘approved’, ‘taken up’ and ‘completed’ (with ‘taken up’ presumably meaning commenced but incomplete at the end of the financial year). What matters therefore is to study those that have been completed, as the kind of community asset created and certified as being completed would serve to indicate what the community has decided it needs as a priority.
 When so filtered, the number of completed physical assets in the 34 districts of Maharashtra for the year 2015-16 totalled 71,554 – a large number that helps describe why the Nrega records are so very voluminous: 1,376 ‘works’ completed every week in 34 districts, with tens of thousands of Nrega beneficiary individuals and households working to build, repair, revive, create them, and with a complex inventory of raw materials being required to be transported and paid for so that these works may take shape.
 What the list of completed works – type and number – describe is very instructive. Of the 17 categories, four (fisheries, anganwadi, playground and food grain) were recorded with not a single instance of having become a ‘work completed’ in any district. On the other hand, four kinds of physical assets accounted for a full 85% of the 71,554 works completed in Maharashtra’s 34 districts for 2015-16 and these were, in ascending order: drought proofing (8,110 and 11% of the total works), rural sanitation (12,234 and 17%), water conservation and water harvesting (14,384 and 20%), and provision of irrigation (26,496 and 37%).
 The popularity of the latter four can be well understood, as much for how they are all linked as for the precarious living conditions that every taluka in Maharashtra’s semi-arid districts face when the winter months end. These biases towards certain works but not others still do however need to be read with conditions, and keeping in mind that these are the works for but one financial year out of the last ten (albeit the definition of what constitutes an asset under Nrega has been altered and added to several times).
 The question that remains is: Maharashtra’s districts and blocks and villages occupy varying agro-ecological, hydrological and meteorological regions. Do their geographic and environmental circumstances not have a role to play in the decisions taken about what Nrega works should be taken up (and completed) as a priority over other kinds?
The charts presented here in groups of districts arranged according to their location amongst the six agro-ecological regions that Maharashtra occupies, indicate whether the Nrega ‘works’ process takes cognisance of the fundamental environmental factors upon which the village (and so panchayat, taluka, district) rest. The charts have been constrained to 200 on the vertical axis in order to preserve readability – values are given for each ‘work’ recorded by each district. The abbreviations for the ‘works’ (horizontal axis) are for the full forms found in the second paragraph.
The ideologies about knowledge

The few paragraphs that follow are taken from my recent article for the TERI (The Energy and Resources Institute) magazine, Terragreen. Published in the 2016 May issue, the article links what we often call traditional knowledge with the ways in which we understand ecology and the ways in which we are defining ‘sustainable development’.
 Sustainable development has today become a commonly used term, yet it describes a concept that is still being considered by different kinds of societies, by each in a manner of its choosing. This has happened because while historically how societies grew to be ‘developed’ was a process that took a variety of pathways, today the prescribed pathway to the ‘modern’ scarcely changes from one country to another.
Hence culturally what these societies have considered as being ‘sustainable’ behaviour – each according to its ecological context – is being replaced by a prescribed template in which interpretations are discouraged. Such a regime of prescription has led only to the obscuring of the many different kinds of needs felt by communities that desire a ‘development’ that makes cultural sense, but also of the kinds of knowledge which will allow that ‘development’ to be sustainable.

Click for image pdf (600kb) of article
Some of this knowledge we can readily see. To employ labels whose origin is western, these streams of knowledge and practice are called traditional knowledge, intangible cultural heritage, indigenous wisdom, folk traditions, or indigenous and local knowledge. These labels help serve as gateways to understand both the ideas, ‘development’ and ‘sustainable’. It is well that they do for today, very much more conspicuously than 20 years earlier, there is a concern for declining biodiversity, about the pace and direction of global environmental change, a concern over the unsustainable human impact on the biosphere and the diminishing of community identity.
There is widespread acknowledgement of the urgency of the situation – this is perceived across cultures, geographical scales (that is, from local units such as a village, to national governments), and knowledge systems (and this includes both formal and non-formal ways of recognising these systems). The need for such a new dialogue on the situation is expressed in several global science-policy initiatives, both older and recent, such as the Convention for Biological Diversity (CBD) which is now 22 years old, and the Intergovernmental Platform on Biodiversity and Ecosystem Services (IPBES), whose first authoritative reports became available in 2015.
Development whose sustainability is defined locally and implemented locally means that the ‘investment’, ‘technology’ and ‘innovation’ (terms that have become popular to describe development efforts) comes from the people themselves. Many diverse agencies at this level – civil society, youth groups, vocational networks, small philanthropies – assist such development and provide the capacities needed. This is the level at which the greatest reliance on cultural approaches takes place, endogenously.
In domains such as traditional medicine, forestry, the conservation of biodiversity, the protection of wetlands, it is practitioners of intangible cultural heritage and bearers of traditional knowledge, together with the communities to which they belong, who observe and interpret phenomena at scales much finer than formal scientists are familiar with. Besides, they possess the ability to draw upon considerable temporal depth in their observations. For the scientific world, such observations are invaluable contributions that advance our knowledge about climate change. For the local world, indigenous knowledge and cultural practices are the means with which the effects of climate change are negotiated so that livelihoods are maintained, ritual and cultivation continue, and survival remains meaningful.
Dimensions of drought
We lack not at all for experience with drought, yet have not grown used to treating water with the greatest of care. Drought does not strike in the manner a hailstorm does, yet our administrations seem unable to read the signals. Citizens and panchayats alike can contribute to our managing droughts better, provided all are willing to change both perception and behaviour.
 It is because drought is such a forbidding condition for any state to fall into that it becomes at once threatening and emotive. Its every symptom becomes a new trial for a drought-afflicted population and simultaneously a likely indictment of the administration, whether local or regional. Food and crop, water and health, wages and relief: this is the short list for which action is demanded by a population concerned for those in the drought-affected districts and blocks.
The administration is bound to answer, as it is likewise bound to plan, prepare, anticipate and act. But where the interrogation of a government for its tardiness in providing immediate relief comes quickly, a consideration of the many factors that contribute to the set of conditions we call drought is done rarely, and scarcely at all when there is no drought. It is the gap between these two activities that has characterised most public criticism of the role of administration today when there is drought.
For farmers and district or block-level administrators alike, drought is a normal and recurrent feature of climate in the dryland regions of India. It occurs in nearly all climatic zones – our long recording history of droughts and floods in particular show that whereas in eastern India (West Bengal, Odisha and Bihar) a drought occurs once in every five years, in Gujarat, East Rajasthan and western Uttar Pradesh the frequency is once in three years. Although the characteristics of what we call drought varies significantly from one meteorological sub-division to another, and indeed from one agro-ecological zone to another, the drought condition arises from a deficiency in precipitation that persists long enough to produce a serious hydrological imbalance.
 Drought is a complex phenomenon. There is first a need to distinguish between meteorological and agricultural droughts. A meteorological drought is a period of prolonged dry weather conditions due to below normal rainfall. An agricultural drought refers to the impact caused by precipitation shortages, temperature anomalies that lead to increased evapotranspiration by crops and vegetation, and consequently to a shortage of the water content in the soil, all being factors that adversely affect crop production and soil moisture. The National Commission on Agriculture has defined an agricultural drought differently for the kharif (monsoon cropping season, July to October) and rabi (winter cropping season, October to March).
What the country has witnessed during March and April is an agricultural drought, brought about by the high temperatures which raised mean and maximum temperatures into the heat-wave band. This we have witnessed in Odisha, Telengana, Vidarbha, Marathwada, north interior Karnataka, Rayalaseema, coastal Andhra Pradesh, Tamil Nadu, eastern Madhya Pradesh and Chhattisgarh, Jharkhand and West Bengal.
[You can read the rest of this article at the Financial Chronicle. Page pdfs are here (2MB) and here (1.8MB).]
A monsoon to look forward to

These gentlemen would welcome any news of a normal monsoon for 2016. Rice farmers in north Goa. Photo: Rahul Goswami
The Indian summer monsoon in 2016, for the months of June to September, will be normal to better-than-normal in almost all of the 36 meteorological sub-divisions. This is my reading of the seasonal climatic predictions provided by five different sources. Should the conditions that presage such a rainy season continue to be favourable, a normal monsoon coming after two years of faltering rain, and with drought conditions have set into many districts, will be a vast relief.
My outlook for the June to September 2016 monsoon period is based on an initial study of the three-monthly and seasonal predictions which are in the public domain, from the following agencies: The Climate Prediction and Monitoring Group of the India Meteorological Department (IMD), Ministry of Earth Sciences, Government of India; the Climate Forecast System Version 2 (CFSv2) by the Climate Prediction Center of the National Centers for Environmental Prediction (NCEP), USA; regionalised Multi-Model Ensemble (NMME) forecasts from the Climate Prediction Center which are based on models of the NOAA and NASA; and the Meteorological ‘Met’ Office of Britain which is a World Meteorological Organisation climate research centre.

Components of a typical model ‘ensemble’
Combining the indications from this early set of forecasts we see that after typical monsoon conditions have set in over southern and peninsular India, the June and July rainfall (quantities) should be normal for June with an increase in average rainfall for July (in the southern peninsula, the west coast, north-eastern states and the north India mountainous states). The five models currently also point to the August and September period recording above normal rainfall over most of India, and normal rainfall in central India.
Predictive capabilities have increased over the last few years, and a number of national weather service agencies collaborate to share data and expertise on climate models. There is much collaboration particularly for the Asian monsoons – our Indian summer monsoon and the monsoon of south-east Asia – because of the implications for the volumes of food crops, in particular rice and wheat, that are likely to be sown and then harvested.
The climatic prediction models whose forecasting products I examined make their predictions for 90-day periods (such as May, June and July together) based on conditions observed and calculated for a given month (January, February and March so far). Later in April and then twice again in May I will consolidate and expand the scope of this initial prognosis – which is of a normal to above normal monsoon – as the forecasts are updated. [This is also posted at India Climate Portal.]
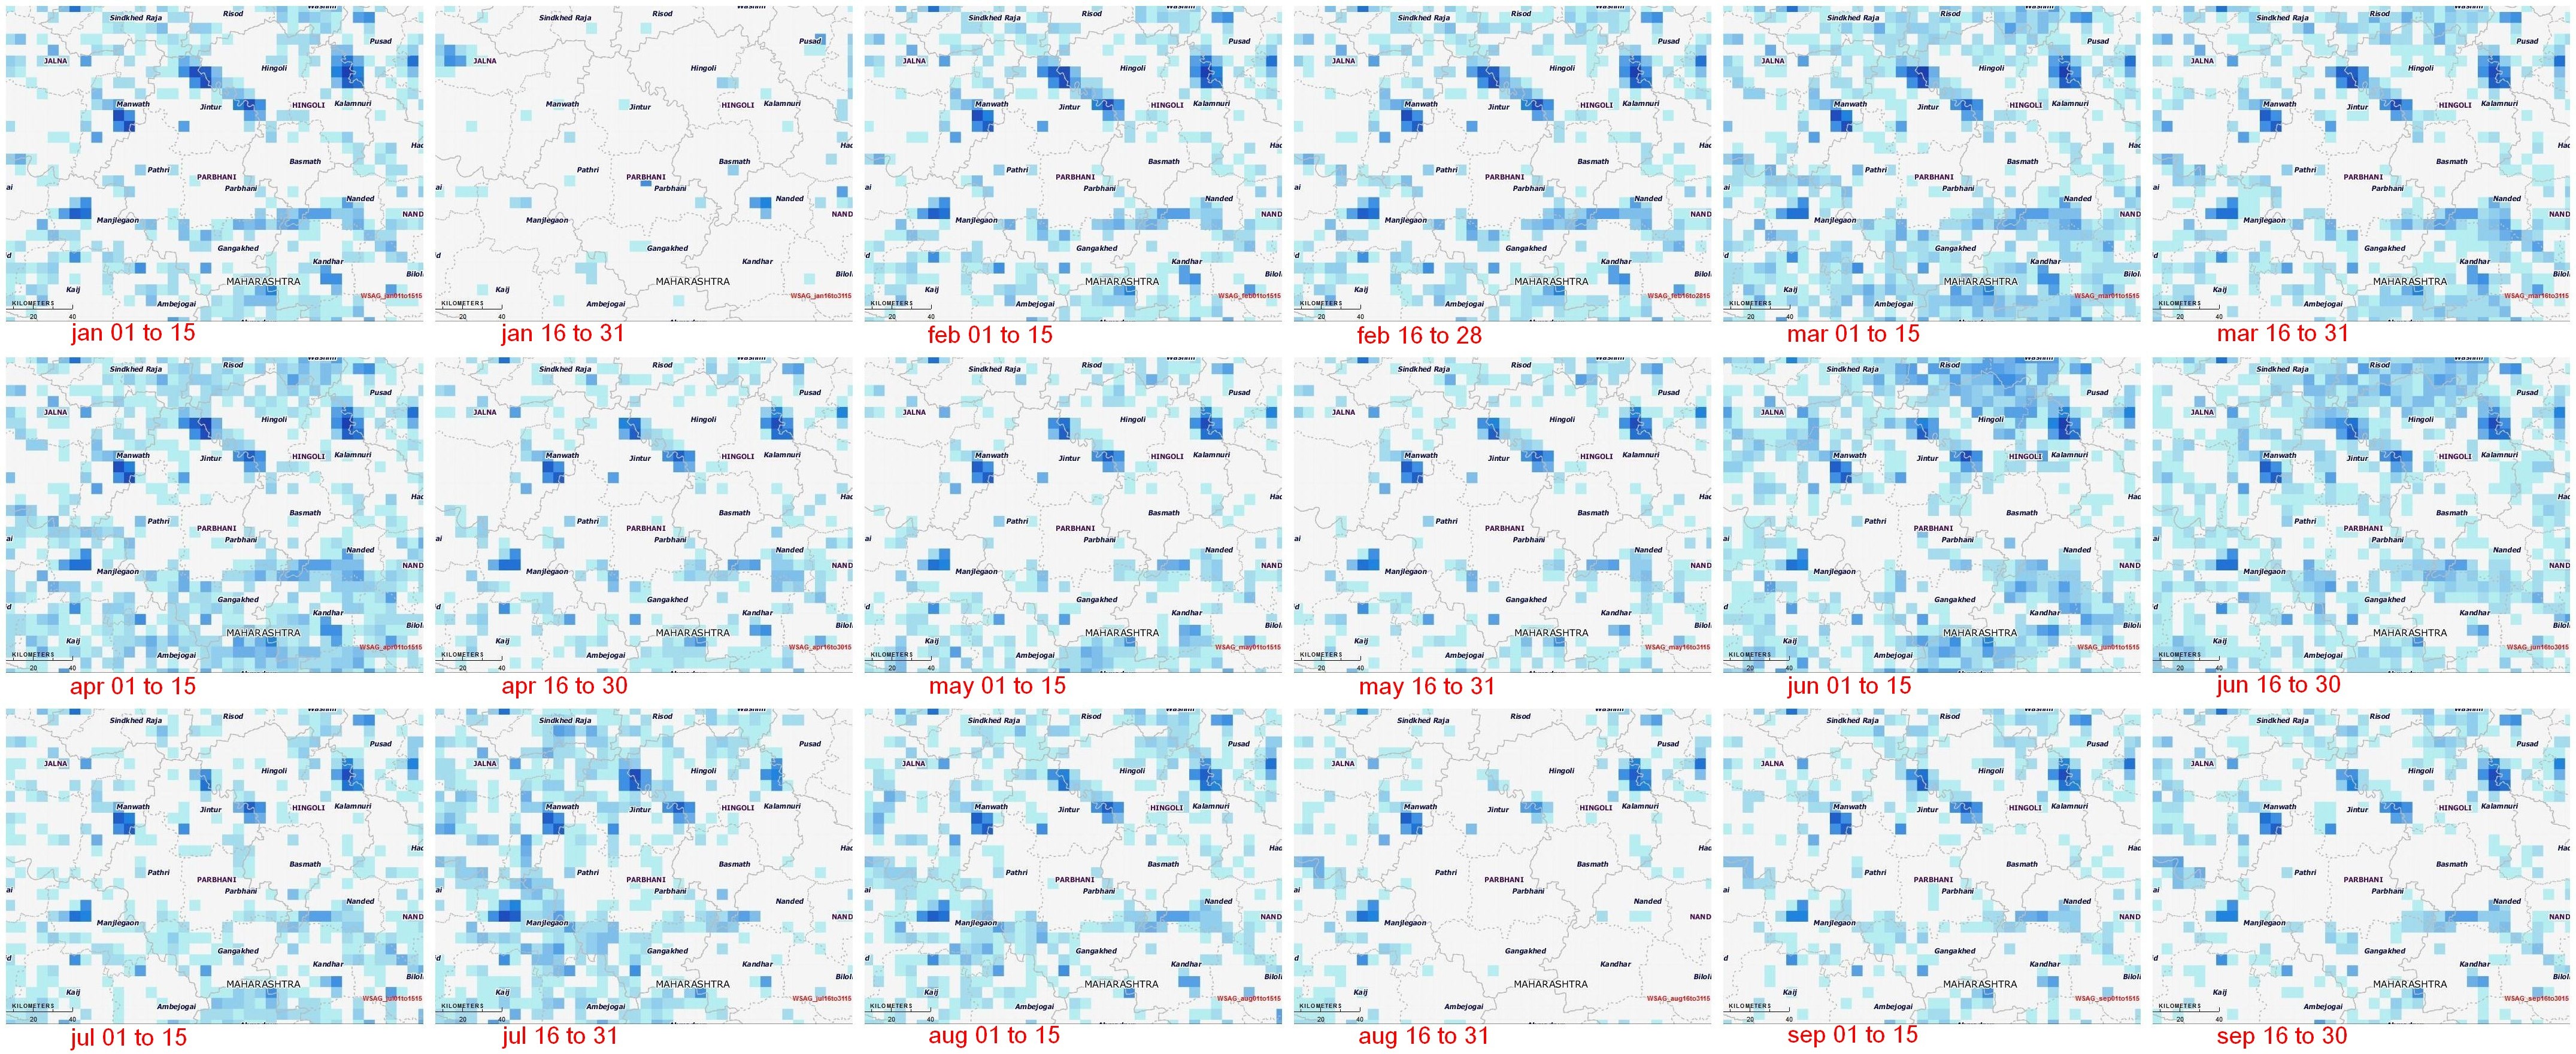
Water and a district in Maharashtra

In this panel of maps the relationship between the district of Parbhani (in the Marathwada region of Maharashtra) and water is graphically depicted over time. The blue squares are water bodies, as seen by a satellite equipped to do so. The intensity of the blue colour denotes how much water is standing in that coloured square by volume – the deeper the blue, the more the water.
Water bodies consist of all surface water bodies and these are: reservoirs, irrigation tanks, lakes, ponds, and rivers or streams. There will be variation in the spatial dimensions of these water bodies depending on how much rainfall the district has recorded, and how the collected water has been used during the season and year. In addition to these surface water bodies, there are other areas representing water surface that may appear, such as due to flood inundations, depressions in flood plains, standing water in rice crop areas during transplantation stages. Other than medium and large reservoirs, these water features are treated as seasonal and some may exist for only a few weeks.
Click on this detail for a full size image (1.7MB) of the panel of fortnightly maps.
The importance of monitoring water collection and use at this scale can be illustrated through a very brief outline of Parbhani. The district has 830 inhabited villages distributed through nine tehsils that together occupy 6,214 square kilometres, eight towns, 359,784 households in which a population of 1.83 million live (1.26 rural and 0.56 million urban). This population includes 317,000 agricultural labourers and 295,000 cultivators – thus water use and rainfall is of very great importance for this district, and indeed for the many like it all over India.

The map of Parbhani district and its talukas, from the Census 2011 District Census Handbook.
This water bodies map for Parbhani district is composed of 18 panels that are identical spatially – that is, centred on the district – and display the chronological progression of water accumulation or withdrawal. Each panel is a 15-day period, and the series of mapped fortnights begins on 1 January 2015.
The panels tell us that there are periods before the typical monsoon season (1 June to 30 September) when the accumulation of water in surface water bodies has been more than those 15-day periods found during the monsoon season. See in particular the first and second fortnights of March, and the first fortnight of April. [Here is a good quality image of the census map, 968KB.]
During the monsoon months, it is only the two fortnights of June in which the accumulation of water in the surface water bodies of Parbhani district can be seen. The first half of July and the second half of August in particular have been recorded as relatively dry.
This small demonstration of the value of such information, provided at no cost and placed in the public domain, is based on the programme ‘Satellite derived Information on Water Bodies Area (WBA) and Water Bodies Fraction (WBF)’ which is provided by the National Remote Sensing Centre (NRSC), Indian Space Research Organisation (ISRO), Department of Space, Government of India.
For any of our districts, such continuous monitoring is an invaluable aid to: facilitate the study of water surface dynamics in river basins and watersheds; analyse the relationships between regional rainfall scenarios and the collection and utilisation of water in major, medium reservoirs and irrigation tanks and ponds; inventory, map and administer the use of surface water area at frequent intervals, especially during the crop calendar applicable to district and agro-ecological zones. [Also posted on India Climate Portal.]
