Archive for the ‘Climate change’ Category
The drying of the Deccan

This panel of 12 images shows the change that takes place in a region of the Deccan. Each image shows what is called a Normalised Difference Vegetation Index (NDVI) for the region. This is a rolling eight-day series computed daily using imagery from the Terra/MODIS system and viewed using the NASA Worldview website.
The colours (green and brown shades, whitish shades) show us the vegetation health with deep green being better than light green, dark brown being better than light brown. The index is also used to signal where areas are beginning to experience arid and water-scarce conditions.
 The region is the west-central Deccan – the Karnataka Plateau – corresponds to the Vijayapur (Bijapur) district of north Karnataka with parts of Bagalkot district and is part of the central Indian semi-arid bioclimatic zone.
The pictures in the panel show the vegetation extent and health (NDVI) calculated on that day for an eight-day period. Each picture is a fortnight apart, and this series starts on 4 November 2016 (bottom right) and ends on 7 April 2017 (top left). The retreat of the green is seen clearly from one fortnight to the next.
Of interest in this region is the Almatti dam and reservoir, in the Krishna river basin, which is visible in the lower centre of each picture. On 13 April there was no water in Almatti, which has a full capacity of 3.105 billion cubic metres (bcm). For the week ending 30 March it had 0.015 bcm of water, the week ending 6 April 0.001 bcm.
 For the week ending 3 November 2016, which is when the panel of pictures begins, Almatti had 2.588 bcm of water. The reservoir water runs a hydroelectric power plant, of 240 MW, and which needs flowing water to turn the turbines.
When the reservoir is full, the hydel plant produces about 175 million units of electricity. But on 13 March the Central Electricity Authority’s daily report showed that Almatti could produce only 3.02 million units. On 10 April, this had plunged to 0.04 million units, but the hydel plant had produced no power since 1 April.
Environmental law and the dharmic principle
 The recent history of “global” approaches to the environment has shown that they began full of contradictions and misunderstandings, which have continued to proliferate under a veneer of internationalisation. To provide but a very brief roster, there was in the 1970s the “Club of Rome” reports, as well as the United Nations Conference on Human Environment in 1972 (which produced the so-called Stockholm Declaration). In 1992, the UN Conference on Environment and Development (Rio de Janeiro) was held and was pompously called the “Earth Summit,” where something called a “global community” adopted an “Agenda 21.” With very much less fanfare also in 1992 came the Convention on Biological Diversity, and signing countries were obliged to “conserve and sustainably manage their biological resources through global agreement,” an operational conundrum when said resources are national and not international.
In 2000 came the “Millennium Summit,” at which were unveiled the Millennium Development Goals, which successfully incubated the industry of international development but had almost nothing to do with the mundane practice of local development. In 2015 came the UN Sustainable Development Summit, which released a shinier, heftier, more thrillingly complex list of sustainable development goals. During the years in between, the UN Framework Convention on Climate Change and its associated satellite meetings (three or four a year) spun through every calendar year like a merry-go-round (it is 22 years old, and the very global CO2 measure for PPM, or parts per million, has crossed 400).

The visarjan (immersion) of Shri Ganesh. The idol is accompanied by huge crowds in Mumbai. Photo: All India Radio
Looking back at some five decades of internationalisation as a means to some sort of sensible stock-taking of the connection between the behaviors of societies (ever more homogenous) and the effects of those behaviors upon nature and environment, I think it has been an expensive, verbose, distracting, and inconclusive engagement (but not for the bureaucratic class it sustains, and the “global development” financiers, of course). That is why I find seeking some consensus between countries and between cultures on “ecocide” is rather a nonstarter. There are many differences about meaning, as there should be if there are living cultures left amongst us.
Even before you approach such an idea (not that it should be approached as an idea that distinguishes a more “advanced” society from one apparently less so), there are other ideas, which from some points of view are more deserving of our attention, which have remained inconclusive internationally and even nationally for fifty years and more. Some of these ideas are, what is poverty, and how do we say a family is poor or not? What is economy and how can our community distinguish economic activity from other kinds of activity (and why should we in the first place)? What is “education,” and what is “progress”-and whose ideas about these things matter other than our own?
That is why even though it may be academically appealing to consider what ecocide may entail and how to deal with it, I think it will continue to be subservient to several other very pressing concerns, for very good reasons. Nonetheless, there have in the very recent past been some efforts, and some signal successes too, in the area of finding evidence and intent about a crime against nature or, from a standpoint that has nothing whatsoever to do with law and jurisprudence, against the natural order (which we ought to observe but for shabby reasons of economics, career, standard of living, etc., do not).

Clay cooking pots and decorative terracotta. A craftsman and his wares at a weekly market in Kerala.
These efforts include Bolivia’s Law of the Rights of Mother Earth, whose elaborate elucidation in 2010 gave environmentalists much to cheer about. They also include the recognition by the UN Environment Programme, in incremental doses and as a carefully measured response to literally mountainous evidence, of environmental crime. This is what the UNEP now says, “A broad understanding of environmental crime includes threat finance from exploitation of natural resources such as minerals, oil, timber, charcoal, marine resources, financial crimes in natural resources, laundering, tax fraud and illegal trade in hazardous waste and chemicals, as well as the environmental impacts of illegal exploitation and extraction of natural resources.” Quite frank, I would say, and unusually so for a UN agency.
Moreover, there is the Monsanto Tribunal, which is described as an international civil society initiative to hold Monsanto-the producer of genetically modified (GM) seed, and in many eyes the most despised corporation ever-“accountable for human rights violations, for crimes against humanity, and for ecocide.” In the tribunal’s description of its rationale, ecocide is explicitly mentioned, and the tribunal intends to follow procedures of the International Court of Justice. It is no surprise that Monsanto (together with corporations like Syngenta, Dow, Bayer, and DuPont) is the symbol of industrial agriculture whose object and methods advance any definition of ecocide, country by country.
This ecocidal corporation (whose stock is traded on all major stock markets, which couldn’t care less about the tribunal) is responsible for extinguishing entire species and causing the decline of biodiversity wherever its products are used, for the depletion of soil fertility and of water resources, and for causing an unknown (but certainly very large) number of smallholder farming families to exit farming and usually their land, therefore also exiting the locale in which bodies of traditional knowledge found expression. Likewise, there is the group of Filipino investigators, a Commission on Human Rights, who want forty-seven corporate polluters to answer allegations of human rights abuses, with the polluters being fossil fuel and cement companies, including ExxonMobil, Chevron, and BP, and the allegations include the roles of these corporations’ products in causing both “global warming and the harm that follows.”

A ‘gudi’ and ‘bhagwa dhvaj’ hoisted by a home in Goa for Gudi Padwa, the festival which marks the beginning of the new year.
Such examples show that there is a fairly strong and active manifestation of the movement to recognise ecocide as a crime under international law. However, to find such manifestations, one has to look at the local level. There, the questions pertain more tangibly to the who, what, and how of the ecological or environmental transgression, and the how much of punishment becomes more readily quantifiable (we must see what forms of punishment or reparation are contained in the judgments of the Monsanto Tribunal and the Philippines Commission).
Considering such views, the problem becomes more immediate but also more of a problem-the products of industrialised, mechanised agriculture that is decontextualised from culture and community exists and are sold and bought because of the manner in which societies sustain themselves, consciously or not. It is easier to find evidence for, and easier to frame a prosecution or, the illegality of a corporation, or of an industry, than for the negligence of a community which consumes their products. So the internationalisation (or globalisation) of the idea of ecocide may take shape in a bubble of case law prose and citations from intergovernmental treaties but will be unintelligible to district administrators and councils of village elders.
My view is that searching for the concept which for the sake of semantic convenience we have called ecocide as an outcome of an “internationally agreed” idea of crime and punishment will ultimately not help us. I have such a view because of a cultural upbringing in a Hindu civilisation, of which I am a part, and in which there exists an all-embracing concept, “dharma,” that occupies the whole spectrum of moral, religious, customary, and legal rules. In this view, right conduct is required at every level (and dominates its judicial process too), with our literature on the subject being truly voluminous (including sacred texts themselves, the upanishads, various puranas, and works on dharma).
Perhaps the best known to the West from amongst this corpus is the Arthashastra of Kautilya, a remarkable legal treatise dealing with royal duties which contains a fine degree of detail about the duties of kings (which may today be read as “governance”). This treatise includes the protection of canals, lakes, and rivers; the regulation of mines (the BCE analogue of the extractive industries that plague us today); and the conservation of forests. My preference is for the subject of ecocide and its treatment to be subsumed into the cultural foundation where it is to be considered for, when compared with how my culture and others have treated the nature-human question, it becomes evident that we today are not the most competent arbiters, when considering time frames over many generations, about how to define or address such matters. The insistence on “globalising” views in fact shows why not.
(This comment has been posted at the Great Transition Initiative in reply to an essay titled ‘Against Ecocide: Legal Protection for Earth’.)
The ideologies about knowledge

The few paragraphs that follow are taken from my recent article for the TERI (The Energy and Resources Institute) magazine, Terragreen. Published in the 2016 May issue, the article links what we often call traditional knowledge with the ways in which we understand ecology and the ways in which we are defining ‘sustainable development’.
 Sustainable development has today become a commonly used term, yet it describes a concept that is still being considered by different kinds of societies, by each in a manner of its choosing. This has happened because while historically how societies grew to be ‘developed’ was a process that took a variety of pathways, today the prescribed pathway to the ‘modern’ scarcely changes from one country to another.
Hence culturally what these societies have considered as being ‘sustainable’ behaviour – each according to its ecological context – is being replaced by a prescribed template in which interpretations are discouraged. Such a regime of prescription has led only to the obscuring of the many different kinds of needs felt by communities that desire a ‘development’ that makes cultural sense, but also of the kinds of knowledge which will allow that ‘development’ to be sustainable.

Click for image pdf (600kb) of article
Some of this knowledge we can readily see. To employ labels whose origin is western, these streams of knowledge and practice are called traditional knowledge, intangible cultural heritage, indigenous wisdom, folk traditions, or indigenous and local knowledge. These labels help serve as gateways to understand both the ideas, ‘development’ and ‘sustainable’. It is well that they do for today, very much more conspicuously than 20 years earlier, there is a concern for declining biodiversity, about the pace and direction of global environmental change, a concern over the unsustainable human impact on the biosphere and the diminishing of community identity.
There is widespread acknowledgement of the urgency of the situation – this is perceived across cultures, geographical scales (that is, from local units such as a village, to national governments), and knowledge systems (and this includes both formal and non-formal ways of recognising these systems). The need for such a new dialogue on the situation is expressed in several global science-policy initiatives, both older and recent, such as the Convention for Biological Diversity (CBD) which is now 22 years old, and the Intergovernmental Platform on Biodiversity and Ecosystem Services (IPBES), whose first authoritative reports became available in 2015.
Development whose sustainability is defined locally and implemented locally means that the ‘investment’, ‘technology’ and ‘innovation’ (terms that have become popular to describe development efforts) comes from the people themselves. Many diverse agencies at this level – civil society, youth groups, vocational networks, small philanthropies – assist such development and provide the capacities needed. This is the level at which the greatest reliance on cultural approaches takes place, endogenously.
In domains such as traditional medicine, forestry, the conservation of biodiversity, the protection of wetlands, it is practitioners of intangible cultural heritage and bearers of traditional knowledge, together with the communities to which they belong, who observe and interpret phenomena at scales much finer than formal scientists are familiar with. Besides, they possess the ability to draw upon considerable temporal depth in their observations. For the scientific world, such observations are invaluable contributions that advance our knowledge about climate change. For the local world, indigenous knowledge and cultural practices are the means with which the effects of climate change are negotiated so that livelihoods are maintained, ritual and cultivation continue, and survival remains meaningful.
Dimensions of drought
We lack not at all for experience with drought, yet have not grown used to treating water with the greatest of care. Drought does not strike in the manner a hailstorm does, yet our administrations seem unable to read the signals. Citizens and panchayats alike can contribute to our managing droughts better, provided all are willing to change both perception and behaviour.
 It is because drought is such a forbidding condition for any state to fall into that it becomes at once threatening and emotive. Its every symptom becomes a new trial for a drought-afflicted population and simultaneously a likely indictment of the administration, whether local or regional. Food and crop, water and health, wages and relief: this is the short list for which action is demanded by a population concerned for those in the drought-affected districts and blocks.
The administration is bound to answer, as it is likewise bound to plan, prepare, anticipate and act. But where the interrogation of a government for its tardiness in providing immediate relief comes quickly, a consideration of the many factors that contribute to the set of conditions we call drought is done rarely, and scarcely at all when there is no drought. It is the gap between these two activities that has characterised most public criticism of the role of administration today when there is drought.
For farmers and district or block-level administrators alike, drought is a normal and recurrent feature of climate in the dryland regions of India. It occurs in nearly all climatic zones – our long recording history of droughts and floods in particular show that whereas in eastern India (West Bengal, Odisha and Bihar) a drought occurs once in every five years, in Gujarat, East Rajasthan and western Uttar Pradesh the frequency is once in three years. Although the characteristics of what we call drought varies significantly from one meteorological sub-division to another, and indeed from one agro-ecological zone to another, the drought condition arises from a deficiency in precipitation that persists long enough to produce a serious hydrological imbalance.
 Drought is a complex phenomenon. There is first a need to distinguish between meteorological and agricultural droughts. A meteorological drought is a period of prolonged dry weather conditions due to below normal rainfall. An agricultural drought refers to the impact caused by precipitation shortages, temperature anomalies that lead to increased evapotranspiration by crops and vegetation, and consequently to a shortage of the water content in the soil, all being factors that adversely affect crop production and soil moisture. The National Commission on Agriculture has defined an agricultural drought differently for the kharif (monsoon cropping season, July to October) and rabi (winter cropping season, October to March).
What the country has witnessed during March and April is an agricultural drought, brought about by the high temperatures which raised mean and maximum temperatures into the heat-wave band. This we have witnessed in Odisha, Telengana, Vidarbha, Marathwada, north interior Karnataka, Rayalaseema, coastal Andhra Pradesh, Tamil Nadu, eastern Madhya Pradesh and Chhattisgarh, Jharkhand and West Bengal.
[You can read the rest of this article at the Financial Chronicle. Page pdfs are here (2MB) and here (1.8MB).]
Food, climate, culture, crops and government

The weekly standardised precipitation index of the India Meteorological Department (IMD) which is a running four-week average. This series shows the advancing dryness of districts in south India.
In November 2015, the Departmentally Related Standing Committee on Agriculture of the Lok Sabha, Parliament of India, invited suggestions and submissions on the subject “Comprehensive Agriculture Research based on Geographical Condition and Impact of Climatic Changes to ensure Food Security in the Country”.
The Committee called for inputs on issues such as the need to evolve new varieties of crops which can withstand climatic fluctuation; requirement to evolve improved methods of irrigation; the need to popularise consumption of crops/fruits which can provide better nutrition; the need to develop indigenous varieties of cattle that can withstand extreme climatic stress; the need to develop a system for precision horticulture and protected cultivation; diversification of species of fish to enhance production from the fisheries sector; the need to strengthen the agriculture extension system; and means to focus on agriculture education.
I prepared a submission as my outline response, titled “Aspects of cultivation, provision of food, and use of land in Bharat today and a generation hence”. The outline I provided includes several issues of current urgency and connects them to scenarios that are very likely to emerge within a generation. My intention is to signal the kinds of pathways to preparation that government (central and state) may consider. It is also meant to flag important cultural and social considerations that lie before us, and to emphasise that economic and quantitative measurements alone are not equipped to provide us holistic guidance.
The outline comprises three sections.
(A) The economic framework of the agriculture and food sector and its imperatives.
(B) The social, ecological, and resource nature of crop cultivation, considering factors that influence it.
(C) Methods, pathways and alternatives possible to adopt with a view to being inter-generationally responsible.
In view of the current climatic conditions – heat waves in the central and eastern regions of the country, stored water in our major reservoirs which are at or near ten-year lows – I reproduce here the section on the economic framework of the agriculture and food sector and its imperatives. The full submission can be found here [pdf, 125kb].
This framework considers the agriculture and food sector, including primary agricultural production recorded, the inputs and products of industry based on agricultural raw material (primary crop whether foodgrain, horticulture, spices, plantation, ruminants and marine, oilseeds, fibres), agribusiness (processing in all its forms), supply chains connecting farmers and farmer producer organisations to primary crop aggregators, buyers, merchants, stockists, traders, consumers, as well as associated service providers. This approach is based on the connection between agricultural production and demand from buyers, processers and consumers along what is called the supply chain.

Water storage quantities in the 91 major reservoirs in the first week of April 2016. Blue bars are each reservoir’s full storage capacity (in billion cubic metres, bcm) and orange bars are the current storage at the time. Data from the Central Water Commission, Government of India.
If this framework is considered as existing in Bharat to a significant degree which influences crop cultivation choices, the income of cultivating household, the employment generation potential of associated service providers, then several sets of questions require answers:
* Concerning economic well-being and poverty reduction: what role does agricultural development need to play in promoting economic stability in rural (and peri-urban) regions thereby contributing to poverty reduction and how can the agrifood sector best contribute to jobs and higher incomes for the rural poor?
* Concerning food security: what role can agricultural and agro-industry development play in ensuring rural and urban communities have reliable access to sufficient, culturally appropriate and safe food?
* Concerning the sustainability of food producing systems: how should agriculture and agro-industry be regulated in a participatory manner so as to ensure that methods of production do not overshoot or endanger in any way (ecological or social) conservative carrying capacity thresholds especially in the contexts of climate change and resource scarcity?
When viewed according to the administrative and policy view that has prevailed in Bharat over the last two generations, there is a correlation between agricultural productivity growth and poverty reduction and this is the relationship the macro- economic and policy calculations have been based upon. Our central annual agricultural (and allied services) annual and five-year plan budget and state annual and five-year plan budgets have employed such calculations since the 1950s, when central planning began.
However the choices that remain open to us are considerably fewer now than was the case two generations (and more) ago when the conventional economic framework of the agriculture and food sector took shape.
Wind and soil, culture and change

With soils and humus, with grasses wild or cultivated, with water whose form may be a hill tarn or a great tropical river, has intangible cultural heritage found expression and renewal. Whether in the Himalayan hill districts of northern India, the central province of Sri Lanka with its hydraulic wonders, the great basin of the Tonle Sap in Cambodia whose bidirectional water flow is the basis of both ritual and an aquacultural livelihood, or the highland ‘aldeias’ of central Timor-Leste, in which an age-old institution that bans exploitation of the forest continues to be respected, the bio-physical foundation on which so much intangible cultural heritage depends has remained plentiful and as reliable as the seasons.
 But no longer, for new disturbances have shaken this relationship and they are depleting these fundamental materials just as much as altering their very nature. The new uncertainty is undermining the intimate knowledge held by communities of natural processes in their specific locations, such as inter-annual variations in weather or the cycles of certain plant and animal species. Protecting such knowledge is of critical importance – not only for its role of being cultural heritage, and for respecting the wealth of accumulated and transmitted knowledge – but because it possesses the keys to living with change, and especially living with the effects and impacts of climate change.
In domains such as traditional medicine, forestry, the conservation of biodiversity, the protection of wetlands, it is ICH practitioners and the communities they belong to who observe and interpret phenomena at scales much finer than formal scientists are familiar with, besides possessing the ability to draw upon considerable temporal depth in their observation. For the scientific world, such observations are invaluable contributions that advance our knowledge about climate change. For the local world, indigenous knowledge and cultural practices are the means with which the effects of climate change are negotiated so that livelihoods are maintained, ritual and cultivation continue, and survival remains meaningful.
[This short extract is taken from ‘How intangible cultural heritage adapts to a changing world’, my article in the current issue of the UNESCO World Heritage Review. The entire article can be read here (pdf 558kb).]
Why India must rely on local food stocks

The below average June to September monsoon season will lead to lower foodgrains production. What is the likely impact and how can society cope?
Context – For the last four years the numbers that describe India’s essential food security have become a common code: 105 million tons (mt) of rice, 95 mt of wheat, 41 to 43 mt of coarse cereals, 19 to 20 mt of pulses, 165 to 170 mt of vegetables and 80 to 90 mt of fruit.
With these quantities assured, our households feed themselves, army and factory canteens are supplied, the public distribution system is kept stocked and the processed and retail food industry secures its raw material.
Only provided there is such assurance, and that the allowance for plus or minus is as small as possible. Monsoon 2015 has removed that assurance for the agricultural year 2015-16. Our 36 states and union territories – and the 63 cities whose populations are more than a million – must begin to deal with the possible scenarios immediately.
Stock scenarios – In September 2015 the Department of Agriculture, Cooperation and Farmers Welfare, of the Ministry of Agriculture, Government of India, released the first of its usual four ‘advance estimates’ for the 2015-16 agricultural year. Each estimate sets the targets for the year for the foodgrain (and also commercial) crops, and provides with every estimate how likely it is that the annual target will be met.
This first advance estimate has issued a direct warning: rice production is estimated at 90.6 mt against a target of 106.1 mt. The wheat target is just under 95 mt but there is no estimate provided as yet. The target for coarse cereals is 43.2 mt whereas the advance estimate is just under 28 mt. The target for pulses is 20mt and the first estimate is 5.5mt.
What are the implications? The responsibility of the Department is to provide a provisional reading of the conditions that affect the production of our staple crops, and to inform and prepare state and central governments of the likelihood of shortfalls in foodgrain. The signal it has given for rice, estimated at 85% of the target, must be taken as a flashing red beacon which demands that our food stocks return to the foreground of the national agenda.
It is likely that the second and third advance estimates will see quantities revised upwards, but our planning must be based on this first estimate so that even the most adverse of natural contingencies can be met with suitable measures.
Using the first advance estimate as the basis, here are the likely annual production quantities, at 90% of the target and at 95% of the target: rice, between 95 and 101 mt; wheat, between 85 and 91 mt; coarse cereals, between 39 and 42 mt; pulses, between 16 and 17 mt; total foodgrains, between 236 and 250 mt of which cereals are between 220 and 232 mt.
 Household demand – Will these quantities suffice, as for the last four years total foodgrain targets and production have been in the region of 260-273 mt?
To help answer this question, two sets of deductions must be accounted for. To begin with, for each main category of foodgrain, there are production quantities, imports, stock variations and exports. When these are added or subtracted, a gross domestic supply quantity remains.
It is worth also noting that this gross quantity is still no more than a best assessment that is synthesised from the information provided by state governments. The first set of deductions is by way of feed, seed and waste (foodgrain that is used in animal feed, is harvested to use as seed for sowing, and which is damaged after harvest or rendered unusable because of pests and infection). Allowing for the lowest likely level of deductions, the combined deduction is about 7% for rice, 10.5% for wheat, 17% for coarse cereals, 15% for pulses, 5% for vegetables and 10% for fruits.
The available quantities are now revised further. Under a 95% of target scenario, we will have 93.5 mt of rice, 81 mt of wheat, 34.5 mt of coarse cereals and 14.5 mt of pulses. In the same way, a 95% of target scenario for vegetables is 153.5 mt and for fruits it is 72.5 mt. On the consumption side we have the households – in 2016 we will have 175 million rural and 83 million urban households.
These households will require a baseline minimum of 181 mt of cereals, 136 mt of vegetables, 45 mt of fruits and 41 mt of pulses. Under a 95% of production target scenario therefore, there will be enough cereals, enough vegetables and enough fruits. We have been falling short in pulses for several years.
But this apparent comfort is still without the second set of deductions. And these are: (1) buffer stocks of rice and wheat to be maintained, with 5-8 mt of rice during the year and 10-18 mt of wheat during the year (to fulfil the demands on the public distribution system and to fulfil the allocations for the food-based welfare programmes), and in addition the strategic reserve of 2 mt of rice and 3 mt of wheat to be maintained; (2) the use of foodgrains by the food processing and retail food industry; (3) exports of primary crops (such as rice and in particular basmati) and processed crops (vegetables and fruits); (4) the industrial use of foodgrain (including for biodiesel); (5) the diversion of cereals to alcohol distilleries.
Some amongst the second set of deductions are known – such as the withdrawals for buffer stocks and the food reserves, and the export quantities – but the others are either hidden, concealed or misreported. In a food production scenario that is less than 95% of targets (in the way that rice has already been estimated for 2015-16), the deductions from gross crop production will decrease available foodgrains, vegetables and fruits to levels that will compromise household food security, especially those households in the lower income brackets.
Recommendations – The climate variations that have led the Department of Agriculture to raise a red flag warning are no longer uncommon. The 2015 monsoon was affected by El Nino conditions, which are expected to continue into the first quarter of 2016. These changes in the pattern of the Indian summer monsoon are amplified by land use change in our districts, by deforestation, by rapid urbanisation, by inequitous water use, and by consumption behaviour. Some of these can be addressed through policy, education and incentives over the long term. What is needed immediately however are:
a) A review of the drivers of crop cultivation choice in our watersheds and agro-ecological zones so that, as far as possible, these settlements units begin the transition towards local food security in sustainable ways. This means that the income-led arguments which favour the cultivation of commercial crops for farming households must be critically re-examined – in a situation of primary crop scarcity an income buffer alone will not help these households.
b) The demands placed by export arrangements (including the export of meat, which represents fodder and feed) and by the food processing and retail food industry must be quantified and made public. Especially at the level of district administrations, the need to rationally incentivise land use towards the cultivation of food crop staples that suit agro-ecological conditions has become an urgent one. The decentralisation of planning that can make such an approach possible can take place only when hitherto hidden and concealed foodgrains use becomes public.
c) To reach self-reliance at the level of panchayat or block (tahsil, taluka), cooperative farming must be vigorously encouraged, villages must become self-reliant in the provisioning of their food staples (a consideration that must balance that of the ‘national market’), the bio-physical limits of the major food producing districts (the top 250 by quantity) have already been reached and this necessarily limits the demand urban India can exert upon rural districts, in terms not only of food quantities but also in terms of the population that must be fully engaged in foodgrains cultivation.
Lessons of monsoon 2015 for district India
 With two weeks of the June to September monsoon remaining in 2015, one of the end-of-season conclusions that the India Meteorological Department (IMD) has spoken of is that four out of ten districts in the country has had less rainfall than normal.
This overview is by itself alarming, but does not aid state governments and especially line ministries plan for coming months, particularly for agriculture and cultivation needs, water use, the mobilisation of resources for contingency measures, and to review the short- and medium-term objectives of development programmes. [See ‘A method for a post-carbon monsoon’ for a recent discussion.]
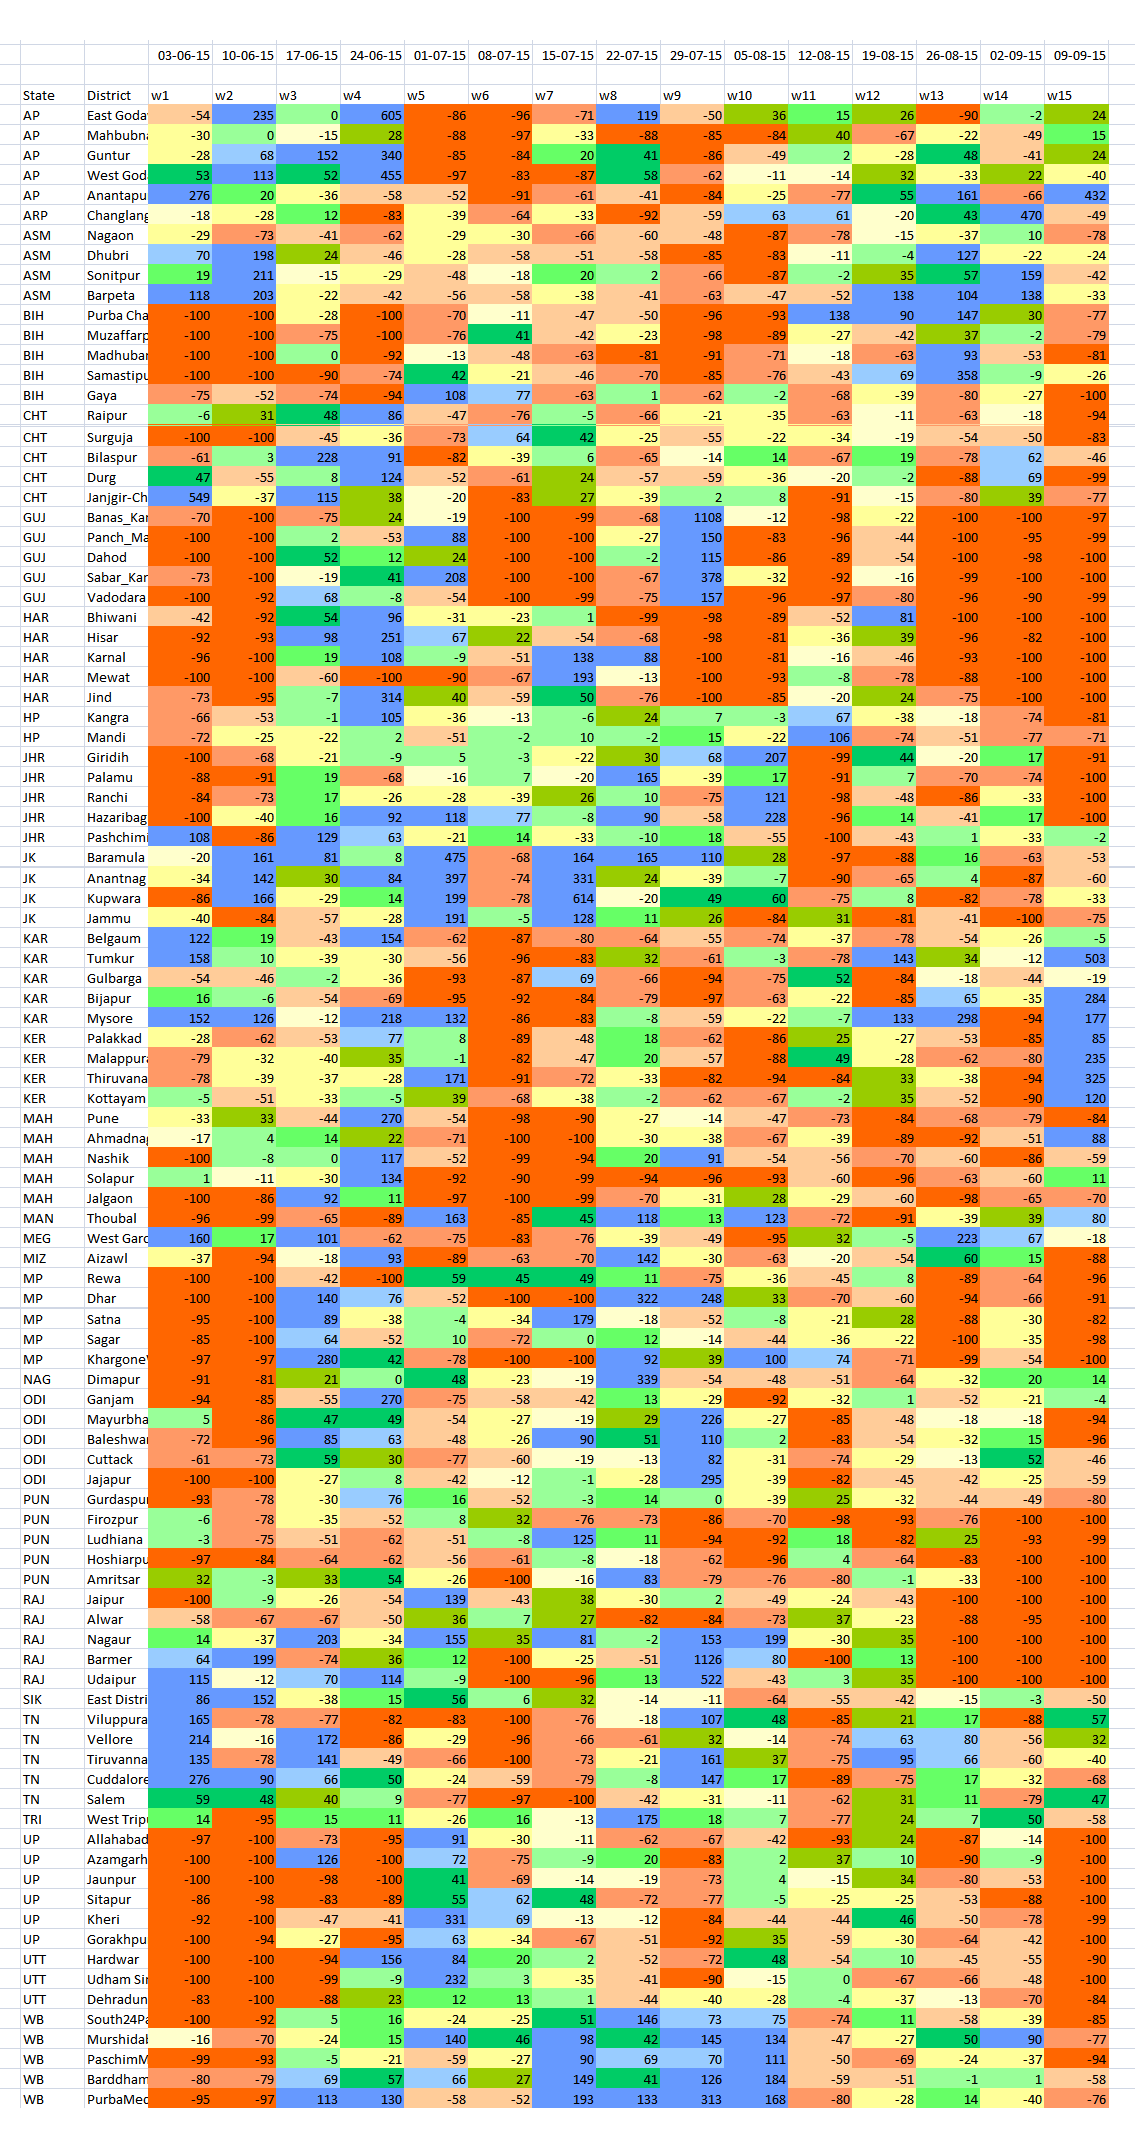 The detailed tabulation (done for 15 weeks) is meant to provide guidance of where this may be done immediately – in the next two to four weeks – and how this can be done in future. The districts are chosen on the basis of the size of their rural populations (calculated for 2015). Thus Purba Champaran in Bihar, Bhiwani in Haryana, Rewa in Madhya Pradesh and Viluppuram in Tamil Nadu are the districts in those states with the largest rural populations.
In this way, the effect of rainfall variability, from Week 1 (which ended on 3 June) to Week 15 (which ended on 9 September), in the districts with the largest rural populations can be analysed. Because a large rural population is also a large agricultural population, the overall seasonal impact on that district’s agricultural output can also be inferred.
The distribution of the districts is: six from Uttar Pradesh; five each from Andhra Pradesh, Bihar, Chhattisgarh, Gujarat, Haryana, Jharkhand, Karnataka, Maharashtra, Madhya Pradesh, Odisha, Punjab, Rajasthan, Tamil Nadu and West Bengal; four each from Assam, Jammu and Kashmir, and Kerala; three from Uttarakhand; two from Himachal Pradesh; one each from Arunachal Pradesh, Manipur, Meghalaya, Mizoram, Nagaland, Sikkim and Tripura.
Using the new 11-grade rainfall categorisation, a normal rainweek is one in which the rainfall is between +10% more and -10% less for that week. The overview for this group of 100 districts, only 11 have had five or more normal weeks of rain out of 15 weeks. In alarming contrast, there are 77 districts which have had three or fewer normal weeks of rain – that is, more than three-fourths of these most populous districts. Half the number (51 districts) have had two, one or no normal weeks of rain. And 22 of these districts have had only one or no normal weeks of rain.
From this group of 100 most populous (rural population) districts Gorakhpur in Uttar Pradesh and Nagaon in Assam have had the most deficit rainweeks, tallying 13, out of the 15 tabulated so far. There are ten districts which have had 12 deficit rainweeks out of 15 and they are (in decreasing order of rural population): Muzaffarpur (Bihar), Pune and Jalgaon (Maharashtra), Surguja (Chhattisgarh), Panch Mahals and Vadodara (Gujarat), Firozpur (Punjab), Thiruvananthapuram (Kerala), Hoshiarpur (Punjab) and Mewat (Haryana).
[Also posted by India Climate Portal as ‘Where they waited for rain in 2015’.]
A method for a post-carbon monsoon

The uses to which we have put available climatic observations no longer suit an India which is learning to identify the impacts of climate change. Until 2002, the monsoon season was June to September, there was an assessment in May of how well (or not) the monsoon could turn out, and short-term forecasts of one to three days were available only for the major metros and occasionally a state that was in the path of a cyclone. But 2002 saw the first of the four El Niño spells that have occurred since 2000, and the effects on our Indian summer monsoon began to be felt and understood.
The India Meteorology Department (which has become an everyday abbreviation of IMD for farmers and traders alike) has added computational and analytical resources furiously over the last decade. The new research and observational depth is complemented by the efforts of a Ministry of Earth Sciences which has channelled the copious output from our weather satellites, under the Indian Space Research Organisation (ISRO), and which is interpreted by the National Remote Sensing Centre (NRSC), to serve meteorological needs.
The IMD, with 559 surface observatories, 100 Insat satellite-based data collection platforms, an ‘integrated agro-advisory service of India’ which has provided district-level forecasts since 2008, a High Performance Computing System commissioned in 2010 (whose servers run at Pune, Kolkata, Chennai, Mumbai, Guwahati, Nagpur, Ahmedabad, Bengaluru, Chandigarh, Bhubaneswar, Hyderabad and New Delhi) ploughs through an astonishing amount of numerical data every hour. Over the last four years, more ‘products’ (as the IMD system calls them) based on this data and its interpretation have been released via the internet into the public domain. These are reliable, timely (some observation series have three-hour intervals), and valuable for citizen and administrator alike.

The new 11-grade indicator for assessing weekly rainfall departures in districts. Same data, but dramatically more useful guidance.
Even so, the IMD’s framing of how its most popular measures are categorised is no longer capable of describing what rain – or the absence of rain – affects our districts. These popular measures are distributed every day, weekly and monthly in the form of ‘departures from normal’ tables, charts and maps. The rain adequacy categories are meant to guide alerts and advisories. There are four: ‘normal’ is rainfall up to +19% above a given period’s average and also down to -19% from that same average, ‘excess’ is +20% rain and more, ‘deficient’ is -20% to -59% and ‘scanty’ is -60% to -99%. These categories can mislead a great deal more than they inform, for the difference between an excess of +21% and an excess of +41% can be the difference between water enough to puddle rice fields and a river breaking its banks to ruin those fields.
In today’s concerns that have to do with the impacts of climate change, with the increasing variability of the monsoon season, and especially with the production of food crops, the IMD’s stock measurement ‘product’ is no longer viable. It ought to have been replaced at least a decade ago, for the IMD’s Hydromet Division maintains weekly data by meteorological sub-division and by district. This series of running records compares any given monsoon week’s rainfall, in a district, with the long period average (a 50-year period). Such fineness of detail must be matched by a measuring range-finder with appropriate interpretive indicators. That is why the ‘no rain’, ‘scanty’, ‘deficient’, ‘normal’ or ‘excess’ group of legacy measures must now be discarded.
In its place an indicator of eleven grades translates the numeric density of IMD’s district-level rainfall data into a much more meaningful code. Using this code we can immediately see the following from the chart ‘Gauging ten weeks of rain in the districts’:
1. That districts which have experienced weeks of ‘-81% and less’ and ‘-61% to -80%’ rain – that is, very much less rain than they should have had – form the largest set of segments in the indicator bars.
2. That districts which have experienced weeks of ‘+81% and over’ rain – that is, very much more rain than they should have had – form the next largest set of segments in the indicator bars.
3. That the indicator bars for ‘+10% to -10%’, ‘-11% to -20%’ and ‘+11% to +20%’ are, even together, considerably smaller than the segments that show degrees of excess rain and degrees of deficient rain.

Far too many districts registering rainfall departures in the categories that collect extremes of readings. This is the detailed reading required to alert state administrations to drought, drought-like and potential flood conditions.
Each bar corresponds to a week of district rainfall readings, and that week of readings is split into eleven grades. In this way, the tendency for administrations, citizens, the media and all those who must manage natural resources (particularly our farmers), to think in terms of an overall ‘deficit’ or an overall ‘surplus’ is nullified. Demands for water are not cumulative – they are made several times a day, and become more or less intense according to a cropping calendar, which in turn is influenced by the characteristics of a river basin and of an agro-ecological zone.
The advantages of the modified approach (which adapts the Food and Agriculture Organisation’s ‘Global Information and Early Warning System’ categorisation, designed to alert country food and agriculture administrators to impending food insecurity conditions) can be seen by comparing the single-most significant finding of the IMD’s normal method, with the finding of the new method, for the same point during the monsoon season.
By 12 August 2015 the Hydromet Division’s weekly report card found that 15% of the districts had recorded cumulative rainfall of ‘normal’ and 16% has recorded cumulative rainfall of ‘deficient’. There are similar tallies concerning rainfall distribution – by region and temporally – for the meteorological sub-divisions and for states. In contrast the new eleven-grade measure showed that in seven out of 10 weeks, the ‘+81% and over’ category was the most frequent or next-most frequent, and that likewise, the ‘-81% and less’ category was also the most frequent or next-most frequent in seven out of 10 weeks. This finding alone demonstrates the ability of the new methodology to provide early warnings of climatic trauma in districts, which state administrations can respond to in a targeted manner.
Mapping climate behaviour, ten days at a time

This year, the Global Information and Early Warning System (GIEWS, a project of the FAO) has brought into public domain a new rainfall and vegetation assessment indicator. The indicator takes the form of maps which describe conditions over blocks of ten days each, with each such block termed a dekad (from the Greek for ‘ten’). Thus we have visual views of divisions of thirds of a month which from a crop cultivation point of view, now lies between the weekly and fortnightly assessments regularly provided by agri-meteorological services.

How to read the colours used in the rainfall anomaly maps.
In 2015, what was quickly called “out of season” rainfall was experienced in most of India during March and April. These conditions carried over into May and that is why the typical contrast between a hot and rainless May and a wet June is not seen.
The panel of maps shows the incidence of normal, below normal and above normal rain during six dekads of May and June. Greens signal above normal, yellows are normal and reds are below normal. The first dekad of May looks like what the second week of June normally does, but for the large above normal zone in the north-central Deccan. The second dekad of May has in this set had the largest number of above normal points, with more rain than usual over the southern peninsula, and over Chhattisgarh, Odisha, West Bengal. Rajasthan and Punjab.
The third dekad of May shows most of India as far below normal. This changes in the first dekad of June, with rain over the eastern coast registering much above normal for the period – Tamil Nadu, Rayalaseema, Andhra Pradesh and Odisha. During the second dekad of June, the divide north and south of the Vindhyas is visible, when northern India and the Gangetic belt continued to experience very hot days whereas over Telengana, Karnataka, Vidarbha and Madhya Maharashtra there was above normal rainfall. During the third dekad of June the picture was almost reversed as the southern states fell below their running rainfall averages.
This panel describes not rainfall but the anomalies (above and below) recorded in received rainfall. At the level of a meteorological sub-division or a river basin, the anomaly maps are a quick and reliable guide for judging the impacts of climate variability on crop phases (preparation, sowing, harvest) and on water stocks.
