Posts Tagged ‘El Niño’
A method for a post-carbon monsoon

The uses to which we have put available climatic observations no longer suit an India which is learning to identify the impacts of climate change. Until 2002, the monsoon season was June to September, there was an assessment in May of how well (or not) the monsoon could turn out, and short-term forecasts of one to three days were available only for the major metros and occasionally a state that was in the path of a cyclone. But 2002 saw the first of the four El Niño spells that have occurred since 2000, and the effects on our Indian summer monsoon began to be felt and understood.
The India Meteorology Department (which has become an everyday abbreviation of IMD for farmers and traders alike) has added computational and analytical resources furiously over the last decade. The new research and observational depth is complemented by the efforts of a Ministry of Earth Sciences which has channelled the copious output from our weather satellites, under the Indian Space Research Organisation (ISRO), and which is interpreted by the National Remote Sensing Centre (NRSC), to serve meteorological needs.
The IMD, with 559 surface observatories, 100 Insat satellite-based data collection platforms, an ‘integrated agro-advisory service of India’ which has provided district-level forecasts since 2008, a High Performance Computing System commissioned in 2010 (whose servers run at Pune, Kolkata, Chennai, Mumbai, Guwahati, Nagpur, Ahmedabad, Bengaluru, Chandigarh, Bhubaneswar, Hyderabad and New Delhi) ploughs through an astonishing amount of numerical data every hour. Over the last four years, more ‘products’ (as the IMD system calls them) based on this data and its interpretation have been released via the internet into the public domain. These are reliable, timely (some observation series have three-hour intervals), and valuable for citizen and administrator alike.

The new 11-grade indicator for assessing weekly rainfall departures in districts. Same data, but dramatically more useful guidance.
Even so, the IMD’s framing of how its most popular measures are categorised is no longer capable of describing what rain – or the absence of rain – affects our districts. These popular measures are distributed every day, weekly and monthly in the form of ‘departures from normal’ tables, charts and maps. The rain adequacy categories are meant to guide alerts and advisories. There are four: ‘normal’ is rainfall up to +19% above a given period’s average and also down to -19% from that same average, ‘excess’ is +20% rain and more, ‘deficient’ is -20% to -59% and ‘scanty’ is -60% to -99%. These categories can mislead a great deal more than they inform, for the difference between an excess of +21% and an excess of +41% can be the difference between water enough to puddle rice fields and a river breaking its banks to ruin those fields.
In today’s concerns that have to do with the impacts of climate change, with the increasing variability of the monsoon season, and especially with the production of food crops, the IMD’s stock measurement ‘product’ is no longer viable. It ought to have been replaced at least a decade ago, for the IMD’s Hydromet Division maintains weekly data by meteorological sub-division and by district. This series of running records compares any given monsoon week’s rainfall, in a district, with the long period average (a 50-year period). Such fineness of detail must be matched by a measuring range-finder with appropriate interpretive indicators. That is why the ‘no rain’, ‘scanty’, ‘deficient’, ‘normal’ or ‘excess’ group of legacy measures must now be discarded.
In its place an indicator of eleven grades translates the numeric density of IMD’s district-level rainfall data into a much more meaningful code. Using this code we can immediately see the following from the chart ‘Gauging ten weeks of rain in the districts’:
1. That districts which have experienced weeks of ‘-81% and less’ and ‘-61% to -80%’ rain – that is, very much less rain than they should have had – form the largest set of segments in the indicator bars.
2. That districts which have experienced weeks of ‘+81% and over’ rain – that is, very much more rain than they should have had – form the next largest set of segments in the indicator bars.
3. That the indicator bars for ‘+10% to -10%’, ‘-11% to -20%’ and ‘+11% to +20%’ are, even together, considerably smaller than the segments that show degrees of excess rain and degrees of deficient rain.

Far too many districts registering rainfall departures in the categories that collect extremes of readings. This is the detailed reading required to alert state administrations to drought, drought-like and potential flood conditions.
Each bar corresponds to a week of district rainfall readings, and that week of readings is split into eleven grades. In this way, the tendency for administrations, citizens, the media and all those who must manage natural resources (particularly our farmers), to think in terms of an overall ‘deficit’ or an overall ‘surplus’ is nullified. Demands for water are not cumulative – they are made several times a day, and become more or less intense according to a cropping calendar, which in turn is influenced by the characteristics of a river basin and of an agro-ecological zone.
The advantages of the modified approach (which adapts the Food and Agriculture Organisation’s ‘Global Information and Early Warning System’ categorisation, designed to alert country food and agriculture administrators to impending food insecurity conditions) can be seen by comparing the single-most significant finding of the IMD’s normal method, with the finding of the new method, for the same point during the monsoon season.
By 12 August 2015 the Hydromet Division’s weekly report card found that 15% of the districts had recorded cumulative rainfall of ‘normal’ and 16% has recorded cumulative rainfall of ‘deficient’. There are similar tallies concerning rainfall distribution – by region and temporally – for the meteorological sub-divisions and for states. In contrast the new eleven-grade measure showed that in seven out of 10 weeks, the ‘+81% and over’ category was the most frequent or next-most frequent, and that likewise, the ‘-81% and less’ category was also the most frequent or next-most frequent in seven out of 10 weeks. This finding alone demonstrates the ability of the new methodology to provide early warnings of climatic trauma in districts, which state administrations can respond to in a targeted manner.
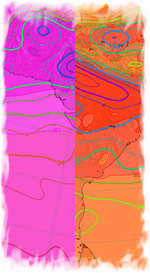
Winds of monsoon India

This panel of four images shows: top left, winds at around sea level; top right, winds at about 1,460 metres altitude (around 4,780 feet); lower left, winds at 3,010 metres (9,880 feet); lower right, winds at 5,570 metres (18,280 feet).
These are the wind patterns that are bringing the monsoon to us from just above the equator, as they travel east-north-eastwards towards the Indian peninsula, and earlier north-north-westwards as they travelled from near Madagascar and the Mascarene Islands, which lie about 21 degrees south of the equator.
 In the top two images, the south-west (from our point of view) winds sweeping across the Arabian Sea are the dominant feature, with the winds at the higher of the two altitudes (right, at 850 millibars, or mb, which is around 1,460 metres) rushing in at just the direction and velocity they ought to. Winds at near-sea level are less powerful, and in both the two top images winds are also seen travelling due north up the Bay of Bengal.
In the lower two images, the vortex of Cyclone Ashobaa is clearly seen, with wind trails running due east across the Arabian Sea, then across peninsular India and out over the Bay of Bengal towards Burma. More markdly with the winds in the lower left image, which are at 700 mb or 3,010 metres, they scarcely touch central and north-western India and the Gangetic belt (whereas the winds at lower altitudes, as seen in the upper two images, do).
Finally, in the lower right image are the winds at 500 mb, or 5,570 metres. Here we see them streaming powerfully down from the Hindu Kush-western Himalaya, across north India and thence right across the Gangetic belt, through Assam and the north-east. These are the major wind patterns we have now in mid-July, and they will change in strength, direction and intent as El Nino changes and also as the Northern hemisphere summer continues over the Eurasian land mass.
These wonderful images are taken from the ‘earth’ weather observation visualisation which skillfully employs the forecasting by supercomputers of current weather data from the Global Forecast System (GFS) and the NOAA/NCEP climate and weather modelling programmes.
How El Niño plans to hijack monsoon 2015

Whether the monsoon starts off on time, whether the June, July, August and September rainfall averages are met, and whether the seasonal pattern of the monsoon is maintained are expectations that must now be set aside.
According to the Climate Prediction Center’s ENSO probability forecast, there is a 90% chance that El Niño conditions will prevail through June to August of the northern hemisphere and a more than 80% percent chance El Niño will last throughout all of 2015.
What this means, especially when record warm global atmospheric temperatures (because we in South Asia and our neighbours in East Asia have continued burned coal as if the resulting CO2 and soot simply doesn’t exist) are being set, is the remaining months of 2015 – the monsoon period included – will bring strange, dangerous and extreme weather. We have already seen that over the last week, with the death toll from the heat wave having crossed 550.

The Ministry of Earth Sciences El Niño/La Nina, Indian Ocean Dipole Update (10 May 2015)
For the first time since 1998 – the year of the strongest El Niño on record, which played havoc with the world’s weather patterns and was blamed for 23,000 deaths worldwide – ocean temperatures in all five El Niño zones have risen above 1 degree Celsius warmer than normal at the same time. That is read by climatologists and ocean scientists as presaging an El Niño that is moderately strong to strong. The forecast models updated in May are now unanimous that El Niño is going to keep strengthening through the rest of 2015. (See also the official forecast from the USA’s government climate science agency.)
El Niño’s home is in the tropical eastern Pacific, but we in India need to watch the waters to our south very closely. New research published in the journal Nature Geoscience has examined records going back to 1950 and noticed that Indian Ocean absorbed heat at a low level until 2003. Thereafter, the excess oceanic heat in the Pacific Ocean found its way through the Indonesian archipelago and into the Indian Ocean. This is the gigantic reservoir of watery heat that is going to dictate terms to our summer monsoon, or what our school textbooks call the south-west monsoon.
It is a worry for the entire South Asian region – India, Pakistan, Sri Lanka, Bangladesh, Nepal, the Maldives, Burma, Afghanistan and Bhutan. That is why when the Forum on Regional Climate Monitoring-Assessment-Prediction for Asia (FOCRA) issued its seasonal outlook for June to August 2015 it predicted weaker than normal Indian summer and East Asian monsoons. Precipitation over land is influenced by external factors such as the El Niño Southern Oscillation (the ENSO), the ‘Indian Ocean Dipole’, the ‘Arctic Oscillation’, and so on.
There may be a “timely onset” of the monsoon, as the venerable IMD is used to saying, but that doesn’t mean our troubles are over. Far from it.
An epidemic of misreading rain

Who can you turn to? It’s easier to list those whom you shouldn’t turn to, the top rankers being the country’s press and television wallahs, followed at a not respectable distance by academic commentators, then come the government blokes and bureaucrats (some of whom do know the difference between isobars and salad bars, I’ll give them that). Lurking behind this cacophonous mob are the boffins of the IMD and its associated scientific chapters, a number of whom have got their sums right, but who aren’t given the space and encouragement to tell the great Bharatiya public what said public is yearning to hear simply because regulations forbid, just like it was in 1982, 1957, whenever.
As I may have mentioned before, this is Not A Good Thing. It has taken about a decade of mission mode tutoring (how the UPA bureaucrats loved that phrase, mission mode) to get the media wallahs to see the difference between weather and climate. A few may even have learned to read a wet bulb thermometer and puzzle their way through precipitation charts.
 But overall, the profusion of android apps that profess to show cool graphics of clouds with lightning bolts erupting topside so that our humble ‘kisans’ know when it’s going to rain (i.e., by looking down at their screens instead of up at the sky) has not helped the Bharatiya public make more sense of less rain. We have squadrons of Insats and Kalpanas buzzing around the globe beaming pictures from the infra-red to the infra dig back home, every 60 or 90 minutes, busy enough to crash a flickr photo server, but the knowledge that said public can sift from it is sparse, rather like the rainfall over Barmer, Bikaner and Ajmer.
And so it goes, with the waiting for rain replacing with an equal banality waiting for Godot but with a far larger cast of characters, most of them insensible to the greater climatic drama being played out, 30,000 feet overhead, and at the poles, in the vast turquoise swells of the eastern Pacific where a malignant El Nino is brooding, in the Himalayan valleys where crystal zephyrs have been shoved aside by an airborne mat of PM2.5, or to the desiccation that creeps outwards from our towns and cities (7,935 of them, India’s triumphant ‘growth story’) that have enclosed sweeping hectares with cement, asphalt, and the hot foetid belches of factories and air-conditioners. GDP, they have been told, is the great liberator.
And that is why we have in place of the quiet concern of our forefathers in their dhotis, an electronic jumble of shrill alarm. “Weak monsoon intensifies drought like conditions in India” was one such headline, the text beneath finding the most ludicrous connections: “… threat of food inflation and weak rural demand in the first year of the Narendra Modi government”. Naturally, the cheerleaders of a demand-centric world cannot do otherwise.
 And likewise with “Weak rains deliver India’s new Modi government its first economic challenge” that desultorily spies impending delays in the “sowing of main crops such as paddy, corn and sugarcane” and which notes mournfully that “about half of all farms lack irrigation systems” and, even worse, that “reservoir levels are only a fourth of last year’s levels”, this last despite the best efforts, ham-handed though they are, by the Central Water Commission to show India (for Bharat knows) that the reservoir levels in the 85 major reservoirs are low, but not much lower at this point in 2014 than they were in 2013. The GDP bullies dislike contrary numbers, and would go cross-eyed were someone to mischievously mention the existence of 4,845 large dams in India (the blue-ribboned 85 included) whose many water levels we don’t in fact know at all.
And similar vapidity from another quarter, which like its peers cloaks ineptitude with what it takes to be appropriate jargon, “The cumulative rainfall across the country has so far been 45 per cent below the Long Period Average (LPA) for 1951-2000” and brandishes even more frightful credentials with “a further breakdown of rain data recorded in different meteorological subdivisions shows that normal rainfall has been recorded in only seven of the 36 regions”. But which sere farmer and her wise daughters consider in their universe such things as meteorological subdivisions, when their world is what Balraj Sahni and Nirupa Roy in 1953 showed us so lambently, is no more than ‘do bigha zamin’?
But still the misreading gathers pace, as vexed fixations upon an existence merely economic chase away plain common-sense. For rains may come or rains may go, but in tractors – for so we are instructed by the agents of hardened merchants – we trust. To wit: “… tractor sales have typically expanded at a double-digit pace in the years when rains have disappointed… In the 11 years between fiscal 2003 and fiscal 2013, rains fell short by 5% or more on six occasions… In four of those six years, tractor sales grew at a double-digit pace”. Let us then leave behind our cares and go rollicking over the dusty, still dustier now, plains of the Deccan in tractors tooting red.
But a shadow of monsoon yet for Bharat, and at June’s end. It is past time that the prattling ceased and the learning began.
North India 2014, much dust, more heat, late rain

The sweltering of North India, aggravated by manic urbanisation, just as manic use of personal automobiles, the steady thinning of tree canopies, and small businesses forced to buy diesel generators – in the tens of thousands, each emitting hot fumes that further trap already heated layers of sooty air – is an annual pre-monsoon epic that no-one has the energy to write.
This panel of four maps shows us where India baked during the last week of 2014 May (and now, Delhi has experienced a record its residents did not want). The high temperature belts (top left map), 40-45 Celsius, covered most of central and north-western India (Maharashtra, Madhya Pradesh, Gujarat, Rajasthan, Gangetic Uttar Pradesh, Haryana, Punjab and Delhi). Minimum temperatures (top right), 20-15 Celsius, are seen in two pockets – south interior Karnataka and in the North-East over Manipur and Mizoram.
These temperature maps may be read with the rainfall for the same period, 2014 May 25-31, to correlate particularly the temperature anomalies (how much higher or lower the normal maxima and minima have departed) with where it has rained. The rainfall map (lower left) shows rain having fallen over south Karnataka, but also north West Bengal and eastern Bihar, coastal Odisha and southern Haryana. These appear to relate to a group of anomalies (lower right): the first being interior Tamil Nadu, north-eastern Karnataka and adjacent Andhra Pradesh; the second being eastern Uttar Pradesh and adjacent Bihar. [You can get the four maps in this zip file.]

Read these from top left – 21, 22 and 23 June. Lower row – 24, 25 and 26 June. The green shading is the rain-bearing cloud cover. After 20 June the peninsula will have rain in most meteorological zone but North and north-west India will still await the monsoon system.
What these don’t show, but which the longer range forecast Indian Institute of Tropical Meteorology (Pune, Maharashtra) has on record, is that monsoon 2014 will not touch northern India until the fourth week of June. Rain-bearing cloud and wind systems will cover, in this forecast, peninsular India by around the 16th or 17th of June, but it will be another week before they deliver some relief to the cemented and asphalted surfaces of the National Capital Territory and its parched surroundings.
These very helpful maps are used by the Pune-based met researchers as part of their monsoon monitoring and forecasting partnership with several international climatoloigcal research institutes, chief amongst them the National Oceanic and Atmospheric Administration (NOAA) of the USA through its Climate Prediction Centre.
The Tropmet – as the Pune group is usually called – has bequeathed to us a definition (perhaps for this season only, subject to revision when climate change asserts itself) of monsoon rain that is in part scientific and in part geographic, which I think is a good sign (the Indian Meteorological Department will disagree, but we know better). The faster Tropmet decides to communicate in language appreciated, and understood, by Bharatiya citizens, the more said citizens will find an interest in correcting the misconceptions of scientists.
Tropmet says: “Rainfall within the summer monsoon season is mainly punctuated by the northward propagating monsoon intraseasonal oscillations (MISOs) with timescales of 30-60 days that manifests as spells of heavy rainfall and periods of quiescent rainfall, instead of a continuous deluge.” In the Konkan, we like our continuous deluge and the old-timers would have sixteen names for different sorts of deluge (and an equally rich chest of monsoon nouns for other sorts of rain).
Weighing the monsoon winds for El Niño
Ignoring the torpor of the summer heat, the India Meteorological Department has dusted off the statutory paragraphs that give us in the sub-continent a first indication of what monsoon for the year may be like. The result this year, both scintillating pages, has been made that much more gripping by the inclusion of El Niño. The IMD’s treatment of the normal variables whose interplay determine the nature of any monsoon is perfunctory – which is surprising as the regional and international earth observation networks spare no detail and tend to inundate us with data and analysis.

Clouds and wind, land and farm. The equation that all rural districts make at this time of the year, but which is becoming more difficult with every year that climate change strengthens its grip.
But the IMD, especially for the south-west monsoon, has always preferred to be spartan. Perhaps there is some philosophical dictum that us non-meteorologists have yet to grasp, and if so then the only criticism we may be permitted, if the IMD had its way, its to ask for more such teaching. But the IMD does not have its way, and we publics whose monies support its work must continue to demand from the recalcitrant department better, much better, application and communication of its work.
The official release, ‘Long Range Forecast For the 2014 Southwest Monsoon Season Rainfall’, is delivered to us by the IMD, Ministry of Earth Sciences (MoES). There is the usual paragraph claiming a profundity of observation and of the IMD being a standard-bearer of superior method. “Operational models are critically reviewed regularly and further improved through inhouse research activities,” says the IMD. But what we still have, in a tradition that is probably three generations old, is the two stage forecast (one in April, the second in June). [Here is the release in Hindi.]
I think this proves how out of step the IMD – and the Ministry of Earth Sciences (grand title isn’t it?) – is with what citizens of India experience in their villages, towns, fields and hills. For, the south-west monsoon no longer arrives in the first week of June, and it no longer begins to depart by mid-September. Climate change began to alter that comfortable rhythm years ago, but the IMD’s forecasting grindstone is the same, never mind how many new earth observation satellites India pelts into orbit.

With all these provisos, stated and implicit, what has the IMD told us?
First, that the “experimental ensemble forecast based on IMD seasonal forecast model (SFM) indicates that the rainfall during the 2014 monsoon season (June to September) averaged over the country as a whole is likely to be 88% ± 5% of long period average (LPA)”. This means that in places it could be as low as 83% of the average, and no more than 92% of the average. Combine this with the assessments about the 2014 El Niño and we can see why, far from being satisfied that the IMD is considering both the monsoon and El Niño, we ought to monitor independently both and force the IMD to become more responsive.
Second, that “the experimental forecast based on the coupled dynamical model forecasting system suggest that the monsoon rainfall during the 2014 monsoon season (June to September) averaged over the country as a whole is likely to be 96% ± 5% of long period model average (LPMA)”. This is a more hopeful set, but also shows that the IMD, by telling us of two different scenarios from two models, is hedging its forecast, which is not what its job is.
Third, the IMD has said “the experimental five category probability forecasts for the 2014 monsoon season rainfall over the country as a whole using the experimental dynamical prediction system are 33% (deficient), 20% (below normal), 24% (normal), 6% (above normal) and 17% (excess)”. This means, using this ‘probability’, that a normal monsoon for 2014 has only a 1-in-4 chance whereas a deficient monsoon (that is, total rain less than 90% of the long period average) has a 1-in-3 chance.
This is a prognosis that stands between serious and grim, for a 10% drift towards the lower side of an expected average, for any of our 36 agro-meteorological regions, can spell ruin for farmers and severe hardship for water consumers. How have central and state governments prepared for such a forecast? We have no information, most likely because there has been no preparation (there are contingency plans for the chronically drought-prone districts, but these are normally triggered when there is an official declaration by the state government that there are conditions of drought in parts of the state). Elections or no elections, El Niño cares not, and it is up to the state governments to make preparations for a monsoon 2014 whose delivery of water already looks uncertain.
The fifth tolling of the IPCC bell

The first release of the IPCC’s AR5.
The Fifth Assessment Report of the Intergovernmental Panel on Climate Change (IPCC) will begin to be released this week. Between 2013 September and 2014 November, what is now widely referred to as the ‘AR5’ (the fifth assessment report) will be released in stages as the three working groups present their completed work and finally when the overall synthesis report is delivered. AR5 will be the most comprehensive assessment of scientific knowledge on climate change since 2007 when Fourth Assessment Report (AR4) was released.
From around early August, the popular media has begun – in a typically lethargic and lazy manner, choosing to look for controversy rather than the very clear IPCC warnings – to report on the series of releases that will be AR5. But despite the strenuous efforts of the oil and gas industry PR firms, of the automobile industry lobbyists, of the carpetbaggers for the financiers and the banks that have propped up for decades the whole damned mess, even so, the messages have come out and together they are stark and strong.
 Extreme weather events, including heatwaves and storms, have increased in many regions while ice sheets are dwindling at an alarming rate. In addition, sea levels are rising while the oceans are being acidified. From climate change experts to spokespersons of small island states, governments have been told bluntly to end their dithering about fossil fuels and start working to create a global low-carbon economy to curtail global warming.
What it all coalesces into we will begin to see this week. Consult the handy factsheet for WG I that explains how much drafting and reviewing the first release has emerged from. And here is the time-table for the AR5:

The contents of the Working Group I report in 14 packed chapters.
Working Group I assesses the physical science basis of the climate system and natural and anthropogenic climate change (release 2013 September 23-27 in Stockholm, Sweden). [You will find all material for this release at the website devoted to this group’s work.]
Working Group II assesses the vulnerability of socio-economic and natural systems to climate change, negative and positive impacts of climate change, and options for adapting to it (release 2014 March 25-31 in Yokohama, Japan).
Working Group III assesses options for mitigating climate change through limiting or preventing greenhouse gas emissions and enhancing activities that remove them from the atmosphere (release 2014 April 07-12 in Berlin, Germany).
The Synthesis Report will integrate material contained within IPCC Assessment Reports and Special Reports, based exclusively on material contained in the three Working Group Reports and Special Reports produced during the 5th or previous Assessment Cycles, and will be written in a non-technical style suitable for policymakers and address a broad range of question relevant to policy (release 2014 October 27-31 in Copenhagen, Denmark).
[You’ll find more on the websites of the IPCC’s three working groups – Working Group I: The Science of Climate Change; Working Group II: Impacts, Adaptation and Vulnerability; Working Group III: Mitigation of Climate Change – and the Task Force on Greenhouse Gas Inventories. See the chapter contents of the World Group I report here.]
 These details have been missed by the press, some of whom are still spreading the canard that climate change science is beset by uncertainty (it is not, dear biased editor of the Los Angeles Times), or that the IPCC will try “to explain a hiatus in the pace of global warming this century” (look at the charts and read the graphs, Reuters), or that a “global warming pause is central to IPCC climate report” (tell me, BBC, where is the real centre of 14 dense chapters?), or that “the findings muddy the picture about how much carbon dioxide output is affecting the climate” (why, Bloomberg Businessweek, is the truth of climate data so difficult to digest for a news group used to copious amounts of finance data?).
 Beyond and above the efforts of the mainstream press and media to play down the stark and clear warning that demands immediate action, the AR5 will place greater emphasis on assessing the socio-economic aspects of climate change and its implications for sustainable development. New features to look for in the AR5 will include: a new set of scenarios for analysis across Working Group contributions; dedicated chapters on sea level change, carbon cycle and climate phenomena such as monsoon and El Niño; much greater regional detail on climate change impacts, adaptation and mitigation interactions; inter- and intra-regional impacts; and a multi-sector synthesis.
How warm-hot-wet was 2012 September where you live?

Land-ocean temperature anomalies in 2012 September. Map: NOAA-NCDC
Wondering what global warming has to do with violent rainstorms, hurricanes, typhoons, cyclones and other enormous destructive and very wet (and cold) weather phenomena you may have experienced in 2012 September? Here is an answer, provided by the ever-watchful (and woefully under-appreciated) National Climatic Data Center of the USA’s National Oceanic and Atmospheric Administration (NOAA).
In its ‘State of the Climate’, global analysis for 2012 September, the NOAA-NCDC has said:
(1) The average combined global land and ocean surface temperature for September 2012 tied with 2005 as the warmest September on record, at 0.67°C (1.21°F) above the 20th century average of 15.0°C (59.0°F). Records began in 1880.
(2) The globally-averaged land surface temperature for September 2012 was the third warmest September on record, at 1.02°C (1.84°F) above average. The globally-averaged ocean surface temperature tied with 1997 as the second warmest September on record, at 0.54°C (0.97°F) above average.
(3) The average combined global land and ocean surface temperature for January–September 2012 was the eighth warmest such period on record, at 0.57°C (1.03°F) above the 20th century average.
This was the third warmest September over land in the Northern Hemisphere and fourth warmest in the Southern Hemisphere. In the higher northern latitudes, parts of east central Russia observed record warmth, as did parts of Venezuela, French Guiana, and northern Brazil closer to the tropics. Nearly all of South America was much warmer than average as were western Australia and central to eastern Europe. Far eastern Russia, a few regions in southern Africa, and parts of China were cooler than average.

Major significant climate anomalies and events in 2012 September. Map: NOAA-NCDC
Moreover, this was the second warmest summer (June–August) for Hungary since national records began in 1900; Australia experienced its third warmest September since records began in 1950, with the nationally-averaged maximum temperature 1.94°C (3.49°F) above the 1961–1990 average; in Argentina the monthly-averaged daily, maximum, and minimum temperatures were all above normal (and remember both Australia and Argentina are both wheat producers and exporters); Japan observed record warmth during September, the greatest warmth was observed across northern Japan (regions of Hokkaido and Tohuko), which was 3.7°C (6.7°F) above average; in Britain, the average September temperature was 0.7°C (1.3°F) below the 1981–2010 average and was the coolest September for the region since 1994 (that’s certainly linked to the Arctic sea ice melting at a record rate this year).
Charting food price shock, and the World Bank’s economy with truth

Chart source: World Bank (2011), ‘Responding to Higher and More Volatile World Food Prices’ Development Committee Paper prepared by the Agriculture and Rural Development Department using data from FAOSTAT for net cereal imports as a share of consumption and the USDA for food share in household expenditures.
The World Bank’s Food Price Watch for 2012 August has been released (it is a part of the Poverty Reduction and Equity Group’s Poverty Reduction and Economic Management Network). The Watch has in its overview mentioned prices of internationally traded maize and soybeans reaching all-time peaks in July. The rise in prices of wheat – comparable to the 2011 peaks – and the relative stability of the prices of rice have also been mentioned.
The Watch has said: “World Bank experts do not currently foresee a repeat of 2008; however negative factors — such as exporters pursuing panic policies, a severe el Niño, disappointing southern hemisphere crops, or strong increases in energy prices — could cause significant further grain price hikes such as those experienced four years ago.” This idea – of no repeat of 2008 – is plain wrong. The food price spike crisis of 2007-08 did in fact never go away, it subsided for some months, and has this year entered a new phase of pain for consumers particularly those in rural districts and the urban poor, wherever they may be.
As the chart (whose implications ought to be more seriously considered by the Watch, especially since the chart is a World Bank device itself) shows, countries in the Middle East and North and Sub-Saharan Africa are most vulnerable to this global shock. “They have large food import bills, their food consumption is a large share of average household spending, and they have limited fiscal space and comparatively weaker protective mechanisms,” the Watch has said.
Ideas such as ‘fiscal space’ and ‘protective mechanisms’ are not automatically translatable into household terms, and thus have no meaning for those who bear the food inflation burden first and the most. The Watch indeed has said that “domestic food prices in these regions have also experienced sharp increases even before the global shock due to seasonal trends, poor past harvests, and conflict”. Naturally, local circumstances determine how high domestic prices will be pushed from much higher international prices.
In addition to their effects on prices, previous droughts in developing countries have had severe economic, poverty and nutritional impacts, turning transitory shocks into lifetime and inter-generational perils, the 2012 August Food Price Watch has said, and this is certainly painfully true. The problem with the World Bank view (and practice) is when it becomes visible in the Watch with a statement like: “In such contexts, investments in drought-resistant crop varieties have provided large yield and production gains.” No, we do not want to see “investments in drought-resistant crop varieties” which only means thrusting GM seed into the fields of bullied smallholder farmers and GM food into the shops from which low-income households must buy their daily food basket.
Three scant weeks of monsoon 2012

Rainfall over India for the season (right) till mid-June 2012, and a week (left). Too many reds and yellows for this time of June. Graphic: IMD
Three weeks into monsoon 2012 and we are seeing growing rainfall deficits in India. The Indian Meteorological Department, accustomed to sobordinating its forecasting methods to political calculations about the socio-economic impacts of a delayed / below-average monsoon, is still saying the rains are “slightly delayed but not yet a worry for farming”. This is even though its data are pointing to almost all parts of the country having received lower than average rainfall in the first three weeks of June.
“Overall monsoon progress is slightly behind schedule but such delays are usual,” L.S. Rathore, director-general of the India Meteorological Department (IMD), told the media, and for good measure added that there was no cause for concern yet. A national rainfall average has no meaning, as there are 36 meteorological sub-divisions, but even so India has received rains 26% below average so far since the beginning of the season. The Department had forecast an average monsoon in 2012 before the start of the four-month long rainy season in April. Now we await its second official monsoon forecast, due around now.
This seven-day rainfall chart and anomaly chart series shows where monsoon 2012 has failed to reach, and the size of the North Indian and Gangetic dry swathes are indeed worrying:

A seven-day chart series of actual, normal and anomaly rainfall for the third week of June. Charts from IMD
