Posts Tagged ‘USDA’
Why USAID should quit India and look after America

The ‘Feeding America’ county-level food insecurity map. the social situation confronting the great mass of the population, young and old, is characterised by economic insecurity, depressed wages and unprecedented levels of debt.
There is no practical, moral, democratic and defensible reason any longer for the United States Agency for International Development (USAID) and the United States Department of Agriculture (USDA) to continue to have anything to do in India (or anywhere else) relating to food or hunger or poverty.
This is because the growth of food insecurity in the USA has paralleled the rise in the numbers of those who are poor, by any measure whether in terms of income, lack of access to a balanced diet, lack of access to essential social sector services. According to studies that have been released from late 2013 onwards, the number of households in the USA that live on less than US$2 per day more than doubled between 1996 and 2011, from 636,000 to 1.46 million. Moreover, there are now nearly 3 million children who live in households that earn less than $2 per day.
It is absurd and deeply cynical for the government of Barack Obama, the White House, the US State Department, and a host of top-ranking thinktanks to continue to claim that Indo-American ties require USAID and USDA to continue propagating agricultural models and advocating technology-centric solutions in India to solve our problems of poverty and hunger. India must halt all activity with these two agencies and advise them bluntly to turn inwards – for by their own charters that is where they are needed.
The latest evidence comes from Feeding America, which is the national network of food banks in the USA. It has just released its annual report on local food insecurity which shows that one in six Americans – including one in five children – did not have enough to eat at some point in 2012. The report found that there are dozens of counties where more than a third of children do not get enough to eat. The incidence of hunger has grown dramatically. The percentage of households that are “food insecure” rose from 11.1% in 2007 to 16% in 2012.
According to separate data from the Organisation for Economic Cooperation and Development (OECD), food insecurity is more widespread in the USA than in any other major developed country, with the rate of food insecurity in the US nearly twice that of the European Union average, which is by itself worrying for what purport to be the so-called ‘advanced’ economies (whereas India is ’emerging’).
 That we have a situation wherein USAID and USDA (“from the American people”, is the sanctimonious tagline attached to USAID interference, when the American people do not know what injustice is being done to other people in their name, and when they are being robbed of food so that American foreign policy goals are fulfilled) continue to set aid agendas in South Asia while a fifth of American children are hungry is an international social disaster fostered by the current economic system and its political defenders.
In the USA both Democratic and Republican administrations (there is no real difference) have become adept at starving anti-poverty programmes, but have taken that expertise to new levels under Obama. The US Congress and the White House have overseen two successive food stamp cuts in just six months: first in November 2013, when benefits were slashed US$36 per month for a family of four, and again in January 2014, when benefits were cut by an average of US$90 per month for nearly a million households.
Even when the US Census had signalled the new levels of impoverishment reached by the average household, some US$4.1 billion was cut from the food stamps, or SNAP, programme citing “waste, fraud and abuse”. It is significant to note here that exactly the same kind of language has been used in India to call for the curtailing and eventual dismantling of our Public Distribution System (PDS). In cutting about US$90 a month in benefits for 500,000 households – more than a week’s worth of assistance for a typical American family in need – they now encroached on the US$1.50 per person per meal equation (around Rs 90, which may buy two meagre vegetarian thalis in an Indian city).
The government of the USA has done this at a time when, according to the Stockholm International Peace Research Institute (SIPRI), it spent in 2013 US$640 billion which amounted to 36% of the entire world’s total military expenditure. Still unsatisfied by such heinous perversion, the American White House and Congress discontinued unemployment benefits for some three million people (and their two million dependent children), but continued to stall the prosecution of the financial criminals responsible for the 2008 crash.
The concentration of wealth at one social pole is coupled with disastrous social conditions at the other. A generation of young people in the USA has been thrust into poverty and joblessness – almost 16% of young people aged 25 to 34 have incomes below the national poverty line. In comparison, 10% of people in the same age group were in poverty in 2000. The median income of young households is $8,000 less than it was in 2000, in real terms.
The meat map of the world
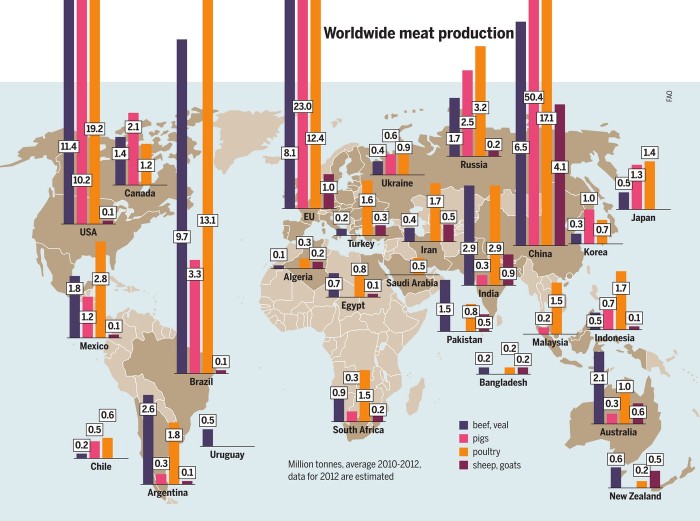
The economies in Asia and elsewhere will see around 80 percent of the growth in the meat sector by 2022. The biggest growth will be in China and India because of huge demand from their new middle classes. Chart: Meat Atlas
Industrial livestock production in Europe and the USA began when feed, energy and land were inexpensive, the ‘Meat Atlas’ has explained, which is published jointly by the Heinrich Böll Foundation and Friends of the Earth Europe.
Nowadays, feed, energy and land have all become scarce and costs have gone up. As a result, total meat production is growing less quickly than before. “The market is growing only for pigs and poultry. Both species utilise feed well and can be kept in a confined space. This means that they can be used to supply the insatiable demand for cheap meat,” the Meat Atlas has said.
By 2022, almost half the additional meat consumed will come from poultry. Beef production, on the other hand, is scarcely growing. The USA remains the world’s largest beef producer, but the meat industry describes the situation there as dramatic. For 2013, it expects a fall of 4-6 per cent compared to 2012 and predicts the decline to continue in 2014. In other traditional producing regions including Brazil, Canada and Europe, production is stagnating or falling.
 “The star of the day is India, thanks to its buffalo meat production, which nearly doubled between 2010 and 2013. India is forcing its way onto the world market, where 25 percent of the beef is in fact now buffalo meat from the subcontinent,” said the Atlas (see this news report from 2013 June).
According to the US Department of Agriculture, India became the world’s biggest exporter of beef in 2012 – going ahead of Brazil. Buffaloes are considered inexpensive to keep by the USDA (what benchmark do they use for husbandry I wonder). Thus the USDA considers buffalo meat a dollar a kilo cheaper than beef from Western cattle. In addition, the Meat Atlas has reminded us, the Indian government has invested heavily in abattoirs. Moreover, faced with the high price of feed, Brazilian cattle-raisers are switching to growing soybeans which has presented an opportunity for Indian buffalo-meat exporters.
China and India differ markedly in their food consumption patterns. In India, a vegetarian lifestyle has deep cultural and social roots. In surveys cited by the Atlas, a quarter or more of all Indians say they are vegetarian. “But the number of meat-eaters is growing. Since the economic boom (my note: usual dreadful mis-labelling here; it is no ‘boom’ but a slow destruction) in the early 1990s, a broad middle class that aspires to a Western lifestyle has emerged (true enough). This includes eating meat which has become a status symbol among parts of the population. Nevertheless, meat consumption in India is still small – per person it is less than one-tenth of the amount consumed in China.”
 The costs borne by the environment because of the world’s fondness for animal-origin protein are probably the biggest, but are still difficult to calculate despite some 30 years of following advances in environmental economics. This helps us estimate some damage to nature in monetary terms. It covers the costs of factory farming that do not appear on industry balance sheets, such as money saved by keeping the animals in appalling conditions. The burden upon nature also grows by over-fertilisation caused by spreading manure and slurry on the land and applying fertilisers to grow fodder maize and other crops.
On foodgrain stock forecasts, the IGC and USDA are both tentative

Foodgrain exports forecasts for 2012-13 by the USDA’s WASDE. These are the major exporting countries, exports in million tons.
In this late February capsule of the foodgrain forecasts from the International Grains Council (IGC) and the US Department of Agriculture’s WASDE (world agriculture supply and demand estimates) we see estimates for slightly higher production, but also somewhat lower consumption. The question is: what about stocks, on which there is never enough knowledge distributed as to who holds them (government or private, traders or bankers) and how they are used by food markets or agricultural commodities markets?
Still, here is what the IGC has said:
Following minor revisions to the 2012-13 forecasts, the estimate for total grains end-season stocks (excluding rice) has been revised up by 4mt to 326m, including increases for both wheat and maize. Overall, however, they remain down 40mt year-on-year at a six-year low, or a 17-year low for the major exporters.
IGC’s 2013 February grain market report presented the first forecast for the 2013-14 supply and demand balance for wheat. “While world output is tentatively projected up 4% year-on-year, much is expected to be absorbed by higher demand and end-season stocks are likely to rise by just 2mt, following a 21m decline in 2012-13. The forecast for 2012-13 end-season maize stocks has been revised 1.7mt higher this month, but major exporters’ end-season inventories are still put at a 16-year low,” said the 2013 February report.
Here are the major foodgrain forecasts for wheat, rice, coarse grain and maize:
Wheat
According to the IGC – Major exporters’ stocks for 2012-13 are revised down by 1.5mt, to 49.9mt, but upward revisions for China and India raise the global total to 176mt, which is still down 21m from last year. Increases for Brazil, Iran and Russia help to lift the 2012-13 world trade forecast by 0.8mt this month, to 137.4m. World output for 2013-14 is tentatively projected up 4% year-on-year, but much is expected to be absorbed by higher demand leaving little room for stock building.
According to WASDE – Global wheat supplies for 2012-13 are nearly unchanged with a small increase in beginning stocks more than offsetting a small decrease in production. Global wheat output is projected 0.7 million tons lower. Production is lowered for Kazakhstan and Brazil, but raised for Ukraine, South Africa, and Belarus. Global wheat consumption is virtually unchanged at 673.4 million tons; however, global consumption is projected down 24.6 million tons year to year, mostly reflecting lower feed and residual use in 2012-13. World wheat ending stocks for 2012-13 are also nearly unchanged this month at 176.7 million tons.
Rice
According to the IGC – At 466mt, world rice production is forecast to be little changed year-on-year, as smaller harvests in Asia, particularly in India, are offset by gains elsewhere. World use is expected to rise by 2% year-on-year, to a fresh record, underpinned by increases in Asia’s leading consumers. Global ending stocks are forecast to fall marginally, but supplies in the major exporters are expected to rise to a new record. World trade in 2013 is projected to decline by 5% as key importers in Asia and Africa reduce purchases from last year’s highs.
According to WASDE – Global 2012-13 projections of rice production and consumption are raised from last month, but trade and ending stocks are lowered. Global 2012-13 rice production is forecast at a record 465.8 million due to increases for Bangladesh, Bolivia, and Nepal partially offset by reductions for Argentina and Laos. Global consumption is raised 0.7 million tons to a record 469.3 million as relatively small changes are made to several countries including Bolivia, Iraq, and Nepal. Global exports for 2012-13 are lowered slightly due mainly to reductions for Argentina and China. Imports are reduced for Bangladesh, Cuba, Egypt, and Indonesia. Global 2012-13 ending stocks are reduced 0.5 million tons to about102.0 million due mostly to decreases for Egypt and Indonesia.
Coarse grain
According to WASDE – Global coarse grain supplies for 2012-13 are projected 2.1 million tons higher as a decrease in beginning stocks is more than offset by a 2.9-million-ton increase in production. Lower 2012-13 beginning stocks mostly reflect an increase in 2011-12 corn exports for Brazil and revisions to the Paraguay corn series that lower 2011-12 corn area and yield. Global 2012-13 production is also higher this month for sorghum, barley, oats, and rye. Sorghum production is raised 0.4 million tons for Mexico with higher area and yields for the summer crop, but lowered 0.2 million tons for Australia with reduced prospects for area and yields. Global barley, oats, and rye production are up a combined 0.6 million tons on larger reported crops for the FSU-12 countries.
Maize (corn)
According to the IGC – Global production is forecast to decline by 3% year-on-year, with sharp falls in the US and EU offsetting rises elsewhere, including in China and the southern hemisphere. Despite some less than ideal weather in recent months, Brazil and Argentina are still set to harvest record crops. Due to tighter supplies, world use is expected to dip by 1% year-on-year, led by reduced demand from the US ethanol sector. With total use again expected to exceed production, closing stocks will decline for a fourth consecutive year, including a sharp drop in the major exporters.
A month into 2013, what will drought do to grain this year?

The US government in 2013 January declared much of the central and southern US Wheat Belt a natural disaster area due to persistent drought threatening the winter wheat harvest.
Drought has tightened its dry grip on US winter wheat, reducing the condition of crops in Kansas, the top producing state, and neighbouring Oklahoma, said this report by Agrimoney. Estimates of the proportion of the crop in “poor” or “very poor” health at 39%, up from 31% at the end of December. The figures also represented a sharp deterioration from a year before, when 49% of winter wheat was rated good or excellent, and 12% poor or very poor.
The result of the continuing drought has been poor conditions for all fall-planted crops and limited grazing of small grains, Agrimoney quoted officials as having said. Most districts received 50% or less of normal rainfall last month, at a time when they had already been in drought for months.
The US Drought Monitor and the associated long-range forecasts spell trouble for grain stocks, movement and of course prices for 2013. Severe to exceptional drought conditions cover most of the cultivation area for hard, red winter wheat, running from the Texas panhandle to Colorado to South Dakota, the US Drought Monitor shows. Winter wheat crops were in the worst condition since at least 1985 at the end of November, according to the US Department of Agriculture.

Bales of corn stalks covered with snow in the state of Nebraska, USA, in late December 2012. Despite some big storms in December, much of the US is still desperate for relief from the country’s longest dry spell in decades. Photo: AP / Nati Harnik
In Russia, grain exports are expected to slump further, as also reported by Agrimoney. Russia’s farm ministry is to cut to 14m tonnes, from 15.5m tonnes, its forecast for grain exports in 2012-13. Trade at that level would represent half the 28m tonnes shipped in 2011-12 (USDA estimates) and imply only minimal exports for the rest of the season, with the tally already at some 13m tonnes.
In Britain, a third Agrimoney report on the impact of weather on grains has said, crop prices have soared thanks to the poor results from 2012 harvests, which showed the lowest wheat yields in 20 years and smallest potato crop since the 1970s. London wheat futures hit a record high of £227.00 a tonne last month, and remain at elevated levels, of £213.40 a tonne for the spot March contract, while potatoes are selling on the open market at £312.28 a tonne, more than triple their levels a year ago, according to the Potato Council.
Bloomberg has reported that the prices of wheat rose in Chicago as US production prospects “dimmed because of a persistent drought in the Great Plains, the biggest growing region for winter crops”. The Bloomberg report explained that the “central and southern plains [of USA] will have mostly below- normal rainfall in the next 10 days, with no significant relief expected”.
Roughly 57.64 percent of the contiguous United States was in at least ‘moderate’ drought as of 2013 January 22, reported the Huffington Post, which is a marginal improvement from 58.87 percent a week earlier. But the worst level of drought, dubbed ‘exceptional’, expanded slightly to 6.36 percent from 6.31 percent of the country.
The IGC raises two bright red flags about world grain

The European Commission’s directorate general of agriculture in its ‘Commodity Price Data’ 2012 August edition contains this chart on ‘cereals/bread and cereals-based products’ that their EU agricultural market and consumer price developments (this shows 2000 January to 2012 August data with the starting month representing the 100 of the index). This chart shows barley (the blue line) is at or near the 2007 peak and maize (the green line) is above the 2007 peak.
The Grain Market Report for 2012 October released a few days ago by the International Grains Council (IGC) makes two extremely important prognoses.

IGC’s 2012 October total grains chart
These two forecasts will have an immediate effect on grains prices as they are traded in the agricultural commodities markets through the winter season of 2012-13, and I expect we will see the effects in the major indices that describe the movements of food and of food prices – the FAO food price index, the World Bank ‘pink sheet’, the IMF commodity prices index, Unctad’s long-running series on agricultural commodities, and of course the various exchanges-based indices (DJ, CBOT, NYSE LIFFE and so on).
The IGC has cut a further 6 million tons (mt) from the 2012-13 forecast for total global grains production, which is now expected to be 5% lower year on year, at 1,761 mt. The decline includes 39 mt of wheat, 46 mt of maize, and 4 mt of barley. “Reduced availabilities and higher prices are expected to ration demand, resulting in the first year on year fall in grains consumption since 1998-99,” said the IGC in this month’s report.

IGC’s 2012 October wheat and rice charts
It is worth making the connection that the United States Department of Agriculture (USDA) in its recent ‘Wheat Outlook’, released on 2012 October 15 by the Economic Research Service, had said that global wheat production in 2012-13 is projected to reach 653.0 million tons, down 5.7 million tons this month (that is, 2012 October). The USDA’s 2012 October Wheat Outlook had said the “largest change this month is a 3.0-million-ton cut in projected wheat production in Australia to 23.0 million” and had added that “projected wheat production in Russia continues its decline as the wheat harvest gets closer to its end and projections for abandoned wheat area get higher, reaching 12% of planted area”. About the European Union (EU-27) wheat production for 2012-13 the USDA Wheat Outlook had reduced it 0.8 million tons to 131.6 mt, mostly because of a significant reduction for the United Kingdom (UK) (down 0.8 million tons to 14.0 million).
The IGC forecasts show a further tightening in the balance this month, with 2012-13 end-season total grains stocks revised down by 4 mt to 328 mt (it was 372 mt the previous year), the lowest since 2007-08 – and we all remember well the global food price increases that set in during the 2007-08 season, and how the spikes of that period were quickly replaced from mid-2010 onwards by the sustained high plateau of food prices.
“Inventories for the major exporters will be even tighter and the smallest for 17 years,” the IGC has said in its 2012 October Report. The global year on year decline is forecast to come from a 24 mt reduction in wheat, an 18 mt decline in maize, and a 1 mt drop in other coarse grains, notably barley. Global grains trade is expected to fall by 19 mt from last year’s high, to 249 mt, with a particularly steep decline for wheat – down by 13 mt year on year, largely due to a forecast reduction in EU feed wheat imports against the backdrop of tight Black Sea supplies. (Also please see the European Commission’s directorate general of agriculture’s ‘Commodity Price Data’ 2012 August edition.)
World grains harvest revised downwards for 2012-13

The IGC Grains and Oilseeds Index (GOI) & sub-Indices, charted from 2009 January (daily, with January 2000=100). Chart: IGC
The world 2012-13 total grains harvest (wheat and coarse grains) forecast has been revised lower by the International Grains Council (IGC) to 1,810 million tons (mt) this month and is now expected to fall year-on-year. The IGC’s forecast for the US maize crop has been cut by 50 mt, to 300 mt and the soyabean harvest has been reduced by 8.3 mt to 79 mt. Wheat output has also been revised lower in both Kazakhstan and Russia.
Maize (corn) and soyabean prices have soared to new highs on deteriorating output prospects in the US following the worst drought since 1956. Unfavourable weather conditions have also led to a scaling back of grains output and exportable surpluses in the Black Sea region, supporting gains in wheat and barley values. Global carryover grains stocks are expected to fall by 29 mt by the end of 2012-13, led by a 15 mt drop in wheat and 14 mt fall in maize; maize stocks are forecast at a six-year low.
Agrimoney has said that the downgrade takes the council’s estimate for the US corn harvest well below the US Department of Agriculture’s own forecast, of 329.5m tonnes. The USDA, whose estimates are followed particularly closely by traders, also still foresees a small rise in world corn inventories. However, analysts have already started the countdown to the next USDA Wasde report, on August 10, when it will revise estimates for crops worldwide.
The IGC Grains and Oilseeds Index (GOI) reached an all-time high on 20 July, and, despite some recent easing, is still up 14% month-on-month (m/m). World soyabean production is expected to recover sharply in 2012-13, rising by some 9% year-on-year, although the forecast hinges on a strong rebound in output from South America where planting begins in the fourth quarter of 2012.
Rice output in 2012-13 is forecast up 1%, compared to 3% growth in the previous year, due to less rapid expansion in Asia, but consumption growth is also likely to be lower. In contrast to the steep weather-driven gains in grains and oilseeds markets, rice prices declined marginally, mainly on supply-side pressures in Thailand.
World agri estimates 2012 February – 692 mt of wheat, 462 mt of rice
The World Agricultural Supply and Demand Estimates (WASDE) for 2012 February have been released by the United States Department of Agriculture (USDA, through its Economic Research Service of the Foreign Agricultural Service).
Here are the important numbers: total wheat production 692.88 mt, total wheat exports 140.25 mt (of which 26.54 mt is US, the former Soviet Union countries (12) is 35.21 mt); total coarse grains production 1,142.19 mt (coarse grains include corn, sorghum, barley, oats, rye, millet, and mixed grains), total coarse grains exports is 119.81 mt; total world corn production is 864.11 mt; total world rice production is 462.75 mt.

Families queue for food at a feeding point in BadBado IDP camp in Mogadishu, Somalia. Photo: IRIN / Kate Holt
Here is what WASDE has said about global wheat, coarse grains and rice:
Wheat – Global wheat supplies for 2011-12 are projected 2.1 million tons higher with larger beginning stocks in Kazakhstan and increased production for India, Kazakhstan, and Morocco. Kazakhstan beginning stocks are raised 0.6 million tons with reduced domestic consumption for 2010-11. India production for 2011-12 is increased 0.9 million tons reflecting the latest government revisions, which increased yields for the crop that was harvested last spring. Kazakhstan production is raised 0.2 million tons based on the recent official estimate. Production for Morocco is raised 0.2 million tons also on official revisions to estimated yields in a crop that was harvested several months ago.
Global trade is raised slightly for 2011-12 with world imports increased 0.7 million tons. Small increases in imports are made for Saudi Arabia, Mexico, Chile, and Ethiopia. Export reductions for Ukraine, Canada, and India are more than offset by increases for Russia, the United States, Argentina, and Brazil. Global wheat consumption is reduced 1.0 million tons mostly reflecting a 1.6-million-ton reduction in India food use. Partly offsetting are small increases in food use for Australia, Chile, Ethiopia, and Kazakhstan. Global wheat feeding is nearly unchanged with a 1.0-million-ton reduction for Kazakhstan offset by increases for Ukraine, Saudi Arabia, Canada, and Mexico. Global ending stocks for 2011-12 are raised 3.1 million tons to a record 213.1 million. As projected, 2011-12 global wheat stocks would be 2.4 million tons higher than the previous record in 1999-2000.

A woman peels cassava in a village close to the northern Zambian town of Mpulungu. Photo: IRIN / Guy Oliver
Coarse grain – Global coarse grain supplies for 2011-12 are projected 3.1 million tons lower mostly reflecting reduced corn production prospects in Argentina and, to a lesser extent, Paraguay. Argentina corn production is lowered 4.0 million tons to 22 million as field reports confirm that high temperatures and extensive dryness during pollination in late December and early January resulted in irreversible damage to early corn in the central growing region. Late planted corn, which has been on the increase in recent years, will help offset some of the earlier losses, but additional rainfall is needed to stabilize production prospects. Corn production is lowered 0.4 million tons for adjacent Paraguay where hot, dry weather also reduced area and yields. Partly offsetting are small corn production increases for EU-27 and the Philippines. Global barley production is raised with Argentina production up 0.7 million tons on higher reported area and yields for the crop that was harvested during late 2011.
[You can get the data file here, and the pdf report here.]
Global coarse grain trade for 2011-12 is raised with higher corn imports for EU-27 and higher barley imports for Saudi Arabia, EU-27, and Jordan. Partly offsetting is a reduction in corn imports for Canada. Higher corn exports for a number of countries offset a 4.5-million-ton reduction for Argentina. Along with the projected increase for the United States, corn exports are raised 2.0 million tons for Ukraine, 0.5 million tons each for Brazil and EU-27, and 0.2 million tons for Russia. Barley exports are lowered 1.0 million tons for Ukraine, but raised 0.7 million tons for Russia, 0.5 million tons for Argentina, and 0.3 million tons each for Canada, EU-27, and Kazakhstan.
Global coarse grain consumption for 2011-12 is raised slightly with higher barley feeding in Ukraine and Jordan and higher corn feeding in Argentina and Ukraine. Corn feeding, however, is lowered for Canada and barley feeding is lowered for Kazakhstan and Saudi Arabia. Saudi Arabia is expected to rebuild stocks as world barley production has rebounded from a 40-year low in 2010-11. Global coarse grain ending stocks for 2011-12 are lowered, with a 2.8-million-ton reduction in corn stocks and a 0.6-million-ton reduction in barley stocks. At the projected 125.4 million tons, global corn ending stocks would be the lowest since 2006-07.

A woman tends to her goods while at a morning market in Kathmandu. Agriculture accounts for about 75 percent of the nation's workforce. Photo: IRIN / David Longstreath
pic
Rice – Global 2011-12 projections of rice production, consumption, trade and ending stocks are raised from last month. The increase in the global rice production forecast is due mostly to increases for India and the Philippines, which are partially offset by reductions for Brazil, Egypt, Argentina, and the United States. The U.S. rice crop (milled equivalent basis) is lowered slightly resulting entirely from the decrease in the average milling yield. India’s rice crop is forecast at a record 102 million tons, up 2 million from last month due to an increase in both harvested area and yield. According to the U.S. agricultural counselor in New Delhi, favorable 2011 monsoon rains coupled with overall good weather conditions in the major rice producing areas supported higher kharif rice acreage and productivity.
The Brazil rice crop is lowered 340,000 tons due to the effects of drought in Rio Grande do Sul, an important rice producing State. Global exports are raised by 1.4 million tons, primarily due to an increase for India and Egypt, which are partially offset by reductions for Thailand, Vietnam, and the United States. Forecast India exports are raised 2 million tons to a record 6.5 million tons, while exports for Thailand and Vietnam are lowered 500,000 and 200,000 tons, respectively. Forecast imports are sharply raised for Egypt based on information from the agricultural counselor in Cairo. Global ending stocks are up slightly from last month to 100.1 million tons mainly due to an increase for the Philippines.
Climate change in the USA and the new plant growers’ map
 The US government’s map of planting zones, usually seen on the back of seed packets, has changed. An update of the official guide for gardeners reflects a new reality, that of climate change and shifting meteorological zones. Some plants and trees that once seemed too vulnerable to cold can now survive farther north than they used to.
As this report on Yahoo News pointed out, it’s the first time since 1990 that the US Department of Agriculture (USDA) has updated the map and much has changed. Nearly entire states, such as Ohio, Nebraska and Texas, are in warmer zones. The new guide, unveiled this week, also uses better weather data and offers more interactive technology. For the first time it takes into factors such as how cities are hotter than suburbs and rural areas, nearby large bodies of water, prevailing winds, and the slope of land.
 The 2012 USDA Plant Hardiness Zone Map is the standard by which gardeners and growers can determine which plants are most likely to thrive at a location. The map is based on the average annual minimum winter temperature, divided into 10-degree F zones. For the first time, the map is available as an interactive GIS-based map, for which a broadband Internet connection is recommended, and as static images for those with slower Internet access. Users may also simply type in a ZIP Code and find the hardiness zone for that area.
The 26 zones, however, are based on five degree increments. In the old 1990 map, the USDA mentions 34 different US cities on its key. Eighteen of those, including Honolulu, St. Louis, Des Moines, St. Paul and Fairbanks, are in newer warmer zones. Agriculture officials said they didn’t examine the map to see how much of the map has changed for the hotter. However, the Yahoo News report said Mark Kaplan, the New York meteorologist who co-created the 1990 map and a 2003 update that the USDA didn’t use, said the latest version clearly shows warmer zones migrating north. [See the USDA Plant Hardiness Zone Map here, with zip code form, interactive mapping and downloads.]
Hardiness zones are based on the average annual extreme minimum temperature during a 30-year period in the past, not the lowest temperature that has ever occurred in the past or might occur in the future.
 The USDA has said gardeners should keep that in mind when selecting plants, especially if they choose to “push” their hardiness zone by growing plants not rated for their zone. In addition, although this edition of the USDA PHZM is drawn in the most detailed scale to date, there might still be microclimates that are too small to show up on the map.
Microclimates, which are fine-scale climate variations, can be small heat islands – such as those caused by blacktop and concrete – or cool spots caused by small hills and valleys. Individual gardens also may have very localised microclimates (your entire yard could be somewhat warmer or cooler than the surrounding area, the USDA explained, because it is sheltered or exposed).
The 1990 map was based on temperatures from 1974 to 1986; the new map from 1976 to 2005. The nation’s average temperature from 1976 to 2005 was two-thirds of a degree warmer than for the old time period, according to statistics at the National Climatic Data Center. So far, according to the reports on the new zones map, the USDA is not actively associating its map with the effects of climate change on the USA.
 Many species of plants gradually acquire cold hardiness in the fall when they experience shorter days and cooler temperatures. This hardiness is normally lost gradually in late winter as temperatures warm and days become longer. A bout of extremely cold weather early in the fall may injure plants even though the temperatures may not reach the average lowest temperature for your zone. Similarly, exceptionally warm weather in midwinter followed by a sharp change to seasonably cold weather may cause injury to plants as well. Such factors are not taken into account in the USDA PHZM.
David W. Wolfe, professor of plant and soil ecology in Cornell University’s Department of Horticulture said the USDA is being too cautious and has disagreed about the Agency ignoring the climate change connection. “At a time when the ‘normal’ climate has become a moving target, this revision of the hardiness zone map gives us a clear picture of the ‘new normal,’ and will be an essential tool for gardeners, farmers, and natural resource managers as they begin to cope with rapid climate change,” Wolfe has said.
Still, the USDA has emphasised that all PHZMs are guides. They are based on the average lowest temperatures, not the lowest ever. Growing plants at the extreme of the coldest zone where they are adapted means that they could experience a year with a rare, extreme cold snap that lasts just a day or two, and plants that have thrived happily for several years could be lost. Gardeners need to keep that in mind and understand that past weather records cannot be a guarantee for future variation in weather.
Agricultural supply and demand estimates show impact of US heatwave
The heatwave of mid-2011 is reflected in the latest World Agricultural Demand and Supply Estimates (WASDE), from the US Department of Agriculture, for 2011 September. The numbers and the accompanying commentary show just how badly this year’s scorching temperatures and insufficient rainfall has affected the outlook for corn, soybeans and cotton, as Worldcrops has observed.
Worldcrops has said that the most serious supply-demand tightness of these three agricommodities will be felt in corn, with a stocks-to-use ratio by the end of August 2012 now put at 5.3%. The national average yield in the US is forecast to be 148.1 bushels/acre, 4.9 bushels less than last month’s report and a massive 16.6 bushels below the record set in 2009-2010. Nevertheless this would still be the third biggest crop ever.
 The USDA has slashed projected corn use for 2011-2012 by 100 million bushels – but only cut expected corn-for-ethanol usage by a meagre 50 million bushels. By August next year the US ending stocks will be, according to the report, 672 million bushels. That’s a drop in the bucket and by rights – and barring a global macroeconomic disaster – we ought to see $8/bushel corn futures sooner rather than later. Not least because the later the corn matures in the ground, the greater the risk of early frost damage.
We turn to the WASDE 2011 September commentary direct:
Wheat – Global wheat supplies for 2011-12 are projected 7.6 million tons higher mostly on larger beginning stocks in Canada and increased production for Canada, EU-27, and Ukraine. Beginning stocks for Canada are raised 1.3 million tons and production is raised 2.5 million tons, both reflecting the latest estimates from Statistics Canada. EU-27 production is raised 2.3 million tons with increases for Germany, Romania, France, Spain, and Bulgaria as harvest reports and revisions to official estimates continue to indicate higher yields. Production for Ukraine is raised 1.0 million tons based on the latest harvest reports. Other smaller production changes include 0.2-million-ton increases for both Brazil and Morocco, and a 0.2-million-ton reduction for Uzbekistan.
World wheat trade is raised slightly for 2011-12 with increased imports projected for the United States and Uzbekistan. Global exports are also raised as higher expected shipments from Canada and EU-27 more than offset reductions for the United States and Turkey. Global wheat consumption is increased 1.9 million tons with higher expected wheat feeding in Canada, China, Morocco, and Turkey more than offsetting a reduction for Russia. World wheat ending stocks for 2011-12 are projected 5.7 million tons higher at 194.6 million. At this level, global stocks would be up from 2010-11 and the second largest in the past decade.
Conversion Factors
1 metric ton = 45.9296 bushels
1 metric ton = 19.68 cwt
1 cwt is a hundredweight of 112 pounds or 45.35 kilogram
Coarse grain – U.S. feed grain supplies for 2011-12 are projected lower this month with reduced corn production as summer heat and dryness continue to be reflected in survey-based yield forecasts. Corn production for 2011-12 is forecast 417 million bushels lower with expected yields down from last month across most of the Corn Belt. The national average corn yield is forecast at 148.1 bushels per acre, down 4.9 bushels from August and 16.6 bushels below the 2009-10 record. As forecast, this year’s yield would be the lowest since 2005-06. Despite the lower yield, production is forecast to be the third highest ever with the second highest planted area since 1944. Total corn supplies for 2011-12 are lowered 442 million bushels with a 20-million-bushel reduction in carryin and a 5-million-bushel reduction in expected imports. Beginning stocks for 2011-12 drop with small increases in 2010-11 exports and use for sweeteners reflecting the latest available data. lmports for 2011-12 are reduced with the smaller forecast corn crop in Canada. Supplies for 2011-12 are projected to be the lowest since 2006-07.

USDA corn stocks-to-use ratio. Graphic: Worldcrops
Total corn use for 2011-12 is projected 400 million bushels lower with tighter supplies. Projected feed and residual use is reduced 200 million bushels mostly reflecting lower expected residual disappearance with the smaller forecast crop. Corn use for ethanol is projected 100 million bushels lower with higher expected corn prices and continued weakening in the outlook for U.S. gasoline consumption as forecast by the Energy Information Administration. Corn exports for 2011-12 are projected 100 million bushels lower with increased supplies and exports expected from Ukraine, Argentina, and Brazil. U.S. ending stocks are projected 42 million bushels lower at 672 million. The stocks-to-use ratio is projected at 5.3 percent, compared with last month’s projection of 5.4 percent. The season-average farm price is projected 30 cents per bushel higher on both ends of the range to a record $6.50 to $7.50 per bushel.
Global coarse grain supplies for 2011-12 are projected 3.1 million tons lower with larger barley, sorghum, millet, and oats supplies only partly offsetting the reduction for corn driven by the U.S. changes. Global corn supplies are reduced 4.5 million tons as increases in foreign beginning stocks and production partly offset the reduction in U.S. supplies. Projected global corn production for 2011-12 is lowered 5.9 million tons as a 4.8-million-ton increase in expected foreign output is outweighed by the 10.6-million-ton U.S. reduction. Brazil and Argentina production for 2011-12 are raised 4.0 million tons and 1.5 million tons, respectively, on higher expected area with rising returns for corn in both countries. Ukraine corn production is raised 1.5 million tons based on indications for higher yields. Production is raised 1.0 million tons for EU-27 with higher expected yields in France and several countries in Eastern Europe. Production is lowered 1.0 million tons for Canada based on the latest Statistics Canada estimates. Production is also lowered 2.1 million tons for Egypt as lack of government restrictions on planting resulted in a sharp shift in acreage away from corn and into rice.
Global coarse grain trade for 2011-12 is raised slightly with increased foreign trade in barley and corn more than offsetting the reduction in U.S. corn shipments. Barley imports are raised for Saudi Arabia and Syria with larger shipments expected from Ukraine and Russia. Corn exports are raised for Ukraine, Argentina, Brazil, and EU-27. Corn exports are lowered for Canada and Paraguay. Global corn consumption for 2011-12 is lowered 7.3 million tons, mostly reflecting lower expected use in the United States. Foreign corn feeding and consumption are nearly unchanged. World corn ending stocks are projected up 2.9 million tons with increases in South America, Ukraine, and EU-27 more than offsetting the reduction projected for the United States.
Rice – All rice beginning stocks for 2011-12 are lowered 2.7 million cwt from last month to 48.4 million (rough-equivalent basis) based on USDA’s Rice Stocks report released on August 26. The import projection is raised 1.0 million cwt to 19.0 million as it is expected that more long-grain rice will be imported due to tighter domestic supplies.
Exports for 2011-12 are projected at 93.0 million cwt, down 4.0 million cwt from last month, and down 18.6 million from the revised 2010-11 estimate. Long-grain exports are lowered 5.0 million cwt from last month to 61.0 million, and combined medium- and short-grain exports are raised 1.0 million to 32.0 million. The decrease in the export projection is due mostly to a much tighter supply situation, but additionally to an expected increase in competition from South American exporters in Western Hemisphere long-grain markets. Long-grain exports to Iraq are also expected to be lower. Increased competition principally from Egypt is expected to reduce medium-grain exports to Libya. All rice ending stocks for 2011-12 are projected at 38.3 million cwt, up 5.1 million from last month, but down 10.1 million from the revised 2010-11 stocks.
Projected global 2011-12 rice supply and use are increased from last month. Global rice production is projected at a record 458.4 million tons, up 2.1 million tons from last month, primarily due to larger expected crops in Brazil, China, the Philippines, and the United States. China’s 2011-12 rice crop is increased 1.0 million tons to 139.0 million, due mainly to an increase in the early rice crop. Brazil’s rice crop is raised nearly a million tons due to both an increase in area and expected yield. The recent surge in global prices accounts for the increase in planted area in Brazil from last month’s forecast. Global 2011-12 trade is nearly unchanged from last month. Global consumption is raised 0.7 million tons from a month ago due mostly to China. Global ending stocks for 2011-12 are projected at 98.7 million tons, up 0.7 million from last month, and the largest stocks since 2002-03. Stocks are raised for Brazil, China, the Philippines, and the United States.
Worldcrops has said that for soybeans. Ending stocks by end-August 2012 are put at 165 million bushels, 29 million higher than the August report but still tight. The US will have a reduced capacity to export soybeans and the futures price in our opinion will climb inexorably to $15/bushel and go significantly higher, if the weather outlook for the all-important South American soybean crop is unfavourable later this year. All in all this report has nothing which will astonish the markets immediately but lays the foundation for a significant bull-run in corn and, to a lesser extent, soybean futures in the coming months.
