Posts Tagged ‘cereal’
The weekly intelligencer

Indices, prices, data series, readings and jottings of note over the last week, fortnight and month, compiled for the week beginning 6 August 2017.
Quick Estimates of Index of Industrial Production (IIP) with base 2011-12 for the month of May 2017, released by the Ministry of Statistics and Programme Implementation, Central Statistics Office. The General Index for the month of May 2017 stands at 124.3, which is 1.7% higher as compared to the level in the month of May 2016.
India Meteorological Department, Hydromet Division. Until 2 August 2017, 67% of the districts have recorded cumulative rainfall of normal, excess or large excess and 33% of the districts have recorded cumulative rainfall of deficient or large deficient. This compares with 69% and 31% respectively at the same time last year.
Ministry Of Commerce and Industry, Office Of The Economic Adviser. The official Wholesale Price Index for All Commodities (Base: 2011-12=100) for the month of June 2017 declined by 0.1% to 112.7 (provisional) from 112.8 (provisional) for the previous month.
Ministry of Water Resources, Central Water Commission. As on 3 August 2017 the total live storage capacity of the 91 major reservoirs is 157.799 billion cubic metres (BCM) which is about 62% of the total estimated live storage capacity of 253.388 BCM. As per reservoir storage bulletin dated 03 August 2017, live storage available in these reservoirs is 67.683 BCM, which is 43% of total water storage capacity of these reservoirs. Last year the live storage in these reservoirs for the corresponding period was 65.109 BCM and the average of last 10 years was 69.510 BCM.
Reserve Bank Of India Bulletin, Weekly Statistical Supplement. 4 August 2017. Aggregate deposits Rs 106,254 billion. Bank credit Rs 76.888 billion. Money stock: Rs 14,689 billion currency with the public, Rs 101,600 billion time deposits with banks.
Ministry of Agriculture. The total sown area as on 4 August 2017 stands at 878.23 lakh hectare as compared to 855.85 lakh hectare at this time last year. Rice has been sown/transplanted in 280.03 lakh hectare, pulses in 121.28 lakh hectare, coarse cereals in 156.95 lakh hectare, oilseeds in 148.88 lakh hectare, sugarcane in 49.71 lakh hectare and cotton in 114.34 lakh hectare.
Ministry of Consumer Affairs, Food and Public Distribution, Price Monitoring Cell in the Department of Consumer Affairs. Maximum prices recorded (per kilo and per litre) amongst the set of 100 cities monitored during the week of 23-29 July: Rice 52, Wheat 45, Atta (Wheat) 50, Gram Dal 132, Tur/ Arhar Dal 132, Urad Dal 150, Moong Dal 140, Masoor Dal 110, Sugar 52, Milk 65, Groundnut Oil 180, Mustard Oil 170, Vanaspati 120, Soya Oil 110, Sunflower Oil 130, Palm Oil 110, Gur 68, Tea Loose 360, Salt Pack (Iodised) 22, Potato 35, Onion 45, Tomato 100.
How GM ‘science’ misled India

For the last decade, the reckoning of what agriculture is to India has been based on three kinds of measures. The one that has always taken precedence is the physical output. Whether or not in a crop year the country has produced about 100 million tonnes (mt) of rice, 90 mt of wheat, 40 mt of other cereals (labelled since the colonial era as ‘coarse’ although they are anything but, and these include ragi, jowar, bajra and maize), 20 mt of pulses, 30 mt of oilseeds, and that mountain of biomass we call sugarcane, about 350 mt, therewith about 35 million bales of cotton, and about 12 million bales of jute and mesta.
The second measure is that of the macro-economic interpretation of these enormous aggregates. This is described in terms of gross value added in the agriculture (and allied) sector, the contribution of this sector to the country’s gross domestic product, gross capital formation in the sector, the budgetary outlays and expenditures both central and state for the sector, public and private investment in the sector. These drab equations are of no use whatsoever to the kisans of our country but are the only dialect that the financial, business, trading and commodity industries take primary note of, both in India and outside, and so these ratios are scrutinised at the start and end of every sowing season for every major crop.
The third measure has to do mostly with the materials, which when applied by cultivating households (156 million rural households, of which 90 million are considered to be agricultural only) to the 138 million farm holdings that they till and nurture, maintains the second measure and delivers the first. This third measure consists of labour and loans, the costs and prices of what are called ‘inputs’ by which is meant commercial seed, fertiliser, pesticide, fuel, the use of machinery, and labour. It also includes the credit advanced to the farming households, the alacrity and good use to which this credit is put, insurance, and the myriad fees and payments that accompany the transformation of a kisan’s crop to assessed and assayed produce in a mandi.
 It is the distilling of these three kinds of measures into what is now well known as ‘food security’ that has occupied central planners and with them the Ministries of Agriculture, Rural Development, Food and Consumer Affairs (which runs the public distribution system), and Food Processing Industries. More recently, two new concerns have emerged. One is called ‘nutritional security’ and while it evokes in the consumer the idea which three generations ago was known as ‘the balanced diet’, has grave implications on the manner in which food crops are treated. The other is climate change and how it threatens to affect the average yields of our major food crops, pushing them down and bearing the potential to turn the fertile river valley of today into a barren tract tomorrow.
These two new concerns, when added to the ever-present consideration about whether India has enough foodgrain to feed our 257 million (in 2017) households, are today exploited to give currency to the technological school of industrial agriculture and its most menacing method: genetically modified (GM) or engineered seed and crop. The proprietors of this method are foreign, overwhelmingly from USA and western Europe and the western bio-technology (or ‘synbio’, as it is now being called, a truncation of synthetic biology, which includes not only GM and GE but also the far more sinister gene editing and gene ‘drives’) network is held in place by the biggest seed- and biotech conglomerates, supported by research laboratories (both academic and private) that are amply funded through their governments, attended to by a constellation of high-technology equipment suppliers, endorsed by intergovernmental groupings such as the UN Food and Agriculture Organisation (FAO) and the Consultative Group on International Agricultural Research (CGIAR), taken in partnership by the world’s largest commodities trading firms and grain dealers (and their associates in the commodities trading exchanges), and amplified by quasi-professional voices booming from hundreds of trade and news media outlets.
This huge and deep network generates scientific and faux-scientific material in lorry-loads, all of it being designed to bolster the claims of the GM seed and crop corporations and flood the academic journals (far too many of which are directly supported by or entirely compromised to the biotech MNCs) with ‘peer-reviewed evidence’. When the ‘science’ cudgel is wielded by the MNCs through their negotiators in New Delhi and state capitals, a twin cudgel is raised by the MNC’s host country: that of trade, trade tariffs, trade sanctions and trade barriers. This we have witnessed every time that India and the group of ‘developing nations’ attends a council, working group, or dispute settlement meeting of the World Trade Organisation (WTO). The scientific veneer is sophisticated and well broadcast to the public (and to our industry), but the threats are medieval in manner and are scarcely reported.
[This is the first part of an article that was published by Swadeshi Patrika, the monthly journal of the Swadeshi Jagran Manch. Part two is here.]
Masses of cotton but mere scraps of vegetables

The sizes of the coloured crop rectangles are relative to each other based on thousand hectare measures. The four pie charts describe the distribution of the main crops amongst the main farm sizes.
For a cultivating household, do the profits – if there are any – from the sale of a commercial crop both enable the household to buy food to fit a well-balanced vegetarian diet, and have enough left over to bear the costs of its commercial crop, apart from saving? Is this possible for smallholder and marginal kisans? Are there districts and talukas in which crop cultivation choices are made by first considering household, panchayat and taluka food needs?
Considering the district of Yavatmal, in the cotton-growing region of Maharashtra, helps point to the answers for some of these questions. Yavatmal has 838,000 hectares of cultivated land distributed over 378,000 holdings and of this total cultivable area, the 2010-11 Agriculture Census showed that 787,000 hectares were sown with crops.
Small holdings, between 1 and 2 hectares, account for the largest number of farm holdings and this category also has the most cultivated area: 260,000 hectares. Next is farms of 2 to 3 hectares which occupy 178,000 hectares, followed by those of 3 to 4 hectares which occupy 92,000 hectares.
The district’s kisans allocate their cultivable land to food and non-food crops both, with cereals and pulses being the most common food crops, and cotton (fibre crop) and oilseeds being the non-food (or commercial) crops.
How do they make their crop choices? From the agriculture census data, a few matters immediately stand out, which are illustrated by the graphic provided. First, a unit of land is sown 1.5 times in the district or, put another way, is sown with one-and-a-half crops. This means crop rotation during the agricultural year (July to June) is practiced but – with Yavatmal being in the hot semi-arid agri-ecoregion of the Deccan plateau with moderately deep black soil – water is scarce and drought-like conditions constrain rotation.
Second, land given to the cultivation of non-food crops is 1.6 times the area of land given to the cultivation of food crops (including the crop rotation factor), a ratio that is made abundantly clear by the graphic. This tells us that the food required by the district’s households (about 647,000 of which about 516,000 are rural) cannot be supplied by Yavatmal’s own kisans.
The vegetables required by the populations of Yavatmal’s 16 talukas (Ner, Babulgaon, Kalamb, Yavatmal, Darwha, Digras, Pusad, Umarkhed, Mahagaon, Arni, Ghatanji, Kelapur, Ralegaon, Maregaon, Zari-Jamani, Wani) can in no way be supplied by the surprisingly tiny acreage of land allocated to their cultivation. Nor do they fare better for fruit, which has even less land (although this is a more complex calculation for fruit trees, less so for vine fruits).
Third, 125,000 hectares to wheat and 71,000 hectares to jowar makes up almost the entire cereals cultivation. Likewise 126,000 hectares to tur (or arhar) and 94,000 hectares to gram accounts for most of the land allocated to pulses. Thus while Yavatmal’s talukas are well supplied with wheat, jowar, gram and tur dal, its households must depend on neighbouring (or not so neighbouring) districts for vegetables, as a minimum of 280,000 tons per year is to be supplied to meet each household’s recommended dietary needs.
What the graphic helps us ask is the size of the costs associated with crop cultivation choices in Yavatmal. The cultivation of hybrid cotton in India’s major cotton growing regions (several districts each in Maharashtra, Andhra Pradesh and Gujarat) is associated with heavy chemical fertiliser and pesticides use. Whether the soil on which cotton has grown can be sown again with a food crop is not clear from the available data but if so such a crop would be saturated with a vicious mix of chemicals that include nitrates and phosphates.
The health of the soil in Yavatmal’s 16 talukas is probably amongst the most fragile in Deccan Maharashtra, and after years of coaxing a false ‘productivity’ out of the ground for cotton, it would be best for the district’s 516,000 rural households to take a cotton ‘holiday’ for three to four years and revert to the mixed and integrated cropping of their forefathers (small millets). But the grip of the financiers and the textiles intermediaries is strong.
How our kisans bested drought to give 252.2 mt
 Bharat has maintained a level of foodgrains production that is above 250 million tons for the year 2015-16. This is the most important signal from the Fourth Advance Estimates of agricultural production, which have just been released by the Ministry of Agriculture. The ‘advance estimates’, four in the agricultural year, mark the progression from target production for the year to actual output.
For this rapid overview I have compared the 2015-16 fourth estimates, which will with minor adjustments become the final tally, with two other kinds of production figures. One is the five-year average until 2014-15 and the second is the ten-year average until 2014-15. While a yearwise comparison is often used to show the variation in produced crops (which are affected by price changes, policies, adequacy of the monsoon and climatic conditions), it is important to compare a current year’s nearly final crop production estimate with longer term averages. Doing so allows us to dampen the effects of variations in individual years and so gauge the performance in the current year against a wider recent historical pattern.
In this way we see that for all foodgrains (rice, wheat, coarse cereals and pulses) the production for 2015-16 is about three million tons below the five-year average but about 13.5 million tons above the ten-year average. These two comparisons need to be considered against the growing conditions our kisans dealt with during 2015 and 2014, both of which were drought years. They also need to be viewed against economic and demographic conditions, which have led to migration of agriculturalists and cultivators from villages into urban settlements (hence less available hands in the field), and the incremental degradation of agro-ecological growing regions (because of both urban settlements that grow and because of increased industrialisation, and therefore industrial pollution and the contamination of soil and water).
That the total quantity of foodgrains is adequate however has been due to the production of rice and wheat (चावल, गेंहूँ) both being above the five and ten year averages. There is undoubtedly regional variation in production (the February to May months in 2016 were marked by exceedingly hot weather in several growing regions, with difficult conditions made worse by water shortages). There is likewise the effects of more transparent procurement policies and stronger commitments being followed by state governments to adhere to or better the recommendations on minimum support prices. The host of contributing factors require inquiry and study.
What requires more urgent attention are the production figures for coarse cereals and pulses. Coarse cereals (which includes jowar, bajra, maize, ragi, small millets and barley – ज्वार, बाजरा, मक्का, रागी, छोटे अनाज, जौ) at just under 40 million tons is 4.4 million tons under the five-year average and 1.4 million tons under the ten-year average. Likewise pulses (which includes tur or arhar, gram, urad, moong, other kharif and other rabi pulses – अरहर, चना, उरद, मूँग, अन्य खरीफ दालें, अन्य रबी दालें) is 1.6 million tons under the five-year average and only 0.3 million tons above the ten-year average. The low total production of these crop types, coarse cereals and pulses, have continued to be a challenge for over a generation. The surprisingly good outputs of wheat (9.3 mt above the ten-year average) and rice (5.5 mt above the ten-year average) should not be allowed to obscure the persistent problems signalled by the outputs of coarse cereals and pulses.
Regions of wheat, lands of rice

The return of budgetary focus towards agriculture and the economies of rural India will help deepen our understanding about where crops are grown and for whom. These are still more often described in national aggregate terms of annual estimates, than by season, state and the growing appetites of urban agglomerations.
This could change over the next few years, especially as the so-called services sector shrinks both by the number of people it employs and by its importance to the national economy. Services – a peculiarly invented term that was quite unknown and unused when I was a teenager – has come about because of the financialisation of those portions of social activity which were done at small scale, informally and as adjunct activities to the work of the public sector, the manufacturers and factories, and the great numbers of cultivators (and those working on agricultural produce). The many enforced errors of contemporary economics means that this will continue to change – not without pain and confusion – but that social activity that has some economic dimension will return to what it was two generations earlier.
While it does, we find there are differences in the concentration of food staples produced – that is, how much by quantity do certain regions grow our food staples as a significant fraction of national production of that food staple. This is more readily available as state quantities instead of district. I have suggested to the Ministry of Agriculture that this ought to be monitored not only at the level of the district but also by the agro-ecological zone, or region, for we have 120 in India, and they represent varying climatic conditions, soil typologies, river basins and cultivation systems.
At present, what we see then is that for rice and wheat, the top three producing states account for 36.7% (rice) and 62% (wheat) of the country’s production. This distribution – or concentration – should cause a review of the crop choices that our kisans make in the growing districts and agro-ecological zones. For a simple pointer such as this tells us that 37 out of every 100 quintals of rice grown in India are grown in West Bengal, Uttar Pradesh and Andhra Pradesh and that 62 out of every 100 quintals of wheat grown in India are grown in Uttar Pradesh, Punjab and Madhya Pradesh.
The corresponding distribution/concentration with coarse cereals is better than wheat but not better than rice for 45.4% of total coarse cereals are grown in Rajasthan, Karnataka and Andhra Pradesh. Likewise, 48.8% of all pulses are grown in Madhya Pradesh, Rajasthan and Maharashtra. The tale is similar with oilseeds (63.8% in Madhya Pradesh, Rajasthan and Gujarat), with sugarcane (73% in Uttar Pradesh, Maharashtra and Karnataka) and cotton (69.8% in Gujarat, Maharashtra and Andhra Pradesh).
With horticulture – that is, vegetables and fruit – there is less state-level concentration to be seen. India’s kisans grow about 170 million tons of vegetables and about 85 million tons of fruit a year and their concentrations vary – West Bengal and Odisha grow a great deal of brinjal, Maharashtra grows onions, Uttar Pradesh and West Bengal lead in potatoes, Madhya Pradesh and Karnataka grow the most tomatoes, and so on. Overall however, the range of distribution amongst the large states of their produce of vegetables and fruit is not as concentrated as with the food staples. The reasons for this difference can tell us a great deal about the need for district and watershed-level food security, employing as always sound zero budget farming techniques (no external inputs) and local and indigenous knowledge of cultivation techniques.
Why India must rely on local food stocks

The below average June to September monsoon season will lead to lower foodgrains production. What is the likely impact and how can society cope?
Context – For the last four years the numbers that describe India’s essential food security have become a common code: 105 million tons (mt) of rice, 95 mt of wheat, 41 to 43 mt of coarse cereals, 19 to 20 mt of pulses, 165 to 170 mt of vegetables and 80 to 90 mt of fruit.
With these quantities assured, our households feed themselves, army and factory canteens are supplied, the public distribution system is kept stocked and the processed and retail food industry secures its raw material.
Only provided there is such assurance, and that the allowance for plus or minus is as small as possible. Monsoon 2015 has removed that assurance for the agricultural year 2015-16. Our 36 states and union territories – and the 63 cities whose populations are more than a million – must begin to deal with the possible scenarios immediately.
Stock scenarios – In September 2015 the Department of Agriculture, Cooperation and Farmers Welfare, of the Ministry of Agriculture, Government of India, released the first of its usual four ‘advance estimates’ for the 2015-16 agricultural year. Each estimate sets the targets for the year for the foodgrain (and also commercial) crops, and provides with every estimate how likely it is that the annual target will be met.
This first advance estimate has issued a direct warning: rice production is estimated at 90.6 mt against a target of 106.1 mt. The wheat target is just under 95 mt but there is no estimate provided as yet. The target for coarse cereals is 43.2 mt whereas the advance estimate is just under 28 mt. The target for pulses is 20mt and the first estimate is 5.5mt.
What are the implications? The responsibility of the Department is to provide a provisional reading of the conditions that affect the production of our staple crops, and to inform and prepare state and central governments of the likelihood of shortfalls in foodgrain. The signal it has given for rice, estimated at 85% of the target, must be taken as a flashing red beacon which demands that our food stocks return to the foreground of the national agenda.
It is likely that the second and third advance estimates will see quantities revised upwards, but our planning must be based on this first estimate so that even the most adverse of natural contingencies can be met with suitable measures.
Using the first advance estimate as the basis, here are the likely annual production quantities, at 90% of the target and at 95% of the target: rice, between 95 and 101 mt; wheat, between 85 and 91 mt; coarse cereals, between 39 and 42 mt; pulses, between 16 and 17 mt; total foodgrains, between 236 and 250 mt of which cereals are between 220 and 232 mt.
 Household demand – Will these quantities suffice, as for the last four years total foodgrain targets and production have been in the region of 260-273 mt?
To help answer this question, two sets of deductions must be accounted for. To begin with, for each main category of foodgrain, there are production quantities, imports, stock variations and exports. When these are added or subtracted, a gross domestic supply quantity remains.
It is worth also noting that this gross quantity is still no more than a best assessment that is synthesised from the information provided by state governments. The first set of deductions is by way of feed, seed and waste (foodgrain that is used in animal feed, is harvested to use as seed for sowing, and which is damaged after harvest or rendered unusable because of pests and infection). Allowing for the lowest likely level of deductions, the combined deduction is about 7% for rice, 10.5% for wheat, 17% for coarse cereals, 15% for pulses, 5% for vegetables and 10% for fruits.
The available quantities are now revised further. Under a 95% of target scenario, we will have 93.5 mt of rice, 81 mt of wheat, 34.5 mt of coarse cereals and 14.5 mt of pulses. In the same way, a 95% of target scenario for vegetables is 153.5 mt and for fruits it is 72.5 mt. On the consumption side we have the households – in 2016 we will have 175 million rural and 83 million urban households.
These households will require a baseline minimum of 181 mt of cereals, 136 mt of vegetables, 45 mt of fruits and 41 mt of pulses. Under a 95% of production target scenario therefore, there will be enough cereals, enough vegetables and enough fruits. We have been falling short in pulses for several years.
But this apparent comfort is still without the second set of deductions. And these are: (1) buffer stocks of rice and wheat to be maintained, with 5-8 mt of rice during the year and 10-18 mt of wheat during the year (to fulfil the demands on the public distribution system and to fulfil the allocations for the food-based welfare programmes), and in addition the strategic reserve of 2 mt of rice and 3 mt of wheat to be maintained; (2) the use of foodgrains by the food processing and retail food industry; (3) exports of primary crops (such as rice and in particular basmati) and processed crops (vegetables and fruits); (4) the industrial use of foodgrain (including for biodiesel); (5) the diversion of cereals to alcohol distilleries.
Some amongst the second set of deductions are known – such as the withdrawals for buffer stocks and the food reserves, and the export quantities – but the others are either hidden, concealed or misreported. In a food production scenario that is less than 95% of targets (in the way that rice has already been estimated for 2015-16), the deductions from gross crop production will decrease available foodgrains, vegetables and fruits to levels that will compromise household food security, especially those households in the lower income brackets.
Recommendations – The climate variations that have led the Department of Agriculture to raise a red flag warning are no longer uncommon. The 2015 monsoon was affected by El Nino conditions, which are expected to continue into the first quarter of 2016. These changes in the pattern of the Indian summer monsoon are amplified by land use change in our districts, by deforestation, by rapid urbanisation, by inequitous water use, and by consumption behaviour. Some of these can be addressed through policy, education and incentives over the long term. What is needed immediately however are:
a) A review of the drivers of crop cultivation choice in our watersheds and agro-ecological zones so that, as far as possible, these settlements units begin the transition towards local food security in sustainable ways. This means that the income-led arguments which favour the cultivation of commercial crops for farming households must be critically re-examined – in a situation of primary crop scarcity an income buffer alone will not help these households.
b) The demands placed by export arrangements (including the export of meat, which represents fodder and feed) and by the food processing and retail food industry must be quantified and made public. Especially at the level of district administrations, the need to rationally incentivise land use towards the cultivation of food crop staples that suit agro-ecological conditions has become an urgent one. The decentralisation of planning that can make such an approach possible can take place only when hitherto hidden and concealed foodgrains use becomes public.
c) To reach self-reliance at the level of panchayat or block (tahsil, taluka), cooperative farming must be vigorously encouraged, villages must become self-reliant in the provisioning of their food staples (a consideration that must balance that of the ‘national market’), the bio-physical limits of the major food producing districts (the top 250 by quantity) have already been reached and this necessarily limits the demand urban India can exert upon rural districts, in terms not only of food quantities but also in terms of the population that must be fully engaged in foodgrains cultivation.
Desperate food gambits and the danger to India
India’s Republic Day in 2015 will also see the visit of the president of the USA, Barack Obama, accompanied by the usual large delegation of business persons, lobbyists and functionaries of the American government. They will use this visit to demand many things, and amongst the demands will be that the NDA-BJP government ‘reform’ all that is hindering the agriculture and food transformation in Bharat.

A couple tending their stack of rice stalks residue in the Konkan.
We must resist this with strength and perseverance. So far, the NDA-BJP government has not shown that it recognises or understands the threats and dangers, which are very very serious indeed. The American delegation will push this government to clear the way for genetically modified seed and crop (including in food staples such as cereals), for the further industrialisation and mechanisation of crop production (which will mean the removal of smallholder ‘kisans’ from their plots, all in the name of market efficiency), and the deepening of the food processing and food retail industries’ grip on what we eat.
The Prime Minister’s Office, the Union Cabinet and the seniormost bureaucrats of the major ministries involved must wake up to this threat and be firm against it. The signals from elsewhere are many and they are clear about what lies in store for Bharat if the NDA-BJP government at the centre and if state governments do not discharge their duty – which is, safeguard the sovereignty of Bharat.
Already in Europe, the German Environment Ministry is insisting on a complete ban on green genetic engineering in Germany. Under a new European Parliament directive, member states of the European Union will now be able to restrict or completely ban GMO cultivation within their borders. One of the leading proponents of such a legal ban in Germany is its Ministry of Agriculture, which also supports a national ban on cultivation.
 Moreover, in a position paper from the Federal Ministry of the Environment, Minister Barbara Hendricks said she does not want to leave any back doors open for genetic engineering. The GMO law must be changed, so that controversial green genetic engineering cannot be used under any pretext in Germany, she stated in the document. “Green genetic engineering has turned out to be the wrong track,” Hendricks said. “It is risky for nature and the environment and is not desired by consumers.”
Worldwide, the project to fully industrialise global food production is far from complete, yet already it is responsible for most deforestation, most marine pollution, most coral reef destruction, much of greenhouse gas emissions, most habitat loss, most of the degradation of streams and rivers, most food insecurity, most immigration, most water depletion, and massive human health problems.

Relationships between soil, urbanisation, fertiliser use, farming, ecology and health. Images from the Soil Atlas, 2015, Heinrich Böll Stiftung.
Under GM- and tech-centric industrial agriculture and food systems – which is what the Americans will demand from us – countries are becoming literally uninhabitable as a result of the social and ecological consequences.
Wherever industrial and genetically engineered agriculture is found, landscapes are left progressively emptier of life. Eventually, the soil turns either into mud that washes into the rivers or into dust that blows away on the wind. Industrial agriculture has no long term future and is ecological suicide. But those who profit from it cannot allow all this to become broadly understood – and unfortunately that has included our NDA-BJP government. That is why they have continued to peddle the lie of food scarcity in India, which the previous Congress government employed so recklessly.
The agriculture and food problem – which will become a more extreme problem for us if the Obama group is given its way – is closely interlinked with growing demand for land. Land is a lucrative investment and has fuelled the real estate boom in India for the last decade. But for our smallholder kisans it is the source of livelihood, as it is for our shepherd groups and tribal communities. Rising demand for land also harms the ecosystem – as is seen in each and every one of the 63 cities whose populations this year are at least one million. The more intensive the farming, the more damage it does to the environment. This is the main reason for the decline in biological diversity, above and below the ground.
The American push will be for agri-food systems in accordance with the new international trade agreements. These are nothing but colonial ways of thinking – that food should be produced for international export as a tool of foreign policy and to control populations (especially through GM) and as a byproduct financially benefit powerful corporations that act as agents of such colonial ways of thinking. Thus it is a direct assault on people’s sovereignty over their natural resources, farming systems and food access as well as their human right to dignified living standards free of exploitation and dependence.
Such treaties (such as the TTP which is facing opposition even amongst those the USA calls allies) are dangerous because they are negotiated in secret. But what has emerged (thanks to leaks) is appalling. Some of the texts in these treaties wants the outright patenting of plants and animals, many draft agreements come with severe punishments for farmers who break intellectual property laws, they deliberately undermine local agriculture (as seen with NAFTA), commons lands are proposed for privatisation, labelling of GM foods will be prohibited, and the governments of countries that try to undo the damage will be liable to be sued by the multi-national corporations. This is the extent of the danger facing Bharat, which will become more clear come Republic Day 2015.
Visiting our total household food budget

Twice as much over the 11 years until 2009-10, and three times as much over the 10 years until 2012-13. That has been the increase in rupee expenditure for this basket of foods.
The data is from the private final consumption series, calculated by the Central Statistics Office (CSO) of the Ministry of Statistics and Programme Implementation (MoSPI). The totals (left scale of the chart) is in thousand crore rupees.
In this chart I have shown the expenditure (in current rupees) for: Cereals and Bread, Pulses, Sugar and Gur, Oils and Oilseeds, Fruits and Vegetables, Milk and Milk Products, and Meat Egg and Fish. These totals also indicate the size in rupees of the food industry – but do not include the processed and packaged food industry.
The rise in consumption expenditure expressed in rupees is a money measure alone, and not a quantity or volume measure. We can see that the portion of milk and milk products in this group has gone up from just over 18% to 25% over 14 years, and the portion of meat, eggs and fish has gone up from just under 9% to 12.5% over the same period.
From 2006 the rising trend of expenditure on fruits and vegetables became steeper than the rising trend of cereals and bread. In 2005-06 the portion spent on fruit and vegetables in this group was just over 26% and that has risen slightly to 28% in 2012-13. In contrast for cereals and bread, the portion of 27.5% in 2005-06 has dropped to just over 21% in 2012-13.
Why the FAO food index is also an oil gauge

The revealing relationship between the FAO cereals price sub-index, the OPEC Reference Basket price of a barrel of crude oil, and the Baltic Dry Index (right scale).
The Food and Agriculture Organisation (FAO) of the UN has released its food price index data and commentary for 2014 October. This would be of considerable interest if only the index described the tendencies of food prices as experienced by consumers. Alas FAO’s food price index, as we have remarked upon several times in the past, pays no attention to the true cost of food staples.
Of what use is the FAO index, which is used as a reference by any government (and UN member state) to judge the value of its food exports (or to judge whether when importing grain it is paying what seems to be a fair price)? In the first place, the index (which itself is composed of separately calculated cereal, vegetable oil, dairy, meat and sugar indices) is not a consumer food price index.

The FAO food price index and its component sub-indices for the period 2012 January to 2014 October. A general downward trend, says the FAO, but this is the picture for international food trade and not consumer food retail price.
The FAO has not claimed it is, but neither has the agency clearly and plainly said it is not. It should, because financial and general interest media all over the world report the ups and downs of this index as if it portrays how local food prices move, and of course it does not.
The FAO index is used by international traders whose business it is to buy and sell food staples (including cereal, vegetable oil, pulses, dairy, meat and sugar). Perhaps some of them use it as a benchmark while others forecast trends from its sub-indices. It may be used to validate the accuracy of a particular kind of agricultural commodity futures index, and help judge whether an investment in the production of food, its movement, its stocking or its trade is going to be a good investment or not. As you can gather, it is not an index that consumers can use, because consumers are local and this is assuredly not.
What pulls the FAO food price index up, down or sideways? There are two important factors at work on the main index. One is the price of petroleum products, the other is the cost of moving grain (or any other food staple). You may assess the short or long-term trend of the food index against the current or projected price of Brent crude (preferred in Europe), West Texas Intermediate (preferred in the USA) or the OPEC reference price (preferred almost everywhere else).

The FAO food price index and its component sub-indices for 2014 till October. The downward trend of the last six months, which the FAO commentary is faintly praising, mirrors the trend of crude oil prices over the same period.
And then you will assess what the food price index describes against the cost of moving a large quantity of the agricultural commodity to be traded across an ocean, for which the Baltic Dry Index will be consulted.
[If you are a trader and want the FAO food price data and movements, go here. The usual commentary can be found: “The FAO Food Price Index averaged 192.3 points in October 2014, marginally (0.2 percent) below the revised September figure but 14.3 points (6.9 percent) short of its corresponding level one year ago” and so on.]
To help determine what the FAO food price index is depicting, I have made charts for the index (and sub-indices) for the period 2012 January to 2014 October; for the index (and sub-indices) for 2014 till October; a chart that shows the FAO cereals sub-index together with the OPEC Reference Basket Price for a barrel of crude oil and the Baltic Dry Index (this is the shipping index most commonly referred to for the movement of dry goods by sea) for the period 2012 January to 2014 October; and a chart that plots the changes (from month to month) in the three indexes taken together (FAO Cereals, OPEC Reference and Baltic Dry).

The FAO food price index and the OPEC Reference Basket price of oil have much more in common than the Baltic Dry Index, which has swung with volatility since 2012 January.
What they describe can be found in the captions, but it becomes clear from a glance at the FAO-OPEC-Baltic charts that the food price as calculated by FAO has very much more to do with how energy is used to produce food staples (that is, the use of petroleum products directly, and the use of fossil fuels-derived energy) and how energy is used to transport, store, process, transport it again and retail it.
I see it as an index that describes the energy quotient of industrially produced food staples, and so it has little if anything to do with any other form of agriculture, in particular the smallholder, family-oriented and organic agriculture that the FAO advertises its concern about.
The hunger that Bharat inherited from two lean decades
What did the ‘liberalisation’ of the Indian economy bring? What has 20 years of the ‘India growth story’, which is sold around the world, brought its labour and workers? How have households rural and urban fared at balancing their budgets and meeting their needs? Poorly, for it has been a struggle that continues.
 An analysis in the journal of the National Sample Survey Office, Sarvekshana, has compiled estimates of average calorie intake for the country and the major states from six quinquennial (every five years) surveys of consumer expenditure. These surveys show a decline in average calorie intake between 1972-73 and 2009-10. The overall decline is substantially greater for rural than for urban India, and appears to have been sharper in the period since 1993-94 (as measured by the 50th round of NSSO surveys), especially in the urban sector.
The analysis on ‘Trends in Nutritional Intake in India’ has shown that the proportion of households with calorie intake below the level of 2700 kcal per consumer unit per day (this is a measure different from per capita) has grown steadily since 1993-94: from under 52% in rural India to nearly 62%, and from 57% in urban India to about 63%.
This is no surprise to the large proportion of our population who have borne the merciless brunt of food inflation for close to a generation. Between 2004 and 2013, food prices in general rose by 157%. Cereals, the staple diet of the poorest, were high on the scale, with rice at 137% and wheat at 117%. Pulses – the sole source of protein for most – had risen by 123%. Potato was even higher at 185%. As for vegetables, they have long priced themselves out of the diet of the poor, by rising up to 350%. This crippling rise continued while the government (UPA-I and UPA-II) loudly claimed every few months it would bring prices down.
 That is why the share of cereals in total calorie intake has declined since 1993-94 by nearly 7 percentage points for rural India and by about 3.5 percentage points for urban India: the share of oils and fats has on the other hand risen by 3 percentage points for both. The share of milk and milk products has grown by about 1.4 percentage points in urban India but by only 0.6 percentage points in rural India.
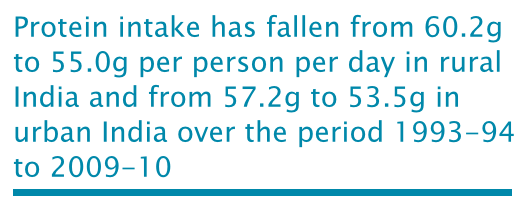
Moreover, at the all-India level protein intake has fallen from 60.2 grams to 55 grams per person per day in rural India and from 57.2 grams to 53.5 grams in urban India over the period 1993-94 to 2009-10. The decline has taken place in most major states but has been sharpest in rural areas of Rajasthan, Haryana, Uttar Pradesh and Punjab – where intake has fallen by 9-12 grams.
As the major trade unions have been raising an alarm about at least every quarter, the price of rice for BPL (below poverty line) card holders increased from Rs 350 per quintal in 1997-98 to Rs 415 per quintal in 2007-08. In the same period the APL (above poverty line) price was increased from Rs 550 per quintal to Rs 755. For wheat, the price for BPL card holders was increased from Rs 250 per quintal to Rs 415 and for APL card holders from Rs 450 to Rs 610 in a period of 10 years.
 In such a situation, fats ought not to be a contributor to calories more than it was 30 years ago. But the analysis tells us otherwise – for India has become the favoured importer of palm oil from Malaysia and Indonesia. Every major state shows an increase in its population’s fat intake. At the all-India level the increase has been from 31.4 grams per person per day in 1993-94 for the rural population to 38.3 grams in 2009-10 – a rise of 7 grams per day over the 16-year period, and from 42 grams to 47.9 grams per day for the urban population, a rise of 6 grams per day over the same period. Between 1993-94 and 2009-10, the contribution of cereals to protein intake has fallen by about 4.5 percentage points in rural India and by 3 percentage points in urban India, while the contribution of pulses has fallen slightly in both rural and urban India.
This analysis from the NSSO must be viewed against the growing trend in India of the corporatisation of agriculture and the industrialisation of the food system. New market monopolies whose reach is far greater than could be conceived in 1993-94 are now at work, aided by speculative financial predators. There is in response a need for strengthening social ownership of the cultivation of food staples, of the organic agriculture movement, of shortening the distances that food travels, of localisation of the Bharatiya food web.
