Archive for July 2016
The relative speeds of urban inflation

How to read this chart. The light grey bars are the current month’s CPI-IW (consumer price index for industrial workers) for each urban centre plotted to the left scale (the current data is for 2016 May). The green square marker is the reading for the difference between the current month’s CPI and the average of the previous six months. The yellow square marker is the reading for the difference between the current month’s CPI and the average of the previous 12 months. And the red square marker is the reading for the difference between the current month’s CPI and the average of the year previous to 12 months ago. These are all plotted to the right scale, and their vertical separation helps tell us whether overall consumer inflation is rapid (or not) compared with other cities. You will find accompanying this chart a table. This associates a city code, such as ST21, used for the charting process, with a city: ST21 the city is Shimla in Himachal Pradesh. Data only (not method or treatment) are from Labour Bureau, Ministry of Labour and Employment.
Belgaum and Mysore in Karnataka with 12 points. Warangal, Telengana with 12 points. Panaji, Goa with 12 points. Munger, Bihar with 11 points. Bangalore, Karnataka with 11 points. Salem, Coimbatore and Coonoor in Tamil Nadu with 10 points. Rourkela, Odisha with 10 points. Sholapur, Maharashtra with 10 points. Vijayawada, Andhra Pradesh with 10 points.
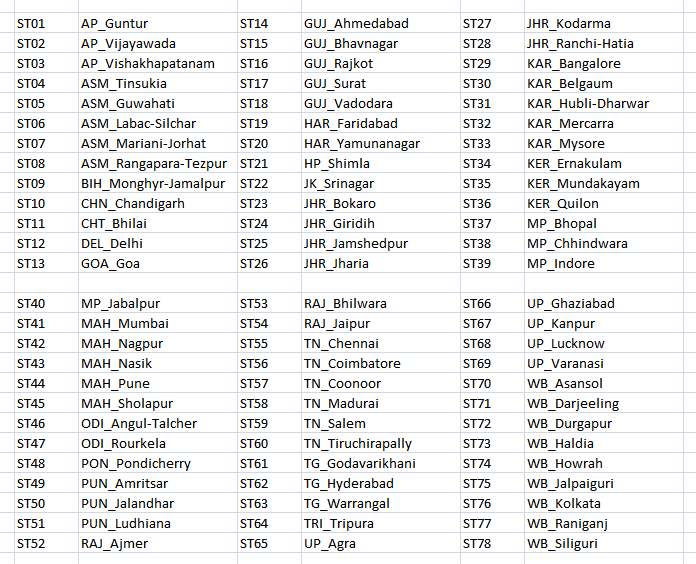
Charting process codes used for urban centres and the cities they correspond with.
These are not Swachch Bharat rankings nor are they ‘ease of doing business’ scores. They are, for each urban centre, the number of points its consumer price index (CPI) increased in May 2016 over the average for the previous quarter. The data is collected and distributed by the Labour Bureau, Ministry of Labour and Employment. This is one of the ways in which the monthly CPI numbers for industrial workers (a somewhat dated term which suited an era when the public sector dominated the economy, but which still relates to urban households) can usefully indicate the acceleration in inflation of household staples.
The picture changes when the CPIs of urban centres for a month (the latest available being 2016 May) are compared with their own averages for the last six months, the last 12 months or the year which ended 12 months ago. When the frame of comparison is the average of the previous 12 months, I find that in 30 of the 78 centres for which a CPI-IW is calculated, the increase is 10 points or more. Warangal in Telengana, Kollam in Kerala and Mysore in Karnataka are 16 points above their previous 12 month average while Munger in Bihar, Rajkot in Gujarat and Jamshedpur in Jharkhand are 15 points above.
This is the relativist picture that perhaps makes the most illuminating use of a monthly index, whatever its faults and shortcomings. The well-appointed chart that I have drawn helps show why the speeds and acceleration, between a current measure and an earlier set of measures, are more important to consider than the absolute numbers themselves. This is an experimental way to help visualise a subject that is alas rather dry but of great import for every single household. I will update this as new CPI numbers are released by the Labour Bureau every month.
What works, and doesn’t, in Maharashtra’s districts
In an exercise to help determine how reports of the MGNREGA (Mahatma Gandhi National Rural Employment Guarantee Act or Nrega) can inform us, I have used the records of what the programme calls ‘outcomes’ in the form of ‘physical assets’ created for the community (or conditional use by groups of individuals, depending on the kind of asset) over a financial year.
 The year is 2015-16 and the districts are those of Maharashtra (34, Mumbai excluded). There are at present 17 categories of physical assets and these are: rural connectivity, flood control and protection, water conservation and water harvesting, drought proofing, micro irrigation works, provision of irrigation, renovation of traditional water bodies, land development, any other activity approved, sewa kendra, coastal areas, rural drinking water, fisheries, rural sanitation, anganwadi, playground, food grain.
 ‘Works’ are recorded under each kind of physical asset, with these classified as having been ‘approved’, ‘taken up’ and ‘completed’ (with ‘taken up’ presumably meaning commenced but incomplete at the end of the financial year). What matters therefore is to study those that have been completed, as the kind of community asset created and certified as being completed would serve to indicate what the community has decided it needs as a priority.
 When so filtered, the number of completed physical assets in the 34 districts of Maharashtra for the year 2015-16 totalled 71,554 – a large number that helps describe why the Nrega records are so very voluminous: 1,376 ‘works’ completed every week in 34 districts, with tens of thousands of Nrega beneficiary individuals and households working to build, repair, revive, create them, and with a complex inventory of raw materials being required to be transported and paid for so that these works may take shape.
 What the list of completed works – type and number – describe is very instructive. Of the 17 categories, four (fisheries, anganwadi, playground and food grain) were recorded with not a single instance of having become a ‘work completed’ in any district. On the other hand, four kinds of physical assets accounted for a full 85% of the 71,554 works completed in Maharashtra’s 34 districts for 2015-16 and these were, in ascending order: drought proofing (8,110 and 11% of the total works), rural sanitation (12,234 and 17%), water conservation and water harvesting (14,384 and 20%), and provision of irrigation (26,496 and 37%).
 The popularity of the latter four can be well understood, as much for how they are all linked as for the precarious living conditions that every taluka in Maharashtra’s semi-arid districts face when the winter months end. These biases towards certain works but not others still do however need to be read with conditions, and keeping in mind that these are the works for but one financial year out of the last ten (albeit the definition of what constitutes an asset under Nrega has been altered and added to several times).
 The question that remains is: Maharashtra’s districts and blocks and villages occupy varying agro-ecological, hydrological and meteorological regions. Do their geographic and environmental circumstances not have a role to play in the decisions taken about what Nrega works should be taken up (and completed) as a priority over other kinds?
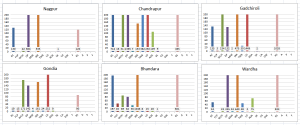
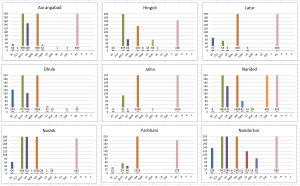
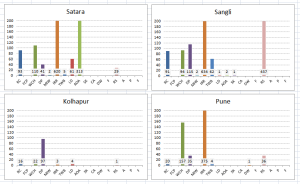
The charts presented here in groups of districts arranged according to their location amongst the six agro-ecological regions that Maharashtra occupies, indicate whether the Nrega ‘works’ process takes cognisance of the fundamental environmental factors upon which the village (and so panchayat, taluka, district) rest. The charts have been constrained to 200 on the vertical axis in order to preserve readability – values are given for each ‘work’ recorded by each district. The abbreviations for the ‘works’ (horizontal axis) are for the full forms found in the second paragraph.
How we almost lost our growing tradition

Part one, ‘Old krishi for new Bharat’ is here.
This came to be known as a ‘development paradigm’ which countries like India and civilisations like Bharat were given prescriptions for. Many of these prescriptions were and continue to be the equivalent of chemotherapy and radiation as used for the treatment of cancer – destroy in the name of curing. This is why in our regions (they are entirely ecological regions, our river valleys and plains, we saw no reason to call them anything but the old names they had been given, for words like ‘ecology’ and agro-ecology only now convey similar meaning that कृषि संस्कृति does) which grew rice, millets, barley, sorghum, wheat, pulses, seasonal fruits and vegetables, a new identity was announced.
This was done early in the ‘green revolution’, a programme that to our ‘annadaatas’ is no less devilish than the industrial revolution in western Europe was to the very fabric of those societies. The new identity was ‘high yielding variety’ and these new hybrids were in no way better than what they were given the power to replace. They neither yielded more than the current varieties, nor did they contain more nutritive elements, nor did their plant matter prove to have more uses than what they replaced, nor could they survive during inclement phases of a seasonal climate with a cheery hardiness the way our traditional varieties could. They were inferior in every way; how could they not be for they had emerged from a science whose very gears and levers were designed by the global market which ruled, paid for and determined that science.
 Youngsters in the India of the 1970s, whether in cities, towns or villages, knew little of these changes and what they portended. Our preoccupations were study, work and attending to the daily and seasonal chores of family. But already, the difference between us and them was being introduced into our quite impressionable lives. Cola, hamburger, popcorn, blue jeans, rock music and behavioural accessories that accompanied such produce had appeared in our midst, via many illicit routes (in those days the Coca Cola company had been expelled). Looking back, such products and behaviours seemed desirable because two important factors worked together – the impact of ‘western’ (mainly American) popular culture vehicles and in particular its motion picture industry, and the accounts of those Indians, young and old, who had left their country to become (mainly) American. It was a time when our world was still considered to be dominated by superpowers and lesser power blocs (we were neither), but the friendship India had with the Soviet Union, the USSR, at no time became manifest through food and drink, behaviours and attitudes.
Why did one influence but not the other? Years later, when working with the Ministry of Agriculture on a lengthy programme intended to strengthen our agricultural extension system, I found a part of the answer. Even in the early 1950s, what became our national agricultural research system, under the Indian Council of Agricultural Research (itself a nationalised version of the Imperial Council of the British colonial era), had been partially designed and implemented by the US Agency for International Development and facilitated by the Rockefeller Foundation. A full decade before the mechanics of the ‘green revolution’ set to work in the plains of northern India, the state agricultural universities and the specific crop institutes they cooperated with were organised along operational lines drawn up by foreign advisers (the early FAO was present too). And that early indoctrination led to one of the most invisible yet long-running collaborations between ‘formal’ crop science personnel from India and the American land grant colleges with their extensive networks of industry interests.

As a young man in my early twenties, I would often hear about the ‘brain drain’, which is the term we used to describe those students and scholars who had earned degrees from our Indian Institutes of Management or our Indian Institutes of Technology and who had made their way abroad, most of them to the USA. These were publicly funded institutes, and the apt question at the time was: why were we investing in their education only to lose them? I had been utterly unaware at the time that a similar ‘brain drain’ had taken place in the agricultural sciences, which by the first decade of the 2000s did not require the ‘drain’ aspect at all, for by then the mechanisms of globalisation, aided by the wiles of technology and finance, meant that the agendas of industrial agriculture could be followed by our national agricultural research system in situ. Of ecology, agro-ecology, environment and organic there was barely a mention, so successfully had the ‘food security’ threat begun to be spun.
It is a recent history that has taken shape while our urban and rural societies have worried themselves about how to escape monetary poverty, to escape hunger, to escape deprivations of every conceivable kind, and to pursue ‘development’ of every conceivable kind. While this has happened, the historians that we needed – I call them historians loosely, they needed only to observe and record and retell, but from the point of view of our joint families and our villages – to record such a change were very much fewer than we needed.
It may seem inconceivable that in a country of our size and population – which crossed one billion about a year before the 2001 Census – we lacked appropriate recordists but this too is a matter of selective exclusion (like the story about the hybrid seeds) for there are essays and tracts aplenty in our major languages and in regional scripts that detail the erosion of tradition because of the assaults of modern ‘development’ on our societies. But these are not in English, they are not ‘formal’, they carry no references and citations, they are published in local district towns, they are read by farmers, labourers, retired postmasters and assistant station masters but not by internationally recognised macro-economists or nationally feted captains of industry; they are not considered chronicles of social change and of the studied, deliberate, ruthless dismantling from our societies their traditions, amongst which is the growing of food.
[This article is the second part of a series of four.]
