Posts Tagged ‘2011’
Fewer cereals still for more rupees

The Labour Bureau of the Government of India has done us a most valuable service by disaggregating from the consumer price indices, separate indices for the individual items that a household typically buys, whether every day, periodically (weekly or monthly) and even annual purchases.
I have charted here the data for the cereal and cereal substitutes. This group consists of rice, wheat, maida (flour), suji (coarse wheat flour), bread, sewai (rice vermicelli), maize atta, wheat atta, tapioca, jowar, sago, ragi, bajra, maize, sattu (ground cereals) and the grouping of beaten or flattened rice (chira, muri, khoi, lawa (CMKL)).
The chart describes the movement – over 96 months from 2006 January to 2013 December – of the price indices (not the prices) for these foods. These are calculated as all-India prices using the consumer price index for industrial workers (CPI-IW) and the base is 2001 = 100.
There are several significant findings from examining the movement of this group of price indices. (1) Over 2008, 2009 and 2010 the rise was steadily upward with a pronounced spike in some items that lasted from 2009 August to 2010 May. This is noteworthy as no spike is visible (for the group as a whole) during 2007-08 when there was a worldwide steep rise in the prices of foods.
(2) From around 2010 May, maida, maize atta, CMKL, bread, wheat atta, rice, wheat increased at a muted rate and even remained flat over short periods whereas other cereals and cereal substitutes rose steeply and/or showed volatility in their indices. (3) From 2012 June the price indices of all items in this group rose steadily and steeply – more steeply than at any time since 2006 January and have continued this accelerated pace until the end of the recorded period, 2013 December.
This is another excellent release into the public domain of valuable indicators by the Labour Bureau which help describe the relentless rise in the prices of food staples in India. As the Labour Bureau has shown, whether it is the consumer price indices it maintains or whether it is the individual goods and services necessary to maintain an acceptable minimum standard of living for the households engaged in agriculture, manufacture or which are dependent on self-employment, the so-called ‘India growth story’ that the ruling government and its supporters speak triumphantly about in fact imposes burdens on the working classes that have grown heavier every month.
Workers in their districts
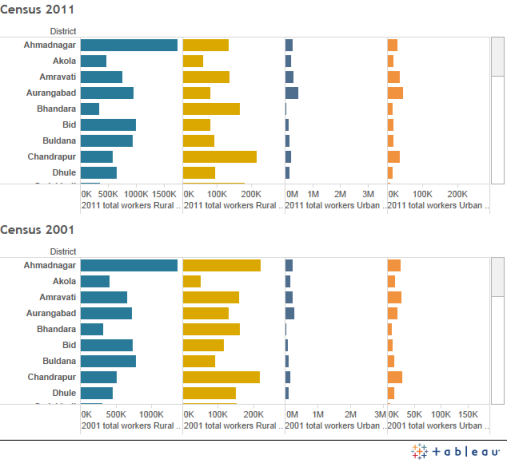
What has changed in the numbers of Maharashtra’s workers over ten years, over the period marked by the recordings of two censuses, 2001 and 2011?
This experimental chart shows us the flow and accumulation in Maharashtra of what the Census calls ‘total workers’, and by this the Census enumerators mean those who said they have employment (or have worked for themselves) for more than six months, and those who have had work (or wages) for less than six months. These two divisions are called ‘main’ and ‘marginal’.
Click for an interactive chart
The difference between these two descriptors of working status may be more grey than black-and-white, for the Census records how much time is spent working and not how much is earned (and saved and spent) as payment for that time spent. Hence, a ‘main’ worker who has been employed for 7 to 8 months of the year may have earned through wages, salaries or commissions just as much as a ‘marginal’ worker did by working for 5 months.
This is only to show that ‘workers’ as counted by a Census can be interpreted in a variety of ways, and for those wanting to get a fuller and richer view of the matter, it is best to read the Census data as a layer above or below one or two other sources of data, such as the NSSO and the results of a field study for example in a district.
What then do the districts of Maharashtra tell us? First, that the number of workers increased between 2001 and 2011 in most but not all districts, and that those districts with the largest increases in numbers were Thane (1.312 million more, 41.28% more), Pune (1.094 million more, 37.05% more), Mumbai Suburban (0.582 million more, 18.48% more), Nashik (0.577 million more, 26.43% more), and Aurangabad (0.398 million more, 33.84% more). There are also Beed with 31.12% more workers and Jalna with 29.85% more workers.
Next, that Mumbai and Mumbai Suburban, together with Thane and Pune, have 13.56 million total workers which is 27% of all Maharashtra’s workers! That is a concentration of numbers, but it tells us nothing about the conditions they work in, whether they are paid adequately to support a family and household (the major unions have been asking for a national minimum floor wage of Rs 10,000 for two years now) and whether these earners receive as is their right workers’ benefits. That is why we try as much as is possible to read the invaluable account of India and its districts and villages as described by the Census together with other sources and studies.
The slow counting of village India

On old maps and in dusty histories, our villages have formed the reliable background against which to describe empire and freedom. Many of the names in the humblest level of description found in Census 2011 can be traced back over generations.
M N Srinivas, the eminent sociologist who died in 1999, once wrote that a sociological study of Indian sociologists would yield interesting results. Over a century’s worth of rural enquiry, we have found that sociologists and anthropologists have been preoccupied with their discrete interests. The former consider urban planning, labour, housing, slum and informal economies, social vices, demography. The latter carefully study tribal cultures, ethnography, acculturation and cultural dynamics, evolution and ethnology.

A descriptive table from the excellent ‘Rural Profiles’, which appeared in the ‘Eastern Anthropologist’, Volume VIII, edited by D N Majumdar, 1955
But it is the macro-economists who have meanwhile perfected their techniques (however questionable, and most are) and who have begun to use quantitative data to understand and interpret the socio-economic problems of rural life. These problems have been studied with little or no attention paid to the cultural background, so that the inter-relations that exist between different sets of social phenomena have to a large extent been ignored (they can hardly be included in a computable general equilibrium model, can they?). From the time Srinivas’s work was charting new directions in the 1940s and 1950s, the call has been made over and again for a holistic approach, in which inter-disciplinary participation would be needed. But the macro-economic disequilibrists have thus far had the upper hand.
 And so to the numbers. There are 43,264 in Rajasthan, there are 25,372 in Assam and there are 40,959 in Maharashtra. That’s the village count in these states and this count (and the way villages are dispersed in the districts based on the size of their populations) is the focus of the latest data release from Census 2011.
Acknowledging the concern of the socio-economists, can there be an ‘average’ count for district? Yes there can, but finding one has little real use especially for the district concerned. Even so, to help us better understand the way a district is (and has for most of our recorded history) been organised I have used the data to find such an ‘average’. From the set of 631 districts that have villages (the others have none, being fully urban in character) I extracted the middle 505 districts (their villages count was from 138 to 1,817) and the median is 817 – that is, 817 villages in an ‘average’ district.
Where can we find such districts? Here are twelve: Garhwa in Jharkhand with 844, Rajkot in Gujarat with 833, Parbhani in Maharashtra with 830, Barpeta in Assam with 825, Mainpuri in Uttar Pradesh with 820, Ashoknagar in Madhya Pradesh with 818, Rangareddy in Andhra Pradesh with 817, Raichur in Karnataka with 815, Sitamarhi in Bihar with 808, Kota in Rajasthan with 805, Cuddalore in Tamil Nadu with 799 and Una in Himachal Pradesh with 790.

The richness of detail in careful village study. This too is from ‘Rural Profiles’, which appeared in the ‘Eastern Anthropologist’, Volume VIII, edited by D N Majumdar, 1955
Although the variation in the villages count is relatively small amongst these ‘average’ twelve (the least has under 10% less than the most) the rural populations in these districts vary widely. Una has a population of 476.000 and Ashoknagar has 691,000 whereas Rajkot has 1,590,000 and Sitamarhi has 3,233,000! In the same way, there are considerable differences in the areas cultivated, the forest cover, the sort of crops cultivated, and the available agricultural labour and cultivators who bring forth the crop from the soil. As I expand on the meaning of these new figures and draw some corelations with other aspects of our district enquiry – 1,670 is the ‘average’ population of a village, for example – we will venture a little closer to the sort of holistic study that Srinivas and his colleagues had called for about six decades ago.
[The new set of data released by Census 2011 has: (1) a note on villages by population, (2) tables by district and by taluka / tahsil / block (excel file), (3) percentage of population living in villages of various population size with reference to the total rural population in 2011, (4) percentage of villages and population by class of villages in 2001 and 2011, (5) the number of villages whose populations are 10,000 and above, 2001-2011, (6) distribution of 10,000 villages of each class, all-India, and 10,000 population in each class of villages, all-India, among states and union territories.]
This quarter, five Indian cities will cross the million mark
 This quarter, that is October to December 2013, a number of India’s cities will cross population landmarks. The 2011 Census fixed the country’s urban population at just over 311 million, a population that had grown over ten years by 31.8% (compared with the rural population growth of 12.3%).
What this means is that India’s cities and towns are adding to their numbers every year and every month at roughly the decadal rate seen for 2001-11. Each urban centre has recorded its own rate of population growth but all together, the rate of growth in the populations of India’s urban settlements has raised the number of Class I towns (those with a population of 100,000 and more) to 490 – the category had 394 in 2001!
So, for the last quarter of 2013, here are the new population marks that will be crossed:
* Tiruppur in Tamil Nadu (1,033,000), Aligarh in Uttar Pradesh (1,002,000), Bareilly in Uttar Pradesh (1,065,000), Mysore in Karnataka (1,047,000) and Guwahati in Assam (1,018,000) will all cross the million mark.
And moreover:
* Muzaffarabad in Uttar Pradesh (527,000), Kurnool in Andhra Pradesh (531,000), Vellore in Tamil Nadu (515,000), Udaipur in Rajasthan (504,000) and Tirunelveli in Tamil Nadu will cross the 0.5 million population mark.
* Nellore in Andhra Pradesh (627,000), Malegaon in Maharashtra (614,000) and Durgapur in West Bengal (610,000) will cross the 0.6 million population mark.
* Puducherry (union territory, 708,000), Guntur in Andhra Pradesh (733,000) and Gorakhpur in Uttar Pradesh (714,000) will cross the 0.7 million population mark.
* Warangal in Andhra Pradesh (826,000) has crossed the 0.8 million population mark. Moradabad in Uttar Pradesh (987,000), Bhubaneshwar in Odisha (967,000) and Jalandhar in Punjab (928,000) will cross the 0.9 million population mark.
The big money in India’s cities

Almost seven out of ten rupees banked in India are to be found in the top 100 centres. They account for 68.5% of the total bank deposits in India.
The concentration of the country’s bank deposits in India’s urban centres can be seen in this detail from a table I have assembled using data from the Reserve Bank of India (RBI).
This is the quarterly series that the RBI puts out and is called ‘Quarterly Statistics on Deposits and Credit of Scheduled Commercial Banks’.
The intriguing table which forms the image is of the top 100 urban centres ranked by bank deposits, and arranged alphabetically, for the years 2007, 2009, 2011 and 2013. The city names and total deposits (in crore rupees) are seen. This is the lower end of the table, and I have coloured ten cities to show how their deposits have changed over six years.
The rate of growth has been extremely steep. We have here Panaji, Patiala, Pune, Ranchi, Shillong, Thane, Thiruvananthapuram, Udaipur, Varanasi and Visakhapatnam for no reason other than their entries for all four years are visible. The patterns for the rest of the top 100 centres is generally the same.
For these ten cities, the average growth rate of their total bank deposits over these six years is 190%! This is most significant to us, especially considering the food inflation, the cost of cultivation, wage rates of agricultural labour and allied issues I write about in this diary. Have the wage rates for agricultural labour grown over these last six years at even one-third this average rate? Not at all.
 From this small set of ten cities alone, the lowest rate of growth of total bank deposits is 88% (Vishakhapatnam in Andhra Pradesh) and the highest is 249% (Thane in Maharashtra).
The progression of the size of total deposits can be seen from Shillong (in Meghalaya) from Rs 2,577 crore in 2007 to Rs 8,311 crore in 2013 (which is dwarfed by the others). In Ranchi (Jharkhand) total bank deposits have grown from Rs 6,436 crore in 2007 to Rs 21,688 crore in 2013!
That is why the top 100 centres accounted for 68.5% of the total bank deposits in India – this is a ratio that has remained roughly the same for the last six years. In addition, as the ‘Quarterly Statistics’ has noted in its highlights, the top 100 centres also accounted for 76.9% of total bank credit.
And that is why it means little for central and state governments, and for businesses and NGOs and social entrepreneurships to talk about ‘financial inclusion’ when we have proof – quarter after quarter – of the persistence of financial inequality between India and Bharat.
When the 65 million who live in India’s slums are counted
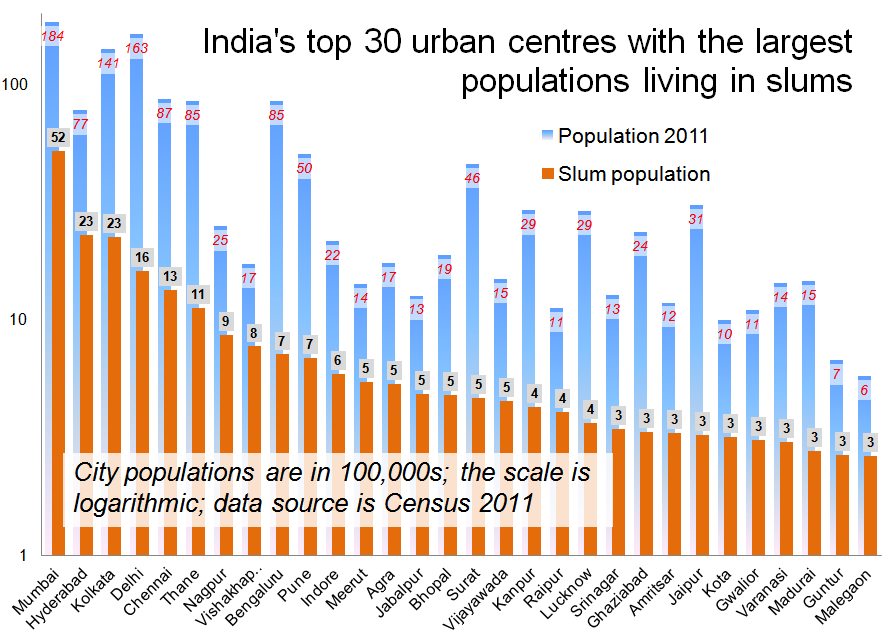
The graph illustrates the 30 largest slum populations in India, using the new Census 2011 data. The scale is logarithmic – not proportional, else showing the largest metros would reduce the smaller cities to being unreadable – so as to better display the trend of growing slum populations in urban centres whose total populations are less than a million (like Guntur and Malegaon) and up to two million (like Kota, Gwalior, Srinagar, Raipur, Jabalpur and Meerut).
We have now one important basis to consider carefully the consequences of the macro-economics of GDP growth and all the programmes to encourage such ‘growth’.
In 2011, 65.49 million Indians lived in slums in our cities and towns (the number was 52 million when recorded in Census 2001). It is important not to allow the immensity of our population numbers (1,250 million now in 2013) to diminish this extraordinary and disgraceful number in any way.
The 65 million who live in slums are all together a population equivalent to the populations of Thailand or France or Britain. This is also larger than the populations of Italy or Burma, South Africa or South Korea.
In Census 2001 the total number of towns that reported slums was 1,743. In Census 2011 the total number of towns and cities that reported slums was 2,613 out of 4,041 ‘statutory’ towns and cities. Here is the guideline for classifying types of slum settlements from Census 2011:
1. All notified areas in a town or city notified as ‘slum’ by state, union territories’ administrations or local government under any act including a ‘slum act’ may be considered notified slums (22.5 million live in notified slums).
2. All areas recognised as ‘slum’ by state, union territories administration or local government, housing and slum boards, which may have not been formally notified as slum under any act may be considered as recognised slums (20.1 million live in recognised slums).
3. A compact area of at least 300 population or about 60-70 households of poorly built congested tenements, in unhygienic environment usually with inadequate infrastructure and lacking in proper sanitary and drinking water facilities. Such areas should be identified personally by the ‘charge officer’ and also inspected by an officer nominated by the Directorate of Census Operations. This fact must be duly recorded in the charge register. Such areas may be considered as identified slums (22.8 million live in identified slums).
[You can get the Primary Census Abstract for slum populations 2011 here as an xls file. There is a very informative presentation on the data available here as a pdf. Consult the primary pages on Census 2011 – India’s 2011 Census a population turning point, India’s 2011 Census the states and their prime numbers and The data vault of the 2011 Census.]
The data vault of the 2011 Indian Census

20140304 – Major update – Extensive new data tables have been made available for public use by the Census of India. These include: (1) Primary Census Abstract tables to the village and ward level, (2) consolidated top level datasheets for Population Enumeration Data, population living in villages, age data, and data on disability.
Here they are:
[Set 1] Primary Census Abstract Data (Final Population); Primary Census Abstract Data for Houseless (India & States/UTs – District Level) ; Primary Census Abstract Data for Scheduled Castes (SC) (India & States/UTs – District Level) ; Primary Census Abstract Data for Scheduled Tribes (ST) (India & States/UTs – District Level) ; Primary Census Abstract Data for Slum (India & States/UTs – Town Level) ; Primary Census Abstract Data Highlights – 2011 (India & States/UTs) ; Primary Census Abstract Data Tables (India & States/UTs – District Level) ; Primary Census Abstract Data Tables (India & States/UTs – Town/Village/Ward Level).
[Set 2] Villages By Population ; Village population Tables ; Percentage of population living in villages of various population size with reference to the total rural population: 2011 ; Percentage of villages and population by class of villages in 2001 and 2011 ; Statement showing the number of Villages of population 10,000 and above with their population: 2001-2011 ; Distribution of 10,000 villages of each class in All India and 10,000 population in each class of villages All India among the States and Union Territories.
[Set 3] Single Year Age Data – (India/States/UTs) ; Single Year Age Data for Scheduled Castes (SC) ; Single Year Age Data for Scheduled Tribes (ST) ; Five Year Age Group Data ; Five Year Age Data for Scheduled Castes (SC) ; Five Year Age Data for Scheduled Castes (ST).
[Set 4] Disabled Population by type of Disability, Age and Sex (India & States/UTs – District Level) ; Disabled Population by type of Disability, Age and Sex For Scheduled Castes (India & States/UTs – District Level) ; Disabled Population by type of Disability, Age and Sex For Scheduled Tribes (India & States/UTs – District Level).
20130903 – The Census 2011 as a data source is now two years old for the first indicators and preliminary estimates were released in 2011 June and July. Since then we have had regular releases from the world’s most detailed very large-scale enumeration of people.
The ‘primary census abstract’ is the most important record for a settlement, whether a rural hamlet or an urban town ward. This contains the population, gender ratio, literacy rate, proportion of children, the numbers of scheduled tribe and caste members, and also contains the four-fold break-up of the working population.
The Census of India has released the primary census abstract (PCA) to the district level for all states and union territories. On the website, you can get the tables for individual districts through a series of menus. Here, I have posted the xls data sheets for every state and union territory, and each sheet contains the PCA for all that state’s districts.
In alphabetical order (and with the state census code) they are: Andaman and Nicobar Islands (35), Andhra Pradesh (28), Arunachal Pradesh (12), Assam (18), Bihar (10), Chandigarh (04), Chhattisgarh (22), Dadra and Nagar Haveli (26), Daman and Diu (25), Delhi (07), Goa (30), Gujarat (24), Haryana (06), Himachal Pradesh (02), Jammu and Kashmir (01), Jharkhand (20), Karnataka (29), Kerala (32), Lakshadweep (31), Madhya Pradesh (23), Maharashtra (27), Manipur (14), Meghalaya (17), Mizoram (15), Nagaland (13), Odisha (21), Puducherry (34), Punjab (03), Rajasthan (08), Sikkim (11), Tamil Nadu (33), Tripura (16), Uttar Pradesh (09), Uttarakhand (05), West Bengal (19).
The cereals demand footprint of smaller Indian cities

All those squares need to grow wheat, rice and millets for the residents of this town of 123,286 people.
On this map you can see, near the centre, the town of Amalner, in the state of Maharashtra, in the district of Jalgaon. In 2001 Amalner was a Class II town, as categorised by the Census of India based on its population being under 100,000 people – its population then was 91,490.
In the 2011 Census the population of Amalner was 116,750 which means the town has crossed the 100,000 mark and for the ten years between the two censuses, its population grew at just under 2.8% every year. Although rapid, that still places Amalner comfortably under the 3.4% average annual population growth rate of the 500 towns and cities whose details we have in the 2011 Census.
 How much food do the residents of Amalner need every year? Estimating the quantities is relatively less troublesome for cereals, whereas for pulses, vegetables, fruit, dairy and meat it is progressively more difficult and unreliable.
The squares on the map are scaled for the map, and that means each square is 100 hectares large at the scale of the map. They show the land area required to supply Amalner’s residents their wheat, rice and millets mix (I have taken a 40:40:20 mix as typical for Maharashtra). Crop yield data are from the Ministry of Agriculture, Department of Economics and Statistics, averaged, and adjusted for milled quantities of rice and wheat (but not millet).
How much wheat, rice and millet? The unmilled quantities I estimated are, for 2001: 5,940 tons (wheat), 7,630 tons (rice) and 2,670 tons (millets). For 2013 the quantities are: 8,000 tons (wheat), 10,290 tons (rice) and 3,600 tons (millets). The annual cereals requirement is based on the Indian Council of Medical Research (ICMR) 2010 recommended dietary allowance (cereal 400 gm/capita/day).
Now this graphic, plotted on a map that shows the urban extent of Amalner, also shows the land ‘footprint’ of cereals that a typical smaller town requires. We have now much greater interest in urban agriculture than even two years earlier, and while these networks have begun to thrive, this analysis demonstrates the dependence by urban residents on districts to supply them cereals and pulses.
 In the graphic, the squares under the caption ‘additional cereals area in 2013’ show the new hectares required to be brought under cereals cultivation to meet the calorie needs and nutritional standards for Amalner’s growing population. The use of these squares on the map serves to show why land use change for urbanisation runs quickly into physical limits – provided those physical limits are recognised and planned for.
There are about 130 such urban settlements with populations of plus-minus 10,000 relative to the population of Amalner. Above this group are the cities with populations of 150,000 and above all the way to the million-plus metropolises. Below this set are the much more numerous small towns with populations of 20,000 to 100,000 and whose demand for food, and therefore on the maintenance of cultivated, is hardly known or measured.
Amalner’s 2.8% population growth rate every year also tells us there are migrants coming into the town. When those additional migrants are also cultivators and former agricultural labour, what will happen to the old and new hectares the cities need to keep cultivated? Where will the food come from?
A hasty and stunted legislation for food security in India
The United Progressive Alliance in India, the ruling political coalition at whose centre is the Congress party, has called it “a historic initiative for ensuring food and nutritional security to the people”. By this is meant The National Food Security Bill, which was passed by the Lok Sabha on 26 August 2013.
In recent weeks, criticisms of the provisions of the bill and suggestions for its amendment gathered quickly, from political parties, from state governments, from civil society and NGOs and academics, and from citizens who have followed the twists and turns of the draft legislation since 2010. How many of these have been incorporated into the bill as passed by the Lok Sabha is still unclear, but a government press release stated that ten amendments were approved. I don’t know which ten but these would be small in number compared with the scores of amendments, corrections, modifications and re-draftings suggested by groups and coalitions that have long worked for food security in India and its states.
Sifting through news reports for relevant information, I find that:
(1) The government has said that the word ‘meal’ as used in the approved bill means hot cooked or pre-cooked and heated food and not the packaged food, which was a definition that provoked many when it was spotted in the draft. This is an important amendment as it has an impact on the enormous mid-day meals (for schoolchildren in government schools) and the integrated child development services (ICDS) programmes, which reach tens of millions. The fear was that packaged food would supplant, to the detriment of the children, hot and fresh cooked meals.
(2) As far as I can make out, another approved amendment gives states a year to implement the bill instead of six months. Earlier, under the ordinance (whose passage was roundly condemned), the central government was to determine the number of eligible beneficiaries in each state. Not only was this centrist in nature, it required the process by which beneficiary households were to be identified to be completed within 180 days, even though the guidelines for such identification are yet to be issued by the central government. Moreover, there has been no consultation with the states on this aspect.
(3) There is some reference made to the states determining their approach and measures towards implementing the bill, which will be (or may be) governed by “rules” that are to be drawn up in consultation with the state governments. This is important for, in the text of the Food Security Ordinance the central government reserved the right to introduce cash schemes instead of food in the Rules of the proposed legislation. This had signalled quite clearly its longer-term agenda of dismantling the system of procurement of grain from farmers at notified minimum support prices.
The reportage of the passing of the bill has touched upon a variety of issues and concerns, and here is a selection:
Lok Sabha passes Food Security Bill
Sonia Gandhi’s ambitious food bill gets Lok Sabha nod; UPA gets its ‘game-changer’
The Food Security Bill will cost a lot more than projected
Food security bill: Is it right or fight to food?
Long due, Food Security Bill meets mixed reaction
Food Bill will not raise fiscal deficit: Chidambaram
‘Not against Food Security Bill, but want certain changes’: BJP
Food Security a ‘historic opportunity’ or mere ‘vote security’?
Food security Bill gets Lok Sabha nod as Sonia lauds ’empowerment revolution’
The government has said that the Bill will cover 75% of the rural population and 50% percent of the urban population in all states, coming to an average of 67% for the total national population. This however will use (we await a full reading of the approved amendments that will clarify this matter) the methodology of the Planning Commission for poverty estimates which is to provide the basis for dividing the population between below and above the poverty line. This is the same methodology and ratios that have been soundly discredited.
The point that has been made forcefully by the Communist Party of India Marxist (CPIM) is that these caps on population compromise utterly the right of state governments to decide criteria as contained in the bill. The caps are set by Planning Commission methods, not by state governments themselves. That is why the guidelines that are to be drafted – via consultation, the central government has said – by the state governments must ensure the maximum inclusion, and not the limited inclusion decided by the Planning Commission.
Moreover, the All India Kisan Sabha at its 33rd All India Conference (24-27 July 2013 in Cuddalore, Tamil Nadu) had in a resolution of food security described the policy canvas against which this food security bill has now been passed:
“India has become more food-insecure over the last decade in terms of all three dimensions of food security: availability, access and absorption. Availability has been undermined by policies reducing productivity growth and making grain cultivation unremunerative. Access has been weakened by jobless growth and massive inflation destroying people’s purchasing power. Absorption has been undermined by the failure to invest in safe drinking water and sanitation. All three consequences are directly traceable to neoliberal policies. Yet, the UPA government hypocritically talks of food security and has promulgated a so-called Food Security Ordinance in an attempt to gain political mileage while flouting all norms of parliamentary democracy.”
Documents for reference:
The National Food Security Bill, 2013
The National Food Security Bill, 2011
The National Food Security Ordinance, 2013
Report of the expert committee on the national food security bill
Lok Sabha Standing Committee report on National Food Security Bill
Food subsidy and its utilisation
NRAA – Challenges of food security
India’s 681 million hungry rural citizens
 What do and what can rural residents spend on food and the essentials of living in India? This chart gives us an indication. It is based on new data contained in the latest revelation (my word, not theirs) from the National Sample Survey Office and is titled ‘Key Indicators of Household Consumer Expenditure in India’ (the 68th Round of sampling, for those who follow the extraordinary programme of this sterling statistical organisation).
There is data enough in the volume to inform us, clearly and starkly, that the cumulative impact of several years of food price inflation is hurting households more with every passing quarter. Consider what this new data release tells us:
 * That the average rural monthly expenditure per person was lowest in the states of Odisha and Jharkhand (around Rs 1,000) and also in Chhattisgarh (Rs 1,027).
* In Bihar, Madhya Pradesh and Uttar Pradesh, the rural monthly expenditure per person was about Rs 1,125 to Rs 1,160.
* In urban India (not shown in this chart, but I will add to this posting with an expanded update) Bihar had the lowest monthly expenditure per person (called monthly per capita expenditure by the NSSO and abbreviated to MPCE) of Rs 1,507.
* In Chhattisgarh, Odisha, Jharkhand, Uttar Pradesh and Madhya Pradesh, urban MPCE was between Rs 1,865 and Rs 2,060. These six were the six major states with the lowest MPCEs for both rural and urban citizens.
But those are averages, and in this data release, the NSSO has divided its usual ten deciles even further for the lowest and highest deciles. (The decile is the surveyed population divided into tenths, with these being classified by expenditure level.) Doing so gives us a better view of the elastic expense trends in the top ten per cent of the population, the class which is so pampered by the central government. For rural India then, the 5th percentile of the MPCE distribution was estimated as Rs 616 and the 10th percentile as Rs 710 – and these are all-India averages.
[The spreadsheet with the table and chart is here. You can find the highlights of the NSSO study here.]
 About half the total rural population is thus estimated to have a MPCE below Rs 1,198. Only about 10% of the rural population reported household MPCE above Rs 2,296 and only 5% reported MPCE above Rs 2,886 (this is using what is called the ‘modified mixed reference period’ or MMRP, in which the person interviewed is asked to recall purchases made over two different lengths of time, for different sorts of goods). The bottom-line is that food accounted for about 53% of the value of the average rural Indian’s household consumption during 2011-12.
This included 11% for cereals and cereal substitutes, 8% for milk and milk products, another 8% on beverages and processed food, and 6.5% on vegetables. Among non-food item categories, fuel for cooking and lighting accounted for about 8%, clothing and footwear for 7%, medical expenses for about 6.5%, education for 3.5%, conveyance for 4%, other consumer services for 4%, and consumer durables for 4.5%.
This ought to be a ringing alarm about access to food for the country’s planners, who are otherwise obsessed with GDP growth and whether India is cosmetically dolled up enough to attract global finance capital. It hasn’t sounded even a muted gong, and even if it had, one stunning inference from this table has been ignored – that this is an indicator of food and multi-dimensional poverty and that millions of rural residents are unable to afford food and basic services.
How so? Look at the chart again. Imagine, at just above the line marking 2,000 rupees, a dotted red line at a level of around 2,070 rupees. That is the equivalent (before the recent fall in the rupee’s value against the US dollar) of USD 1.25 a day, which has (ill-advisedly) been cemented in development wisdom as a poverty line that can be applied in countries like India. Let’s accept that in order to focus on what the new NSSO data tells us.
 At the Rs 2,070 level we see that for a relatively prosperous state like Haryana (a former Green Revolution state) about 50% of the rural population cannot spend, per person per month, this amount. The percentage of the rural population below and above this line is similar, more or less, for Punjab (also a former Green Revolution state) and for Kerala (which is not, but has income from economic migrants abroad).
But the entire rural populations of Bihar, Chhattisgarh, Jharkhand and Odisha cannot spend this amount, because they do not earn it. How many is that? Using the 2001-2011 population growth rates (for rural populations of states) this means 98.96 million in rural Bihar, 20.65 million in rural Chhattisgarh, 26.52 million in rural Jharkhand and 36.19 million in rural Odisha are below this line. What of other states with large rural populations?
In Assam, Madhya Pradesh, Uttar Pradesh and West Bengal, 90% of the rural population is below this line and that means 25.23 million in Assam, 49.90 million in Madhya Pradesh, 147.25 million in Uttar Pradesh, and 57.26 million in West Bengal. In Gujarat, Karnataka, Maharashtra and Rajasthan, 80% of the rural population is below this line and that means 28.52 million in Gujarat, 30.66 million in Karnataka, 50.77 million in Maharashtra and 43.55 million in Rajasthan. In Andhra Pradesh and Tamil Nadu, 70% of the rural population is below this line and that means 39.64 million in Andhra Pradesh and 26.56 million in Tamil Nadu.
Taken together those rural populations are 681.72 million (more than twice the population of the USA). They are 78% of India’s 2013 rural population, almost eight out of ten rural citizens.
