Posts Tagged ‘Uttar Pradesh’
Regions of wheat, lands of rice

The return of budgetary focus towards agriculture and the economies of rural India will help deepen our understanding about where crops are grown and for whom. These are still more often described in national aggregate terms of annual estimates, than by season, state and the growing appetites of urban agglomerations.
This could change over the next few years, especially as the so-called services sector shrinks both by the number of people it employs and by its importance to the national economy. Services – a peculiarly invented term that was quite unknown and unused when I was a teenager – has come about because of the financialisation of those portions of social activity which were done at small scale, informally and as adjunct activities to the work of the public sector, the manufacturers and factories, and the great numbers of cultivators (and those working on agricultural produce). The many enforced errors of contemporary economics means that this will continue to change – not without pain and confusion – but that social activity that has some economic dimension will return to what it was two generations earlier.
While it does, we find there are differences in the concentration of food staples produced – that is, how much by quantity do certain regions grow our food staples as a significant fraction of national production of that food staple. This is more readily available as state quantities instead of district. I have suggested to the Ministry of Agriculture that this ought to be monitored not only at the level of the district but also by the agro-ecological zone, or region, for we have 120 in India, and they represent varying climatic conditions, soil typologies, river basins and cultivation systems.
At present, what we see then is that for rice and wheat, the top three producing states account for 36.7% (rice) and 62% (wheat) of the country’s production. This distribution – or concentration – should cause a review of the crop choices that our kisans make in the growing districts and agro-ecological zones. For a simple pointer such as this tells us that 37 out of every 100 quintals of rice grown in India are grown in West Bengal, Uttar Pradesh and Andhra Pradesh and that 62 out of every 100 quintals of wheat grown in India are grown in Uttar Pradesh, Punjab and Madhya Pradesh.
The corresponding distribution/concentration with coarse cereals is better than wheat but not better than rice for 45.4% of total coarse cereals are grown in Rajasthan, Karnataka and Andhra Pradesh. Likewise, 48.8% of all pulses are grown in Madhya Pradesh, Rajasthan and Maharashtra. The tale is similar with oilseeds (63.8% in Madhya Pradesh, Rajasthan and Gujarat), with sugarcane (73% in Uttar Pradesh, Maharashtra and Karnataka) and cotton (69.8% in Gujarat, Maharashtra and Andhra Pradesh).
With horticulture – that is, vegetables and fruit – there is less state-level concentration to be seen. India’s kisans grow about 170 million tons of vegetables and about 85 million tons of fruit a year and their concentrations vary – West Bengal and Odisha grow a great deal of brinjal, Maharashtra grows onions, Uttar Pradesh and West Bengal lead in potatoes, Madhya Pradesh and Karnataka grow the most tomatoes, and so on. Overall however, the range of distribution amongst the large states of their produce of vegetables and fruit is not as concentrated as with the food staples. The reasons for this difference can tell us a great deal about the need for district and watershed-level food security, employing as always sound zero budget farming techniques (no external inputs) and local and indigenous knowledge of cultivation techniques.
Three months of swinging Celsius

The middle of February is when the chill begins to abate. The middle of May is when the monsoon is longed for. In our towns, district headquarters and cities, that climatic journey of 90 days is one of a steady rise in the reading of the temperature gauge, from the low 20s to the mid 30s.
This large panel of 90 days of daily average temperatures shows, in 57 ways, the effects of the rains that almost every district has experienced during the last two months. For each city, the curved line is the long period ‘normal’ for these 90 days, based on daily averages. Also for each city, the second line which swings above and below the ‘normal’ is the one that describes the changes in its daily average from February to May 2015.
[You can download (1.52MB) a full resolution image of the panel here.]
Where this second line crosses to rise above the normal, the intervening space is red, where it dips below is coloured blue. The patches of red or blue are what tell us about the effects of a lingering winter, or rains that have been called ‘unseasonal’ but which we think signal a shift in the monsoon patterns.

The 90-day temperature chart for Goa, with daily averages nearer the long period normal over the latter half.
Amongst the readings there is to be found some general similarities and also some individual peculiarities. Overall, there are more blue patches than there are red ones, and that describes how most of the cities in this panel have escaped (till this point) the typical heat of April and May. The second noteworthy general finding is that these blue patches occur more frequently in the second half of the 90 days, and so are the result of the rainy spells experienced from March to early May.
Hisar (in Haryana) has remained under the normal temperature line for many more days than above or near it. So have Gorakhpur (Uttar Pradesh), Pendra (Chhattisgarh), Ranchi (Jharkhand), Nagpur (Maharashtra) and Jharsuguda (Odisha).
On the other hand in peninsular and south India, the below ‘normal’ daily average temperature readings are to be found in the latter half of the time period, coinciding with the frequent wet spells. This we can see in Kakinada, Kurnool and Anantapur (Andhra Pradesh), Bangalore, Gadag and Mangalore (Karnataka), Chennai, Cuddalore and Tiruchirapalli (Tamil Nadu) and Thiruvananthapuram (Kerala). [A zip file with the charts for all 57 cities is available here (1.2MB).]
What pattern will the next 30 days worth of temperature readings follow? In four weeks we will update this bird’s eye view of city temperatures, by which time monsoon 2015 should continue to give us more blues than reds. [Temperature time series plots are courtesy the NOAA Center for Weather and Climate Prediction.]
The cities and their multitudes

The 166 Indian cities in the UN population list. What do the colours mean? Dark blue is for city populations up to 250,000; light blue is 250,000-500,000; pink is 500,000 to 1 million; orange is 1 million to 5 million; red is 5 million and above. The source for the data is ‘World Urbanization Prospects: The 2014 Revision’, from the United Nations, Department of Economic and Social Affairs, Population Division.
Bigger cities growing at a rate faster in the last decade than earlier decades. This is what the image shows us. These are 166 cities of India whose populations in 2014 were 300,000 and above. The jagged swatches of colour that seem to march diagonally across the image describe tiers of population, for the table is arranged according to the populations of these cities in 2015, with the annual series beginning in 1985 and extending (as a forecast) until 2030.
The populations of four cities will cross 0.5 million in 2015: Jalgaon (Maharashtra, whose population will be 506,000 in 2015), Patiala (Punjab, 510,000), Thoothukudi (Tamil Nadu, 514,000) and Imphal (Manipur, 518,000). They will join a group of cities which in 2014 crossed the 0.5 million mark: Gaya (Bihar, 508,000 in 2015), Rajahmundry (Andhra Pradesh, 511,000), Udaipur (Rajasthan, 517,000), Bilaspur (Chhattisgarh, 518,000), Kayamkulam (Kerala, 533,000) and Agartala (Tripura, 550,000).
Just ahead of these are Vellore (Tamil Nadu, whose population in 2015 will be 528,000 and which crossed 0.5 million in 2013), Mathura (Uttar Pradesh, 529,000 and 2014), Tirunelveli (Tamil Nadu, 530,000 and 2011), Sangli (Maharashtra, 545,000 and 2009), Tirupati (Andhra Pradesh, 550,000 and 2013), Ujjain (Madhya Pradesh, 556,000 and 2009), Kurnool (Andhra Pradesh, 567,000 and 2012), Muzaffarnagar (Uttar Pradesh, 587,000 and 2011), Erode (Tamil Nadu, 590,000 and 2010) and Cherthala (Kerala, 593,000 and 2013).
To make this chart I have used the data from ‘World Urbanization Prospects: The 2014 Revision’, from the United Nations, Department of Economic and Social Affairs, Population Division. The 166 cities of India are extracted from the main table, ‘Annual Population of Urban Agglomerations with 300,000 Inhabitants or More in 2014, by Country, 1950-2030’.
North India 2014, much dust, more heat, late rain

The sweltering of North India, aggravated by manic urbanisation, just as manic use of personal automobiles, the steady thinning of tree canopies, and small businesses forced to buy diesel generators – in the tens of thousands, each emitting hot fumes that further trap already heated layers of sooty air – is an annual pre-monsoon epic that no-one has the energy to write.
This panel of four maps shows us where India baked during the last week of 2014 May (and now, Delhi has experienced a record its residents did not want). The high temperature belts (top left map), 40-45 Celsius, covered most of central and north-western India (Maharashtra, Madhya Pradesh, Gujarat, Rajasthan, Gangetic Uttar Pradesh, Haryana, Punjab and Delhi). Minimum temperatures (top right), 20-15 Celsius, are seen in two pockets – south interior Karnataka and in the North-East over Manipur and Mizoram.
These temperature maps may be read with the rainfall for the same period, 2014 May 25-31, to correlate particularly the temperature anomalies (how much higher or lower the normal maxima and minima have departed) with where it has rained. The rainfall map (lower left) shows rain having fallen over south Karnataka, but also north West Bengal and eastern Bihar, coastal Odisha and southern Haryana. These appear to relate to a group of anomalies (lower right): the first being interior Tamil Nadu, north-eastern Karnataka and adjacent Andhra Pradesh; the second being eastern Uttar Pradesh and adjacent Bihar. [You can get the four maps in this zip file.]

Read these from top left – 21, 22 and 23 June. Lower row – 24, 25 and 26 June. The green shading is the rain-bearing cloud cover. After 20 June the peninsula will have rain in most meteorological zone but North and north-west India will still await the monsoon system.
What these don’t show, but which the longer range forecast Indian Institute of Tropical Meteorology (Pune, Maharashtra) has on record, is that monsoon 2014 will not touch northern India until the fourth week of June. Rain-bearing cloud and wind systems will cover, in this forecast, peninsular India by around the 16th or 17th of June, but it will be another week before they deliver some relief to the cemented and asphalted surfaces of the National Capital Territory and its parched surroundings.
These very helpful maps are used by the Pune-based met researchers as part of their monsoon monitoring and forecasting partnership with several international climatoloigcal research institutes, chief amongst them the National Oceanic and Atmospheric Administration (NOAA) of the USA through its Climate Prediction Centre.
The Tropmet – as the Pune group is usually called – has bequeathed to us a definition (perhaps for this season only, subject to revision when climate change asserts itself) of monsoon rain that is in part scientific and in part geographic, which I think is a good sign (the Indian Meteorological Department will disagree, but we know better). The faster Tropmet decides to communicate in language appreciated, and understood, by Bharatiya citizens, the more said citizens will find an interest in correcting the misconceptions of scientists.
Tropmet says: “Rainfall within the summer monsoon season is mainly punctuated by the northward propagating monsoon intraseasonal oscillations (MISOs) with timescales of 30-60 days that manifests as spells of heavy rainfall and periods of quiescent rainfall, instead of a continuous deluge.” In the Konkan, we like our continuous deluge and the old-timers would have sixteen names for different sorts of deluge (and an equally rich chest of monsoon nouns for other sorts of rain).
This quarter, five Indian cities will cross the million mark
 This quarter, that is October to December 2013, a number of India’s cities will cross population landmarks. The 2011 Census fixed the country’s urban population at just over 311 million, a population that had grown over ten years by 31.8% (compared with the rural population growth of 12.3%).
What this means is that India’s cities and towns are adding to their numbers every year and every month at roughly the decadal rate seen for 2001-11. Each urban centre has recorded its own rate of population growth but all together, the rate of growth in the populations of India’s urban settlements has raised the number of Class I towns (those with a population of 100,000 and more) to 490 – the category had 394 in 2001!
So, for the last quarter of 2013, here are the new population marks that will be crossed:
* Tiruppur in Tamil Nadu (1,033,000), Aligarh in Uttar Pradesh (1,002,000), Bareilly in Uttar Pradesh (1,065,000), Mysore in Karnataka (1,047,000) and Guwahati in Assam (1,018,000) will all cross the million mark.
And moreover:
* Muzaffarabad in Uttar Pradesh (527,000), Kurnool in Andhra Pradesh (531,000), Vellore in Tamil Nadu (515,000), Udaipur in Rajasthan (504,000) and Tirunelveli in Tamil Nadu will cross the 0.5 million population mark.
* Nellore in Andhra Pradesh (627,000), Malegaon in Maharashtra (614,000) and Durgapur in West Bengal (610,000) will cross the 0.6 million population mark.
* Puducherry (union territory, 708,000), Guntur in Andhra Pradesh (733,000) and Gorakhpur in Uttar Pradesh (714,000) will cross the 0.7 million population mark.
* Warangal in Andhra Pradesh (826,000) has crossed the 0.8 million population mark. Moradabad in Uttar Pradesh (987,000), Bhubaneshwar in Odisha (967,000) and Jalandhar in Punjab (928,000) will cross the 0.9 million population mark.
When India’s food growers cannot afford fuel, light and food

This group of ten charts describes the trends over more than seven years of the food, and the fuel and light components of the consumer price index numbers for agricultural labourers. The data has been taken from reports issued by the Labour Bureau, Ministry of Labour and Employment, Government of India.
This group of charts describes the trends of two indexes – food, and fuel and light – for agricultural labourers in ten states. The consumer price index (CPI) that is usually invoked by the government, by industry, by the corporate associations (such as chambers of commerce), and by economists and banks is a number for that month considered to be ‘national’.
This has no meaning, for what you and I buy is not at a ‘national’ market but at a local one – we may even buy from a roving street vendor, provided our municipal corporation or council has the sense not to outlaw these vendors (which sadly is discrimination common in metropolitan cities).
A consumer price index, in order to be of any use, must be local, and must relate to those who can set some store by it. That is why it is most useful to look carefully at what CPI includes, and it does include much detail, which this small group of charts helps reveal.
The consumer price index numbers for agricultural and rural labourers (with a base of 100 fixed to the year 1986-87) is calculated by the Labour Bureau, Ministry of Labour and Employment, Government of India. Who are agricultural labourers? The Bureau’s definition is: “Agricultural labour households – the rural labour households, who derive 50 per cent or more of their total income from wage paid manual labour in agricultural activities, are treated as agricultural labour households.”
According to the Bureau, a person is considered an agricultural labourer, if she or he “follows one or more of the following agricultural occupations in the capacity of a labourer on hire, whether paid in cash or kind or partly in cash and partly in kind” and the occupations are: farming including cultivation, growing and harvesting of any agricultural commodity; production, cultivation, growing and harvesting of any horticultural commodity; dairy farming; raising of livestock, bee-keeping or poultry farming; any practice performed on a farm “incidental to or in conjunction with the farm operations” (this includes forestry, market-related activities such as delivery and storage, and the actual movement of produce to markets).
The collection of rural retail prices every month from shops and markets is done by the Field Operations Division of the National Sample Survey Office (NSSO). In 20 states it collects data from 600 representative sample villages every month, with one-fourth of the sample being covered every week. Prices are collected either on a market day (which is most commonly a set day of the week) for those villages that do not have daily markets, or on any day for those that do.
And here we have – for Andhra Pradesh, Uttar Pradesh, Maharashtra, Madhya Pradesh, Tamil Nadu, Rajasthan, Karnataka, Gujarat, West Bengal and Bihar, ten of India’s most populous states – the proof of how much India’s growers of food are burdened by the rising price of fuel and light (that means of electricity and power, diesel, kerosene and coal) and of food (cultivators and food growers also buy what they do not grow or husband).
The data vault of the 2011 Indian Census

20140304 – Major update – Extensive new data tables have been made available for public use by the Census of India. These include: (1) Primary Census Abstract tables to the village and ward level, (2) consolidated top level datasheets for Population Enumeration Data, population living in villages, age data, and data on disability.
Here they are:
[Set 1] Primary Census Abstract Data (Final Population); Primary Census Abstract Data for Houseless (India & States/UTs – District Level) ; Primary Census Abstract Data for Scheduled Castes (SC) (India & States/UTs – District Level) ; Primary Census Abstract Data for Scheduled Tribes (ST) (India & States/UTs – District Level) ; Primary Census Abstract Data for Slum (India & States/UTs – Town Level) ; Primary Census Abstract Data Highlights – 2011 (India & States/UTs) ; Primary Census Abstract Data Tables (India & States/UTs – District Level) ; Primary Census Abstract Data Tables (India & States/UTs – Town/Village/Ward Level).
[Set 2] Villages By Population ; Village population Tables ; Percentage of population living in villages of various population size with reference to the total rural population: 2011 ; Percentage of villages and population by class of villages in 2001 and 2011 ; Statement showing the number of Villages of population 10,000 and above with their population: 2001-2011 ; Distribution of 10,000 villages of each class in All India and 10,000 population in each class of villages All India among the States and Union Territories.
[Set 3] Single Year Age Data – (India/States/UTs) ; Single Year Age Data for Scheduled Castes (SC) ; Single Year Age Data for Scheduled Tribes (ST) ; Five Year Age Group Data ; Five Year Age Data for Scheduled Castes (SC) ; Five Year Age Data for Scheduled Castes (ST).
[Set 4] Disabled Population by type of Disability, Age and Sex (India & States/UTs – District Level) ; Disabled Population by type of Disability, Age and Sex For Scheduled Castes (India & States/UTs – District Level) ; Disabled Population by type of Disability, Age and Sex For Scheduled Tribes (India & States/UTs – District Level).
20130903 – The Census 2011 as a data source is now two years old for the first indicators and preliminary estimates were released in 2011 June and July. Since then we have had regular releases from the world’s most detailed very large-scale enumeration of people.
The ‘primary census abstract’ is the most important record for a settlement, whether a rural hamlet or an urban town ward. This contains the population, gender ratio, literacy rate, proportion of children, the numbers of scheduled tribe and caste members, and also contains the four-fold break-up of the working population.
The Census of India has released the primary census abstract (PCA) to the district level for all states and union territories. On the website, you can get the tables for individual districts through a series of menus. Here, I have posted the xls data sheets for every state and union territory, and each sheet contains the PCA for all that state’s districts.
In alphabetical order (and with the state census code) they are: Andaman and Nicobar Islands (35), Andhra Pradesh (28), Arunachal Pradesh (12), Assam (18), Bihar (10), Chandigarh (04), Chhattisgarh (22), Dadra and Nagar Haveli (26), Daman and Diu (25), Delhi (07), Goa (30), Gujarat (24), Haryana (06), Himachal Pradesh (02), Jammu and Kashmir (01), Jharkhand (20), Karnataka (29), Kerala (32), Lakshadweep (31), Madhya Pradesh (23), Maharashtra (27), Manipur (14), Meghalaya (17), Mizoram (15), Nagaland (13), Odisha (21), Puducherry (34), Punjab (03), Rajasthan (08), Sikkim (11), Tamil Nadu (33), Tripura (16), Uttar Pradesh (09), Uttarakhand (05), West Bengal (19).
An Indian cereals quartet from 1969

A cereals quartet mapped in great detail from 1969 – ragi in the old Mysore state (top left), barley in eastern Uttar Pradesh (top right), bajra in Maharashtra (bottom left), and jowar in Madhya Pradesh (bottom right).
I have taken the details from the lovely set of maps in the Indian Agricultural Atlas (the third edition) of 1969, which was printed at the time by the Survey of India (which provided the base maps). It cost, in those days, 90 rupees which was a small fortune, but little wonder, for the mapwork is superior.

Census 2011, the first big numbers release
![]() The Census of India has released the first batch of the primary census abstract. This is the heart of the gigantic matrix of numbers that describes India’s population (to be correct technically, India’s population as it was in 2011 March). The PCA, as it is fondly known amongst the tribe that speak its arcane language, is the final and corrected set of numbers of the populations of India’s states, districts, blocks and villages – this corrects, if such correction was required, the data used in the Census 2011 releases between 2011 and now, which were officially called provisional results.
The Census of India has released the first batch of the primary census abstract. This is the heart of the gigantic matrix of numbers that describes India’s population (to be correct technically, India’s population as it was in 2011 March). The PCA, as it is fondly known amongst the tribe that speak its arcane language, is the final and corrected set of numbers of the populations of India’s states, districts, blocks and villages – this corrects, if such correction was required, the data used in the Census 2011 releases between 2011 and now, which were officially called provisional results.
This release of the PCA is detailed down to district level, and that means the block- and village-level releases are to follow. This gives us the rural and urban populations, the number of children between 0 and 6 years old and what gender they are, and it gives us the number of workers and dependents. Within workers, the PCA tells us who the ‘main’ and ‘marginal’ workers are (a distinction based on how much of the year they are employed). What is of great importance to our study of food and agriculture is that the data tell us how many cultivators and how many agricultural labourers there are.
Well then, without further ado, here is where you’ll find this new forest of numbers. First, there is a very good overview provided by the Office of the Registrar General and Census Commissioner of India (that’s the official title of the organisation that carries out the world’s largest census operation, yes yes, there is one larger enumeration but this is the most detailed census in the world) and you can download it here (a big ppt of about 9MB). Then there is the page on which the PCAs of the states and union territories can be found, which is here.
If you’ve hurried over to that last page you will have found that the xls files that correspond to each state and union territory are coded. That is the state code, and in my work I have found it far more useful to have a set of xls files that are named with both the state (or UT) 2 or 3 character forms and their Census codes. So, here they are, in alphabetical order:
Andaman and Nicobar Islands, Andhra Pradesh, Arunachal Pradesh, Assam, Bihar, Chandigarh, Chhattisgarh, Dadra and Nagar Haveli, Daman and Diu, Delhi, Goa, Gujarat, Haryana, Himachal Pradesh, Jammu and Kashmir, Jharkhand, Karnataka, Kerala, Lakshadweep, Madhya Pradesh, Maharashtra, Manipur, Meghalaya, Mizoram, Nagaland, Odisha, Puducherry, Punjab, Rajasthan, Sikkim, Tamil Nadu, Tripura, Uttar Pradesh, Uttarakhand, West Bengal. There, that’s all 35 – do let me know if any of these links are empty or pointing to the wrong file.
India in 2015 – 63 million-plus cities
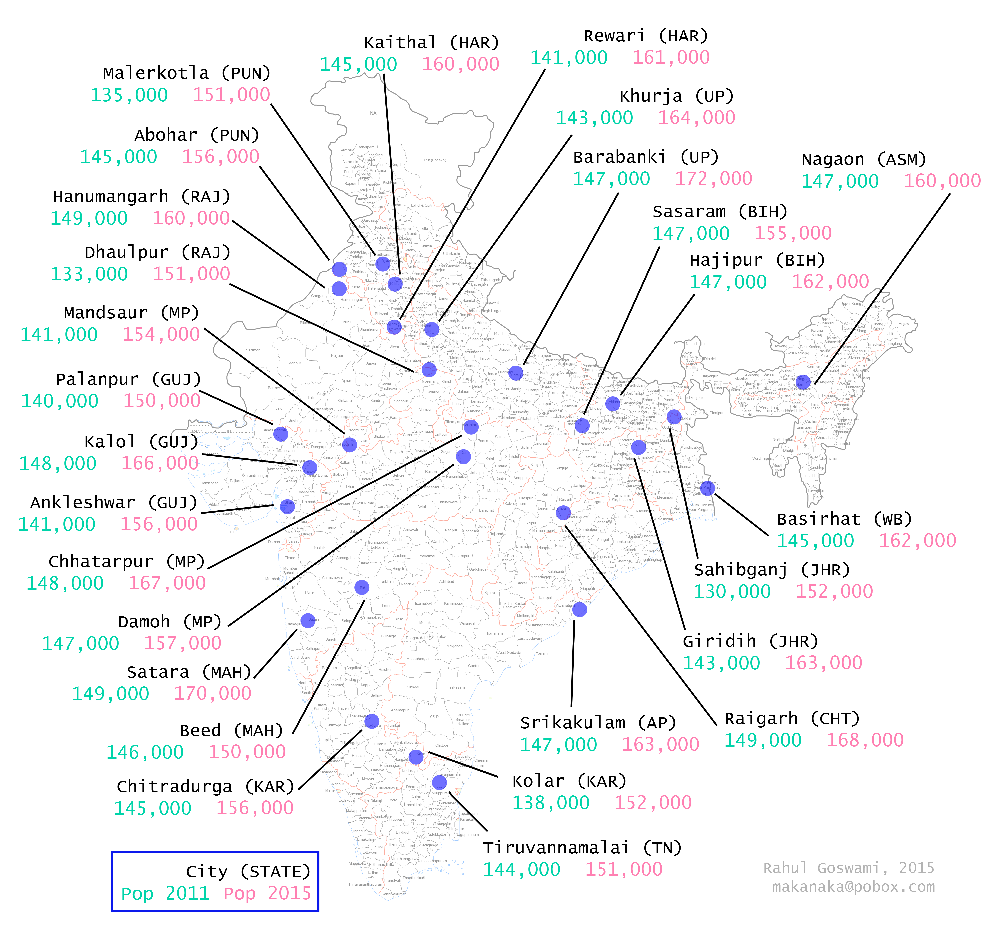 The 27 cities shown on this map are no different from many others like them in India today, and the selection of these 27 is based solely on a single numerical milestone which I am fairly sure few of each city’s citizens (or administrations for that matter) will have marked.
On some day during the months since March 2011, the population of each of these 27 cities has crossed 150,000 – this is the criterion. March 2011 is the month to which the Census 2011 has fixed its population count, for the country, for a state, a district, a town.
And so these 27 cities share one criterion – which they be quite unaware of – which is that when their inhabitants were enumerated for the 2011 census, their populations were under 150,000 whereas in the four years since that mark has been crossed.
[You will find more on the theme of population, the Census of India 2011 and urban and rural population growth here: ‘So very many of us’, ‘To localise and humanise India’s urban project’, ‘The slowing motion of India’s quick mobility’, ‘The urbanised middle class symphony’. Thematic and state-wise links to direct data files can be found at: ‘India’s 2011 census, a population turning point’ and ‘India’s 2011 census, the states and their prime numbers’.]
When the provisional results of the Census of India 2011 were released, through the year 2011, the number of cities with populations of a million and over was 53.

The number of cities with over a million inhabitants, from 53 in 2013 to 63 in 2015. Cities with names in red type will reach a million in 2015.
That was the tally almost two years ago. Between the 2011 census and the 2001 census the growth rate of the urban population was 31.8% which, turned into a simple annual rate for those ten years, is just under 3.2% per year.
At this rate, in mid-2013, six more cities will have joined the list of those with a population of over a million.
These six cities are: Mysore (in Karnataka, estimated population of 1,046,469), Bareilly (in Uttar Pradesh, 1,042,257), Guwahati (in Assam, 1,030,149), Tiruppur (in Tamil Nadu, 1,024,228), Sholapur (in Maharashtra, 1,011,609) and Hubli-Dharwad (in Karnataka, 1,003,886).
Within the next few months, India will have 59 cities with populations of over a million.
By mid-2015 (the final year of the Millennium Development Goals, or MDGs), there will be another four cities with populations of over a million: Salem (in Tamil Nadu, estimated population of 1,036,066), Aligarh (in Uttar Pradesh, 1,025,255), Gurgaon (in Haryana, 1,016,698) and Moradabad (in Uttar Pradesh, 1,002,994).
That year, Bhopal (Madhya Pradesh), Thrissur (Kerala) and Vadodara (Gujarat) will have populations of over two million; the populations of Kanpur and Lucknow (both Uttar Pradesh) will cross three million and that of Surat (Gujarat) will cross five million. India will have 63 (ten more than in 2011) cities with populations of at least a million.
These are projections that have not taken into account the state-wise variations of rural and urban growth rates. Also not accounted for is migration, as the migration data from Census 2011 has yet to be released.
