Archive for April 2016
Bharat at 1.3 billion
 In July 2016, the population of Bharat will cross one billion three hundred million. In 1937, the population of what was then British India was 300 million. Seventy-nine years later, there are a billion more.
This numerical landmark is based on the 2011 Census of India total population (which was 1.21 billion) and the growth rate of the population, or what demographers refer to as the rate of natural increase.
For a country of the size of Bharat – and for that matter, even for the states with large populations – any ‘total’ or ‘final’ is no more than an estimate that is subject to variability. The population count of any administrative unit (such as a state or district) can be estimated with census data modified by health data (birth rate, death rate) and by seasonal changes (migration).
There are several extenuating reasons why this exercise needs to be done automatically at least every month by the states and the central government ministries and departments. Perhaps the 1.3 billion landmark can goad them into doing so. The carrying capacities of our river basins, the watersheds, the valleys and floodplains, the ghats both Western and Eastern, the plateaus and grasslands, the deltas and the hill tracts cannot be ignored.
 Equations that govern these are simpler than they are typically made out to be by science. There is only so much water, land, forest, and vegetation (or biomass) available to support us. The 2001 Census found that the population of Bharat had crossed a thousand million. At that point at least the consequences of a steadily growing population (182 million had been added since 1991, and 345 million – which was the population at the time of Independence – since 1981) needed to have become the subject of monthly reflection and policy.
With Bharat at 1.3 billion being barely three months away, the new state population counts (in the chart) show why such monthly reflection and policy is vital, indeed a matter of urgency. We now have ten states whose population is more than 50 million – the comparisons of the sizes of our state populations with those of various countries around the world are now well-known.
West Bengal in May 2016 has a population of 97.7 million and will cross 100 million by the same time in 2017. In May 2016 the population of Bihar is 111.4 million, Maharashtra is 120.3 million and Uttar Pradesh is 214 million. These are gigantic numbers and it is because they are gigantic that they seem to escape planning notice – but the population of these four states is very much more than the population of the European Union of 28 countries.
The table shows the current estimated population (2016 May) for the age bands (from Census 2011 and adjusted for simple growth), which helps us understand the populations of infants, children, adolescents, youth, early adults, mature adults, the middle-aged and the elderly. About 257 million are under nine years old (19%), about 271 million are between 10 and 19 years old (20%) and about 111 million (8%) are 60 years old and older.
These are aspects that require as much study, comprehension and policy measures as we demand on subjects such as governance, corruption, the price of food, the extent of our forests, the supply of water, and the adequacy of monthly incomes. At the 1.3 billion mark, Bharat’s population is starkly in the foreground.
Food, climate, culture, crops and government

The weekly standardised precipitation index of the India Meteorological Department (IMD) which is a running four-week average. This series shows the advancing dryness of districts in south India.
In November 2015, the Departmentally Related Standing Committee on Agriculture of the Lok Sabha, Parliament of India, invited suggestions and submissions on the subject “Comprehensive Agriculture Research based on Geographical Condition and Impact of Climatic Changes to ensure Food Security in the Country”.
The Committee called for inputs on issues such as the need to evolve new varieties of crops which can withstand climatic fluctuation; requirement to evolve improved methods of irrigation; the need to popularise consumption of crops/fruits which can provide better nutrition; the need to develop indigenous varieties of cattle that can withstand extreme climatic stress; the need to develop a system for precision horticulture and protected cultivation; diversification of species of fish to enhance production from the fisheries sector; the need to strengthen the agriculture extension system; and means to focus on agriculture education.
I prepared a submission as my outline response, titled “Aspects of cultivation, provision of food, and use of land in Bharat today and a generation hence”. The outline I provided includes several issues of current urgency and connects them to scenarios that are very likely to emerge within a generation. My intention is to signal the kinds of pathways to preparation that government (central and state) may consider. It is also meant to flag important cultural and social considerations that lie before us, and to emphasise that economic and quantitative measurements alone are not equipped to provide us holistic guidance.
The outline comprises three sections.
(A) The economic framework of the agriculture and food sector and its imperatives.
(B) The social, ecological, and resource nature of crop cultivation, considering factors that influence it.
(C) Methods, pathways and alternatives possible to adopt with a view to being inter-generationally responsible.
In view of the current climatic conditions – heat waves in the central and eastern regions of the country, stored water in our major reservoirs which are at or near ten-year lows – I reproduce here the section on the economic framework of the agriculture and food sector and its imperatives. The full submission can be found here [pdf, 125kb].
This framework considers the agriculture and food sector, including primary agricultural production recorded, the inputs and products of industry based on agricultural raw material (primary crop whether foodgrain, horticulture, spices, plantation, ruminants and marine, oilseeds, fibres), agribusiness (processing in all its forms), supply chains connecting farmers and farmer producer organisations to primary crop aggregators, buyers, merchants, stockists, traders, consumers, as well as associated service providers. This approach is based on the connection between agricultural production and demand from buyers, processers and consumers along what is called the supply chain.

Water storage quantities in the 91 major reservoirs in the first week of April 2016. Blue bars are each reservoir’s full storage capacity (in billion cubic metres, bcm) and orange bars are the current storage at the time. Data from the Central Water Commission, Government of India.
If this framework is considered as existing in Bharat to a significant degree which influences crop cultivation choices, the income of cultivating household, the employment generation potential of associated service providers, then several sets of questions require answers:
* Concerning economic well-being and poverty reduction: what role does agricultural development need to play in promoting economic stability in rural (and peri-urban) regions thereby contributing to poverty reduction and how can the agrifood sector best contribute to jobs and higher incomes for the rural poor?
* Concerning food security: what role can agricultural and agro-industry development play in ensuring rural and urban communities have reliable access to sufficient, culturally appropriate and safe food?
* Concerning the sustainability of food producing systems: how should agriculture and agro-industry be regulated in a participatory manner so as to ensure that methods of production do not overshoot or endanger in any way (ecological or social) conservative carrying capacity thresholds especially in the contexts of climate change and resource scarcity?
When viewed according to the administrative and policy view that has prevailed in Bharat over the last two generations, there is a correlation between agricultural productivity growth and poverty reduction and this is the relationship the macro- economic and policy calculations have been based upon. Our central annual agricultural (and allied services) annual and five-year plan budget and state annual and five-year plan budgets have employed such calculations since the 1950s, when central planning began.
However the choices that remain open to us are considerably fewer now than was the case two generations (and more) ago when the conventional economic framework of the agriculture and food sector took shape.
How a district employs land and crop

A plotting of the cropland size categories with the number of holdings for the district of Hingoli in Maharashtra. The central group of rectangles displays the distribution, relative to each other, of the size categories of holdings (in hectares, ha.). The blue squares, also relative to each other, displays the number of holdings for each farm size category. The data source is the Agricultural Census 2010-11.
In the district of Hingoli, Maharashtra, the allocation of cultivated land between food crops and non-food crops is somewhat in favour of non-food crops. That is, for every hectare planted with a food crop 1.3 hectares is planted with a non-food crop. The broad categories we have under food crops are: cereals, pulses, vegetables and fruit. Under non-food crops there are: oilseeds, sugarcane, fibres, spices and fodder.

Where Hingoli district is in Maharashtra state.
The Agricultural Census 2010-11 detailed data for Hingoli shows that at the time of the survey 493,927 hectares were under cultivation for all kinds of crops, both food and non-food. As this is a count of how much land was under cultivation by crop, the total land under cultivation for all crops taken together is more than the total land under cultivation when measured according to land use. This is so because of crop rotation during the same agricultural year, inter-cropping and mixed cropping – for a plot, the same land may raise two kinds of crops in a year.
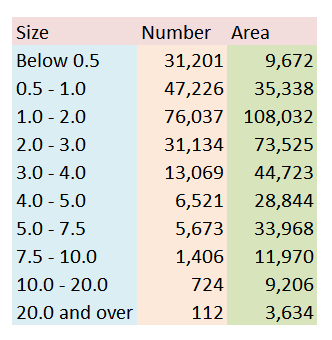
Size categories of farm holdings, with number of holdings and total area under each category for Hingoli district, Maharashtra.
The 493,927 hectares under cultivation in Hingoli are divided under 213,286 hectares for food crops and 280,640 hectares under non-food crops. This gives us the overall picture that the farming households of Hingoli choose to give more land for crop types under the ‘non-food’ category. As the settlement pattern of Hingoli is very largely rural – that means, few towns and these are the district headquarters and two more taluka centres – do the farming households of Hingoli grow enough to feed themselves comfortably? Do the farming households have the labour needed to continue cultivating so that they can feed themselves and their village communities? How are choices relating to land use and crop made?
Using the publicly available information from a variety of government sources, we are able to find parts of answers. The Agricultural Census 2010-11 is one such source, the Census of India 2011 is another, so are the tables provided by the Department of Economics and Statistics of the Ministry of Agriculture. The graphical representation I have prepared here helps provide the land use basis upon which to layer the district information from other sources.
A monsoon to look forward to

These gentlemen would welcome any news of a normal monsoon for 2016. Rice farmers in north Goa. Photo: Rahul Goswami
The Indian summer monsoon in 2016, for the months of June to September, will be normal to better-than-normal in almost all of the 36 meteorological sub-divisions. This is my reading of the seasonal climatic predictions provided by five different sources. Should the conditions that presage such a rainy season continue to be favourable, a normal monsoon coming after two years of faltering rain, and with drought conditions have set into many districts, will be a vast relief.
My outlook for the June to September 2016 monsoon period is based on an initial study of the three-monthly and seasonal predictions which are in the public domain, from the following agencies: The Climate Prediction and Monitoring Group of the India Meteorological Department (IMD), Ministry of Earth Sciences, Government of India; the Climate Forecast System Version 2 (CFSv2) by the Climate Prediction Center of the National Centers for Environmental Prediction (NCEP), USA; regionalised Multi-Model Ensemble (NMME) forecasts from the Climate Prediction Center which are based on models of the NOAA and NASA; and the Meteorological ‘Met’ Office of Britain which is a World Meteorological Organisation climate research centre.

Components of a typical model ‘ensemble’
Combining the indications from this early set of forecasts we see that after typical monsoon conditions have set in over southern and peninsular India, the June and July rainfall (quantities) should be normal for June with an increase in average rainfall for July (in the southern peninsula, the west coast, north-eastern states and the north India mountainous states). The five models currently also point to the August and September period recording above normal rainfall over most of India, and normal rainfall in central India.
Predictive capabilities have increased over the last few years, and a number of national weather service agencies collaborate to share data and expertise on climate models. There is much collaboration particularly for the Asian monsoons – our Indian summer monsoon and the monsoon of south-east Asia – because of the implications for the volumes of food crops, in particular rice and wheat, that are likely to be sown and then harvested.
The climatic prediction models whose forecasting products I examined make their predictions for 90-day periods (such as May, June and July together) based on conditions observed and calculated for a given month (January, February and March so far). Later in April and then twice again in May I will consolidate and expand the scope of this initial prognosis – which is of a normal to above normal monsoon – as the forecasts are updated. [This is also posted at India Climate Portal.]
