Archive for October 2015
Cities by numbers, a count of our cities
 The 27 cities shown on this map are no different from many others like them in India today, and the selection of these 27 is based solely on a single numerical milestone which I am fairly sure few of each city’s citizens (or administrations for that matter) will have marked.
On some day during the months since March 2011, the population of each of these 27 cities has crossed 150,000 – this is the criterion. March 2011 is the month to which the Census 2011 has fixed its population count, for the country, for a state, a district, a town.
And so these 27 cities share one criterion – which they be quite unaware of – which is that when their inhabitants were enumerated for the 2011 census, their populations were under 150,000 whereas in the four years since that mark has been crossed.
Any population mark is as arbitrary as any other. What such an exercise does help with is that the spotlight of awareness about our living spaces can once more shine on that factor which stands above all others: our numbers. It is these numbers that dictate our impacts, as individuals and as householders, on the environment and its gifts.
 That’s why it is of scant interest to us that the city of Palanpur in the district of Banas Kantha (Gujarat) would have crossed the 150,000 mark only very recently, perhaps one or two months ago, just like the city of Beed in the district of the same name (Maharashtra).
It is also of scant interest that whereas the city of Barabanki (district Barabanki in Uttar Pradesh), crossed the mark within a year after March 2011, it was in 2013 that Kaithal (district Kaithal, Haryana) crossed the same mark (as did Sasaram, in the district of Rohtas, Bihar).
On this map, some of the increments seem small – look at Damoh in Madhya Pradesh and Tiruvannamalai in Tamil Nadu. What is of interest to us the cumulative impact of these small increments over time.
When the great enumeration of 2011 fixed their populations, these 27 cities taken together were home to 3.88 million people. In 2015 September about 4.3 million people live in the same 27. The difference between the two totals – about 405,000 people – is more than the population of any two on this short list together!
This is but the briefest outline for 27 cities only. Using a conservative estimate for the annual population growth rate there are in 2015 September 238 cities (including these) whose populations are between 100,000 and 200,000 – Nabadwip in Nadia district (West Bengal), Neyveli in Cuddalore district (Tamil Nadu) and Rae Bareli (Rae Bareli district, Uttar Pradesh) have all just crossed the 200,000 population mark.
So many households, some in slums (pucca and ‘regularised’, or with blue plastic sheets for a roof and water mafias in control) and some in tenements, some owning a car and two-wheeler both and others reliant on public transport and the kindness of neighbours, very very few with electricity around the clock and every one of those that can afford it with an inverter or UPS. All, humble or well-to-do, with a monthly food budget and all, humble or well-to-do, with dreams and hopes.
The colossi of Guangdong

West of Hong Kong lies one of the most extraordinary landscapes in the world, as much for the dense concentration of urban zones, of industrial and factory regions, but also for the change that has occurred over the space of a generation. In the 1970s, the Pearl River Delta was a mainly rural region. Of course there was Guangzhou (known to the world as Canton) but the rest of the sprawling delta was village. The Pearl River itself (‘Zhu Jiang’ in the Chinese) is China’s third longest river, but the second largest by volume of water which moves (after the Yangtze) and its course and seasons governed a basin in south-central China that is just over 400,000 square kilometres large.
The nine cities of the Pearl River Delta together form the world’s most urbanised region. Where did they come from? According to most annals of trading history concerning China, in the late 17th century the Qing government became more open to foreign trade and when that happened Guangzhou (Canton) quickly became a suitable port.

A shipping container terminal whose size defies the scale the eye can gauge, but one of several in the Pear River delta region.
The Portuguese in Macau, the Spanish in Manila, Arabs from the Middle East and Muslims from India were already actively trading in the port of Canton by the 1690s, when the French and English began frequenting the port through the ‘Canton System’ (which was the name given to the imperial court’s regulatory response to what it saw, that long ago, as political and commercial threats). But for the Pearl River Delta, the gates had been opened – the Ostend General India company arrived, so did the Dutch East India Company, then came ships from most western colonial powers.

Over every horizon in every direction but towards the sea is such a landscape, teeming with structures and over-crammed with multi-tiered infrastructure.
By the middle of the 18th century, Guangzhou had already emerged as one of the world’s great trading ports, and the ‘Thirteen Factories’ (not in fact factories at all but the designated areas of the port in where foreign trading was conducted) which were given imperial leave to operate, ensured the distinction was maintained until the outbreak of the First Opium War (1839) and the opening of other ports a few years later.
When, in the 1990s, China became known as the factory of the world, the province of Guangdong (of which Guangzhou is the capital) was where these manufactures were done. This is the activity which has made the province both the most populous in China and the biggest contributor to national GDP. What has also happened is the most rapid urban expansion in human (and Chinese) history. In a little more than 30 years, the Pearl River Delta region has become the epicentre of the Chinese manufacturing and consumer economy.
Over two generations, the urbanisation rate has increased from 28% to 83% which in effect means that where once not very long ago two-thirds of the residents pursued agriculture-based livelihoods, now four-fifths live in fully urban environments. The scale and speed of this transformation is astonishing. The cities of the Pearl River Delta have since 2008 been also referred to as a single interconnected zone of megacities, as their perimeters have blurred, they merge through wide highways and fast railway links and the endless manufacturing zones with their vast factory structures. The entire region has a geographical size larger than Denmark or Switzerland – with a wide river lined thick with docks and crammed with watercraft running through in the middle.

As densely packed as components on printed circuit boards, but these factory zones are kilometres long on each side, and their clones fade into the blue industrial haze.
Working and living here is the largest urbanised population in the world – Guangzhou with 12.8 million, Shenzhen with 10.5 million, Dongguan with 8.3 million, Foshan with 7.3 million and the rest (Huizhou, Zhongshan, Jiangmen, Zhaoqing and Zhuhai) with another 18 million together) for a linked agglomeration of 56.9 million people. This enormous urbanised region accounts for 4.2% of China’s total population, and for 9.3% of its GDP. The multi-megalopolis has been assembled through the completion (and continuous expansion) of more than 150 major infrastructure projects (each by itself would be a significant milestone in a small country) which have helped the colossal network of transportation, water, energy supply and telecommunication to function every day.
There are labyrinths of roads, tunnels and bridges across the delta, as well as intra- and inter-city railways so that the residents of the Pearl River Delta speed from any one of the nine cities to another in an hour or less. Extending south-eastwards, these lead into Hong Kong, the Special Autonomous Region, whose economic might and cultural richness are both natural guides for the Pearl River multi-megalopolis but also (as seen from within Hong Kong, and perhaps Beijing) its competitor. Will the Pearl River Delta – the world’s biggest concentration of manufacturing megawattage, of people and of infrastructure – eventually absorb Hong Kong?
[Photos by Rahul Goswami, 2015.]
The uses of a Nobel prize in economics
The 2015 Nobel prize for economics has been awarded to Angus Deaton, who is based in the Princeton University, in USA. Deaton’s work has been on poverty and his contemporaries in the field are Amartya Sen and Jean Dreze; all three have focused on poverty, malnutrition, consumption by households and how to measure these.
Herewith my view which I set out in a series of 37 tweets:
1 – like every single Nobel award category, the one for economics is calculated recognition of the use of Western ideas.
2 – There is no Nobel in economics for, say, Pacific islander economics or nomadic/pastoral economics. The boundary is clear.
3 – There is the additional problem, and it is a weighty one, of what is being recognised: a science or a thought experiment?
4 – Western economics can only ever and at best pretend to be a science (ignore the silly equations). There’s more.
5 – It has to do with food and food consumption choices. Do remember that. For the last 5-6 years the food MNCs and their..
6 – collaborators in Bharat have moved from hunger to nutrition. Remember that we grow enough food for all our households..
7 – and there are in 2016 about 175 million rural and 83 million urban households. So, food is there but choice is not yet..
8 – as clear as the marketeers and retailers pretend. No one truly knows, but economists claim to, and this one does.
9 – What then follows is the academic deification of the thought experiment, done carefully over a decade. The defenders..
10 – of the postulations of Deaton, Dreze, Sen et al turn this into a handmaiden of poverty study. And India is poor..
11 – (but Bharat is not). So we now have consumer choice, poverty, malnutrition and a unified theory to bridge the mess..
12 – for such a third world mess can only find salvation through the scientific ministrations of Western economics. The stage
13 – was thus set some years ago, when the Congress/UPA strove abundantly to craft a halo for this thought experiment..
14 – and in the process, all other explanations concerning food and the manner of its many uses were banished from both..
15 – policy and the academic trend of the day. But Deaton’s experiment is only as good as his references, which aren’t..
16 – for the references, as any kirana shop owner and any mandi bania knows, are more unreliable than reliable. What our..
17 – primary crop quantities are have only ever been a best estimate subject to abundant caution and local interpretation..
18 – for a thought experiment which seeks to unify food, malnutrition, poverty and ‘development’ this one has clay feet..
19 – which nevertheless is good enough for the lords of food crop and seed of the world, for it takes only the shimmer of..
20 – academic respectability such as that accumulated by Deaton, Dreze and Sen to turn postulate into programme. What we..
21 – will now see is what has been seen in medicine (and therefore public health) and in ‘peace’ (hence geopolitics) because..
22 – of the benediction the Nobel aura confers. This work will be press-ganged into the service of the new nutritionists..
23 – whose numbers are growing more rapidly than, a generation ago, did the numbers of the poverty experts. It is no longer..
24 – food and hunger and malnutrition but consumer choice, nutrition and the illusions of welfare. This is the masala mix..
25 – seized upon by those who direct the Nobel committee as they seek to control our 105 million tons of rice, 95 of wheat..
26 – our 43 million tons of coarse cereals, 20 of pulses, 170 of vegetables and 85 of fruit and turn this primary wealth..
27 – of our Bharat into a finance-capital manifesto outfitted with Nobel armoury that is intended to strip choice (not to..
28 – support it) from our kisans who labour on the 138 million farm holdings of our country (85% of them small and marginal)..
29 – and from our 258 million households (as they will be next year) towards whose thalis is destined the biofortified and..
30 – genetically modified menace of hyper-processed primary crop that is digitally retailed and cunningly marketed. This..
31 – is the deft and cunning manoeuvring that has picked on the microeconomist of post-poverty food study aka nutrition..
32 – as being deserving of Nobel recognition (when five years ago the Nobel family dissociated itself from this category).
33 – And so the coast has been duly cleared. The troublesome detritus of poverty macro-economics has been replaced by the..
34 – big data-friendliness of a rickety thought experiment which lends itself admirably to a high-fashion ‘development’..
35 – industry that basks in ‘sustainable’ hues and reflects the technology-finance tendencies of the SDGs. Food is no longer..
36 – in vogue but the atomisation of community crop and diet choice most certainly is. The pirate pennant of Western macro-
37 – economics is all aflutter again, thanks to the Nobel wind of 2015, but I will not allow it to fly over my Bharat. Never.
PS: The Western media has as usual waxed cluelessly eloquent on the selection of the award winner. This is the new York Times writing itself breathless about what this means for understanding the situation of the poor in the global economy. There is an account from Princeton [pdf] on the measuring of poverty, which has now become such a burgeoning industry. The statement of the committee which awarded this economist is here, with a more detailed version here [pdf].
Water and a district in Maharashtra

In this panel of maps the relationship between the district of Parbhani (in the Marathwada region of Maharashtra) and water is graphically depicted over time. The blue squares are water bodies, as seen by a satellite equipped to do so. The intensity of the blue colour denotes how much water is standing in that coloured square by volume – the deeper the blue, the more the water.
Water bodies consist of all surface water bodies and these are: reservoirs, irrigation tanks, lakes, ponds, and rivers or streams. There will be variation in the spatial dimensions of these water bodies depending on how much rainfall the district has recorded, and how the collected water has been used during the season and year. In addition to these surface water bodies, there are other areas representing water surface that may appear, such as due to flood inundations, depressions in flood plains, standing water in rice crop areas during transplantation stages. Other than medium and large reservoirs, these water features are treated as seasonal and some may exist for only a few weeks.
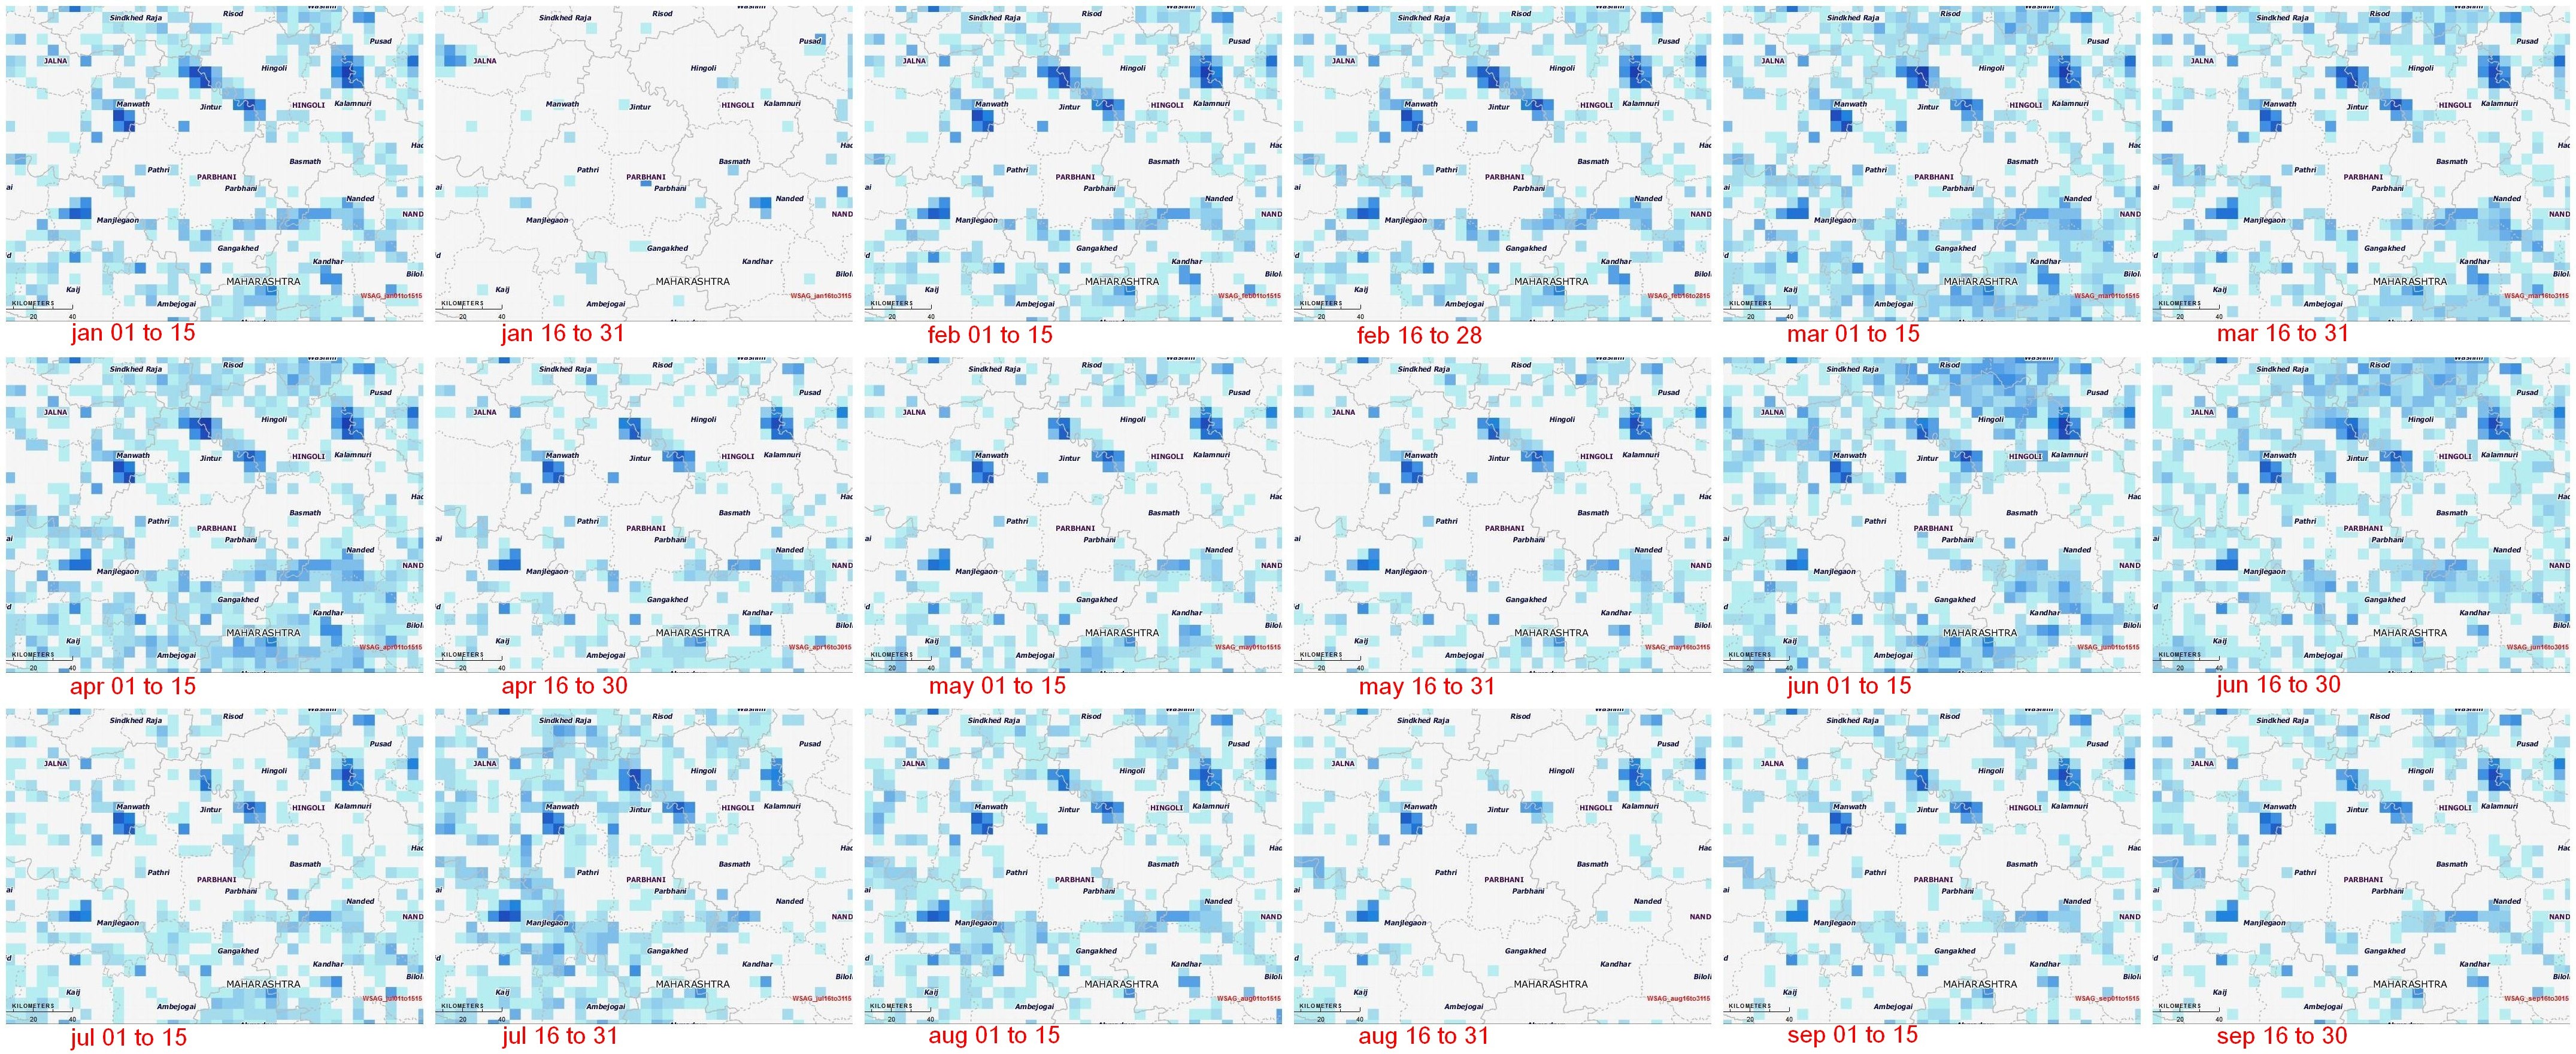
Click on this detail for a full size image (1.7MB) of the panel of fortnightly maps.
The importance of monitoring water collection and use at this scale can be illustrated through a very brief outline of Parbhani. The district has 830 inhabited villages distributed through nine tehsils that together occupy 6,214 square kilometres, eight towns, 359,784 households in which a population of 1.83 million live (1.26 rural and 0.56 million urban). This population includes 317,000 agricultural labourers and 295,000 cultivators – thus water use and rainfall is of very great importance for this district, and indeed for the many like it all over India.
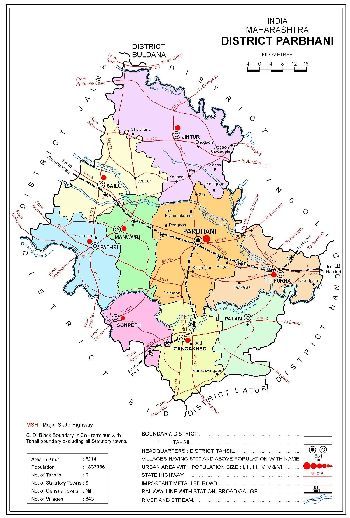
The map of Parbhani district and its talukas, from the Census 2011 District Census Handbook.
This water bodies map for Parbhani district is composed of 18 panels that are identical spatially – that is, centred on the district – and display the chronological progression of water accumulation or withdrawal. Each panel is a 15-day period, and the series of mapped fortnights begins on 1 January 2015.
The panels tell us that there are periods before the typical monsoon season (1 June to 30 September) when the accumulation of water in surface water bodies has been more than those 15-day periods found during the monsoon season. See in particular the first and second fortnights of March, and the first fortnight of April. [Here is a good quality image of the census map, 968KB.]
During the monsoon months, it is only the two fortnights of June in which the accumulation of water in the surface water bodies of Parbhani district can be seen. The first half of July and the second half of August in particular have been recorded as relatively dry.
This small demonstration of the value of such information, provided at no cost and placed in the public domain, is based on the programme ‘Satellite derived Information on Water Bodies Area (WBA) and Water Bodies Fraction (WBF)’ which is provided by the National Remote Sensing Centre (NRSC), Indian Space Research Organisation (ISRO), Department of Space, Government of India.
For any of our districts, such continuous monitoring is an invaluable aid to: facilitate the study of water surface dynamics in river basins and watersheds; analyse the relationships between regional rainfall scenarios and the collection and utilisation of water in major, medium reservoirs and irrigation tanks and ponds; inventory, map and administer the use of surface water area at frequent intervals, especially during the crop calendar applicable to district and agro-ecological zones. [Also posted on India Climate Portal.]
The Indo-Pak orange line four years later
Almost exactly four years ago, in September 2011, the border between India and Pakistan was photographed by an astronaut on the International Space Station. It showed the border as a long orange line, one of the few international borders that can be seen from low earth orbit.
On 23 September 2015 the space agency NASA released a new picture. The line is as long and orange as it was, perhaps more fortified now. The cities visible on both sides of the very well lit frontier are more populous, and certainly emit more light in 2015 than they did in 2011.

An astronaut aboard the International Space Station took this nighttime panorama while looking north across Pakistan’s Indus River valley. The right half of the picture is occupied by the western districts of Rajasthan. Image: NASA
I have added names to the clusters of bright lights seen in the new photograph. In western Rajasthan, Jodhpur, Barmer, Bikaner and Jaisalmer are all visible. In southern Pakistan, Karachi and Hyderabad are easily made out. The media has used the new photographs too, as you can see here, here, here and here.
A high resolution image is available here from Nasa’s Earth Observatory website. Another night image shows the border zone looking south-east from the Himalaya. An older daytime view shows the vegetated bends of the Indus Valley winding through the otherwise desert landscape.
